Author Archive

Comparing FIPS and xFIPS Using Batted Ball Distance

In one of the World Series chats I hosted, it was stated that Matt Cain gave up weak fly balls and that is the reason that his xFIPs (2010 = 4.19 and lifetime = 4.43 ) are higher than his FIPs (2010 = 3.65, lifetime = 3.84). After finally getting all the wrinkles worked out, I am able to get the average distance for fly balls given up by a pitcher. So, does the fly ball distance given up by a pitcher help to explain the difference between his xFIPs and FIPs?

I took just the pitchers that threw over 60 innings in 2010 and subtracted their FIPs from their xFIPs. Then I got the average distance of all the fly balls for these pitchers and here are the top five leaders and laggards:

Read the rest of this entry »


Examining ISO Changes From 2009 to 2010

Every year there are several players that surprise and disappoint with their power numbers. Today, I am going to look at the players (min of 400 PA) that increased or decreased their ISO the most from 2009 to 2010. Besides just looking at the numbers, I have gone ahead and run a LOESS regression against some player’s line drive and fly ball data to help find the cause of the change in power. First of all, here are the leaders and laggards:

Read the rest of this entry »


Negative WAR: 2010 Team Data

Each team every year doesn’t make perfect personnel decisions and ends up playing several players that produce at below replacement level. The reasons for playing these players are many (i.e. a player’s talent has degraded since they last played, injuries devastating the team, inability to evaluate talent, etc). Today, I will look at team totals for negative WAR players (I ignored any negative WAR generated by pitchers hitting).

Read the rest of this entry »


Comparing Plate Discipline: Visually and Numerically

Here at Fanpraphs, we have plate discipline recorded for each hitter going back to 2002. These values are useful, but how do these values translate into the exact strike zone that a players uses? Today, I decided to look at how the visual and numerical plate discipline compares for three players, Brett Gardner, Vladimir Guerrero, and Torii Hunter.

Read the rest of this entry »


Predicting a Team’s Wins Using Underlying Player Talent

I have been wanting to have this win prediction tool available for a while and finally have what I think is rather simple working model. This spreadsheet can be filled out with the players anyone thinks will be playing, along with their all their stats and then the team’s projected wins will be calculated.

Note: An error was found on the spreadsheet dealing with position adjustment and corrected around 4:30 EST on 11/4. If you downloaded it before then, you will need to re-download it. Sorry for the inconvenience. -Jeff

While it can be used to get an idea of how many wins a team might get in the up coming season, I plan on using it to evaluate changes in a team. Those changes could be a free agent signing, a trade, an injury or a rookie called up to the majors. The team’s expect wins before or after the roster change can be evaluated .

Today, I am not going to do look at any team. I just wanted to make it available and once the Royals sign Cliff Lee, I can see how their expected wins compare before and after the acquisition.

Read the rest of this entry »


World Series Game 2 Live Blog


World Series Umpire Heat Maps

The umpires have finally been announced for the World Series. The crew consists of John Hirschbeck (crew chief), Sam Holbrook, Bill Miller, Mike Winters, Jeff Kellogg, and Gary Darling. That list is in the order that they will work behind home plate.

Using a combination of Pitch F/X and game results (K/9 and BB/9), here is how the umpires rank from the most pitcher friendly to most hitter friendly:

Bill Miller
John Hirschbeck
Mike Winters
Gary Darling
Sam Holbrook
Jeff Kellogg

For a comparison, here are right and left handed strike zones for the two umpires on the extremes, Bill Miller and Jeff Kellogg (the rest of the umpire zones is available at the end of the article).

The scale given is the ratio of called strikes to the total number of called strikes and balls. The box is the rule book strike zone with the inner circle for reference only. The zone is from the hitter’s perspective looking home.

Right Handed Hitters

Bill Miller

Jeff Kellogg

Left Handed Hitters

Bill Miller

Jeff Kellogg

Hopefully, the umpires will not be involved in any major controversies this world series, but who knows. At least none of these umpires are at the extreme ends of the strike zone spectrum. Compared the previous playoff series’s this off season, this crew’s strike zone should be one of the more consistent ones.

Read the rest of this entry »


2010 Disabled List: Injury Locations

In a couple of previous articles, I looked at the 2010 disabled list data for all the teams and player positions. I have finally gone through and compiled the data on body part locations.

Last year Josh Hermsmeyer compiled an injury database with 2002 to 2009 DL information. In it, he set a format for selecting the various body parts. I have gone ahead and used the same categories. I have made another spreadsheet (Sheet 2) with these various designations for people to use. I will format the 2010 injury information so it can be combined with Josh’s data once the new retrosheet data set is released after the playoffs are completed.

To make the body location data easier for interpretation, I have combined Josh’s categories into a few broad categories:

Arms and Hands – hand, wrist, forearm, upperarm
Elbow – elbow
General – generalmedical
Hip – hip
Legs and Feet – ankle, foot, knee, thigh, lowerleg
Neck and Head – face, head, neck
Shoulder – shoulder
Trunk – upperback, back, chest, abdomen

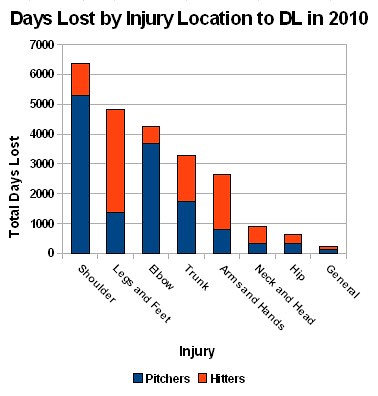
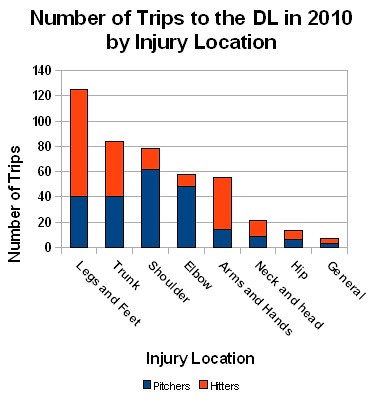
First, here is the injury location data for total days and trips for pitchers and hitters to the DL:
Location_days

Location_trips

No real surprise here with pitchers dominating days lost to elbow and shoulder injuries and hitters mainly having injuries to their arms and legs.

Finally, here is a comparison of the average number of days lost for pitchers and hitters.

Location_ave

Pitchers take longer to get off the DL, excect for hip and general injuries. Well that is it for today. My next project is a little more ambitious as I want to find the chances of a player going on the DL knowing a set of conditions (i.e. previous injury history, age, etc).


Game 3 ALCS Preview: Texas Rangers 

Base Running

The Rangers exhibit and take pride in being aggressive when running the bases. They have had good results so far in the post season. Tonight though, they may have to calm it down a bit since Andy Pettitte is on the mound. Andy has a great pick off move and does a great job of keeping runners near first base. With runs possibly being at a premium tonight, none of the Ranger base runners can pull a “Kinsler” and get picked off of first base.

The Rangers don’t have to shut down their running game. They can be aggressive once the ball is in play or even look at stealing third base against Jorge Posada. They just can’t afford to give away any outs at first base tonight.

Cliff Lee May

Cliff Lee has been throwing lights out so far this post season. He will not maintain this complete dominance throughout the entire post season (see Roy Halladay). He may come down to earth, regress a little and allow some crazy number of runs like three or four. The Rangers should be looking to add runs whenever they can. They can’t expect him to be as lights out as he was against Tampa, especially against the Yankees lineup.

Robinson Cano ….

… is a very good hitter. I followed the Royals during the regular season, which means I only get a heavy dose of the AL Central players. I am impressed with Cano.

Rangers Bullpen

So far this LCS, the Rangers have used Neftali Feliz, Derek Holland, Darren O’Day, Alexi Ogando, Darren Oliver and Clay Rapada in relief. During the regular season, these six pitchers average 0.31 BB/IP and 0.97 K/IP. During the LCS, the six have maintained a similar strikeout rate of 0.94 K/IP, but their walk rate has almost quadrupled to 1.13 BB/IP. Though this is a small sample size, the bullpen can’t keep giving up over one walk per inning and expect to hold the Yankees scoreless. As seen in game one, the Yankees are too good to give them one or more free base runners in an inning.


Game 1 ALCS Preview: Texas Rangers

Here are a few notes I have on today’s game and the entire series.

Weather

The Rangers need to take notice that the weather is cooling down and batted balls will not travel as far when hit. As Robert Adair notes in the Physics of Baseball, a 400 foot fly ball hit to center field will travel four feet less for every ten degrees in temperature drop. The temperature for today’s game is projected to be about 10 degrees cooler than many of the late season night games. Acknowledging this change is especially important when the Rangers are at home. All players should be running as if the ball is in the park until they know for sure that they hit a home run.

Umpires

The umpires have been announced for the series and they probably will work home plate in the following order: Gerry Davis, Tony Randazzo, Jim Reynolds, Angel Hernandez, Fieldin Culbreth, and Brian Gorman. Game one’s home plate umpire, Gerry Davis, has one of the smallest strike zones in the league. Here is a comparison of Davis’s, Tony Randazzo’s (umpire in the crew closest to a standard zone) and Brian Gorman’s (most pitcher friendly umpire of the crew) strike zones for right and left handed hitters.

The scale given is the ratio of called strikes to the total number of called strikes and balls. The box is the rule book strike zone with the inner circle for reference only.

Right Hand Hitters

Gerry Davis

Tony Ranazzo

Brian Gorman

Read the rest of this entry »