Baseball’s Best Bad-Ball Hitter
On Friday, I talked about the current iteration of the Royals, and their propensity toward making contact on a lot of pitches outside the strike zone. In one of the graphs I created, I presented the relationship between O-Contact% and ISO. After some spirited comments on the article about the lack of correlation (given the small sample size and lack of R2), I got to thinking: What is the actual relationship between the percentage of times a batter makes contact on pitches outside of the strike zone (O-Contact%) and offensive production, especially power?
We know certain facts related to the topic of the impact of plate discipline statistics — like players that swing at more pitches out of the strike zone tend to have lower walk rates — but today we’re interested in just O-Contact% and the headline maker, power. This is in large part due to my sometimes unhealthy fascination with the Royals of the past few years, who have been known for winning (at least last year) while not exactly crushing the ball. They only hit 20 home runs through the first 43 games of 2014 and were dead last in ISO (.113) at the end of the season. They also came within a game of winning the World Series, because baseball.
While the Royals might make a great case study, we shouldn’t be too quick to jump to conclusions given their unusual plate discipline statistics and lack of power: we should let the much larger sample size I’m about to go over tell the story. We’re going to focus on two statistics today in relationship to plate discipline: one is ISO, so we can look at raw power, and the other is wOBA, so we can have a look at a more general, catch-all measure of offensive value. Then we’re going to look at a player who truly stands out in the data.
The larger sample size I’ve been mentioning is all players since 2002 with over 400 plate appearances. 2002 was the first year we had these advanced discipline statistics, so I’ve cast the largest net I could, while also making sure that we have a long enough time period per season for the statistics to effectively stabilize. Yes, one year of ISO and wOBA can be outliers, but my hope is that including over 2,000 data points will account for a lot of the natural variability.
A few notes on the statistical background for these plots, before we go any further: our trend lines in this study all have very low p values but also low R2 values, mostly because there is a lot of variability around the lines (i.e. the data points are scattered high above and below the trend lines). This is expected in something as variable as baseball, and mostly indicates difficulty in assigning future predictive value onto the trend. However, our low p values still indicate there is a relationship between the two statistics that are compared in each plot. I’ve put both the r value and R2 below each graph – the p values for both charts are <.0001.
Now, let’s take a look at something we went over quickly on Friday: the relationship between ISO and O-Contact%. Take a look:
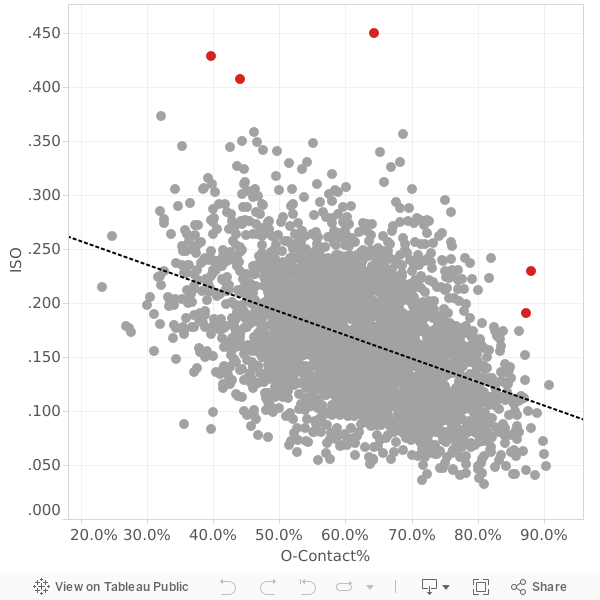
![]()
With the much larger sample size, we can get a clearer view of the relationship between these two statistics. Our -.44 r value tells us (and we can see pretty clearly) that there is a moderate inverse relationship between O-Contact% and ISO, though our low R2 value indicates it will be difficult to predict one statistic based on the other in the future. We’ll get to those distinct red data points in just a moment, but first, let’s look at the relationship between O-Contact% and wOBA to get a better gauge on how contact outside the zone impacts overall production at the plate:
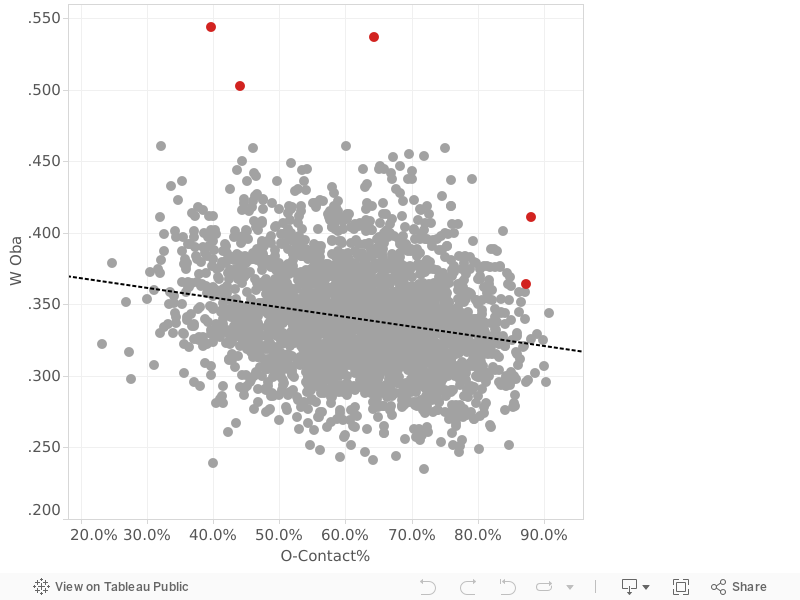
| r | r2 | |
|---|---|---|
| O-Contact%/wOBA | -0.21 | 0.05 |
This is a much weaker relationship, as we can see, though there does appear to be a slight downward trend to the two. In theory, this makes sense: it may be much easier to flare a single into the outfield on a pitch outside of the zone than it is to drive a double into the gap off of the same pitch.
Now, to the fun stuff: the first thing you might notice in both charts is the three red dots at the top.
For all those that guessed correctly, congratulations: they are Barry Bonds between the years of 2002-2004. He singlehandedly forced me to increase the upper range of the y-axis by 100 points (thanks, Barry).
Whatever you think of him, Bonds could hit better than anyone else could by a wide margin during those years, and this is a somewhat hilarious representation of that. What also strikes me about those three years is his O-Contact% and ISO went up every year running during that time span. That means that Barry Bonds effectively expanded his hit zone at the plate for three years in a row, posting better power numbers each year: I imagine Bonds simply decided he wanted to hit more pitches off the plate, especially in 2004, and did.
The other conclusion to be taken from these plots is the other two dots on the right side of the graphs. They show that Victor Martinez is perhaps the best combination of plate coverage and power. The greatness of Martinez has been highlighted many times on this site, but I’ll throw my hat into the ring with this particular study: Martinez not only makes exceptional amounts of contact on pitches he swings at outside of the strike zone, but also hits for great power, which is a very unusual combination.
Bonds never even came close to approaching the level of contact on pitches outside of the zone that Martinez does – and while no one is at the level of production that Bonds was during the span of 2002-2004, Martinez is pretty great nowadays. Here’s one example of Martinez’ power ability on pitches out of the zone:

That is an 0-2, 91 MPH, above-the-letters fastball from Brad Peacock. Most hitters, if they’re unable to lay off, foul this pitch off or pop it up. Instead, Victor Martinez hits it into the right field stands. Only three other left handed hitters in all of 2014 hit an 0-2 fastball in that part of the hitting zone for a home run. That’s really the greatness of Victor Martinez – other hitters might hit a ball outside the strike zone with authority once in awhile, but he does it for entire seasons. Other hitters might make contact with the terrible pitches that catch our eye — I’m thinking of Pablo Sandoval in particular — but no one does it more effectively than Victor Martinez, and that makes him truly baseball’s best bad ball hitter.
Owen Watson writes for FanGraphs and The Hardball Times. Follow him on Twitter @ohwatson.
I love me some V-Mart, but there is a difference between bad balls and balls. Balls on the edges of the strikezone and balls in the dirt. When I think bad ball hitter I think Vlad hitting a bouncing pitch or Sandoval practically falling into the other batter’s box. This method also don’t look at a hitter’s power specifically on pitches outside the strikezone. It looks at overall power. I want to know who has the highest ISO on contact with pitches outside the strikezone.
I was thinking the same things, especially when I saw the Barry Bonds data points called out. It would be interesting to see these charts stratified by O-Swing%.
A lot of the great hitters above the line are guys who are guys like Mauer, Votto, Pujols, Bautista etc. who are very disciplined and have enough bat control to regularly fight off borderline pitches or take the pitch 2 inches of the outside corner and slicing it down the line.
That’s a very different skill than the one on display by V-Mart in the GIF, aggressively turning on a pitch clearly out of the zone and depositing it in the stands. This more akin to what we see from Pablo Sandoval, Ryan Bruan, Aramis Ramirez, or Jose Abreu — guys who chase more regularly.
And, as you said, if we’re talking about the ability to do damage out of the zone, we should be looking at ISO on O-Contact, not plain old ISO.
“I imagine Bonds simply decided he wanted to hit more pitches off the plate, especially in 2004, and did” Maybe it was becasue the pitchers refused to throw him a stike, note 232 walks in 2004. I remember Barry could just stand there and walk literally every time if he wanted.
I looked at that as well, thinking that his Zone% probably plummeted in 2004, but it didn’t. His Zone rate actually stayed pretty steady through those three years and even increased in 2004:
2002: 43.1%
2003: 41.9%
2004: 44.4%
They’re certainly lower than the average for this sample (49.3%), but his contact rates across the board improved in 2004, so it wasn’t just that pitchers wouldn’t go after him.
Can we call this the Vladimir Guerrero Award? The Vlady deserves a place.
Ohhhh, I’m sorry, but the answer we were looking for was “Who is Adam Jones? That’s: Adam Jones.”
Remember, Alex, I told you:
We’ll meet again
Don’t know where
Don’t know when
But I know we’ll meet again
Well what do you know…. guys that are the best bad-ball hitters are also one of the best hitters period
Vlad Guerrero learned everything he knew about bad ball hitting from Yogi Berra. Bonds was more of a bad boy hitter.
Good stuff here. Sandoval was my guess as I started to read.