Breaking Down Jose Altuve’s ALDS Struggles

The Division Series between the Astros and Mariners only went three games, but it wasn’t short on drama. Overlooked amid the extra innings madness and the late game heroics was the performance of Jose Altuve. That might be for the best, as the Astros second baseman struggled mightily:
| Season | BB% | K% | AVG | OBP | SLG | wRC+ |
|---|---|---|---|---|---|---|
| Regular Season | 5.9% | 14.4% | .300 | .387 | .533 | 164 |
| ALDS | 10.9% | 35.3% | .000 | .059 | .000 | -88 |
Going 0-for-16 with six strikeouts is, to use a technical term, real bad. What was going on? Let’s start with Altuve’s plate discipline:
| Season | O-Swing% | Z-Swing% | Swing% | O-Contact% | Z-Contact% | Contact% | Zone% |
|---|---|---|---|---|---|---|---|
| Regular Season | 31.4% | 65.0% | 43.8% | 76.8% | 91.0% | 84.6% | 44.2% |
| ALDS | 56.2% | 84.0% | 68.4% | 66.7% | 81.0% | 74.4% | 43.9% |
Oh no. Altuve swung at absolutely everything. Altuve has elite contact skills, so even though his contact percentage dropped by 10 points across the board, his numbers were still reasonable. As it turns out, that wasn’t a good thing:
| Season | LD% | GB% | FB% | IFFB% | EV | LA | wOBA | xwOBA |
|---|---|---|---|---|---|---|---|---|
| Regular Season | 20.4% | 41.0% | 38.7% | 12.0% | 85.9 | 16.1 | .397 | .354 |
| ALDS | 0.0% | 30.0% | 70.0% | 50.0% | 79.4 | 40.8 | .041 | .099 |
Looks like I used my “Oh no” too soon. Altuve didn’t hit a single line drive against the Mariners. He only hit two balls out of the infield and his exit velocity cratered. Half of his balls in play were popups. He also fouled off a third of the pitches he saw, nearly double his season average.
Before we panic too much, let’s remember that we’re talking about three games (though one of them went 18 innings, so you could argue it’s more like four). Altuve had just 17 plate appearances and 10 balls in play. It might also be helpful to check whether Altuve has struggled like this before. To the three-game rolling averages!
Twice this year, Altuve has had three-game stretches of the hyper-aggression he displayed in the ALDS. In fact, between July 26-28, he saw 10 strikes and swung at all of them. Not coincidentally, his wRC+ over that period was -46:

I won’t make you look at another graph, but Altuve has also had a couple three-game popup-paloozas this season. It seems safe to say that while the last three games were very bad, they were not necessarily unprecedented. He’s still Jose Altuve, and the Astros are not about to sit him during the ALCS.
Something else happened during the series against Seattle. The Mariners were targeting a specific spot against Altuve. On the left is how the league pitched him this year, in the middle is how the Mariners pitched him during the regular season, and on the right is how the Mariners pitched him in the ALDS. (Since Altuve only faced righties in the ALDS, these charts exclude lefties.):

During the regular season, 44.2% of the pitches Altuve saw were in the strike zone, third-lowest in the league. That’s not because he has a high chase rate (at 28.7%, he’s middle of the pack), but because pitchers are scared of his .969 OPS in the zone. Aside from that, there’s nothing unusual about the way teams pitched him this year. They threw hard stuff in and soft stuff away. When they were looking for chases, they threw four-seamers up, changeups down, and breaking balls low and away. When they came into the zone, they attacked him middle away. During the regular season, the Mariners largely followed that script as well. However, they clearly believed they could beat Altuve inside. In the ALDS, they went all in on that strategy, hammering Altuve inside and off the plate and largely ignoring the area where the rest of the league (and they themselves) had concentrated their stuff during the regular season.
This morning, R.J. Anderson posited that the Mariners, “wanted to test Altuve’s ability to get his barrel around to hard stuff in and around his hands — and he didn’t pass.” Anderson’s article is definitely worth reading, but Altuve had a wOBA of .405 on pitches 97 mph and higher this year, so I’m a bit skeptical that he’s getting beat with velocity all of a sudden. Here are the pitches Altuve saw, broken down by result. Take a look at the pink dots that indicate swings and misses:
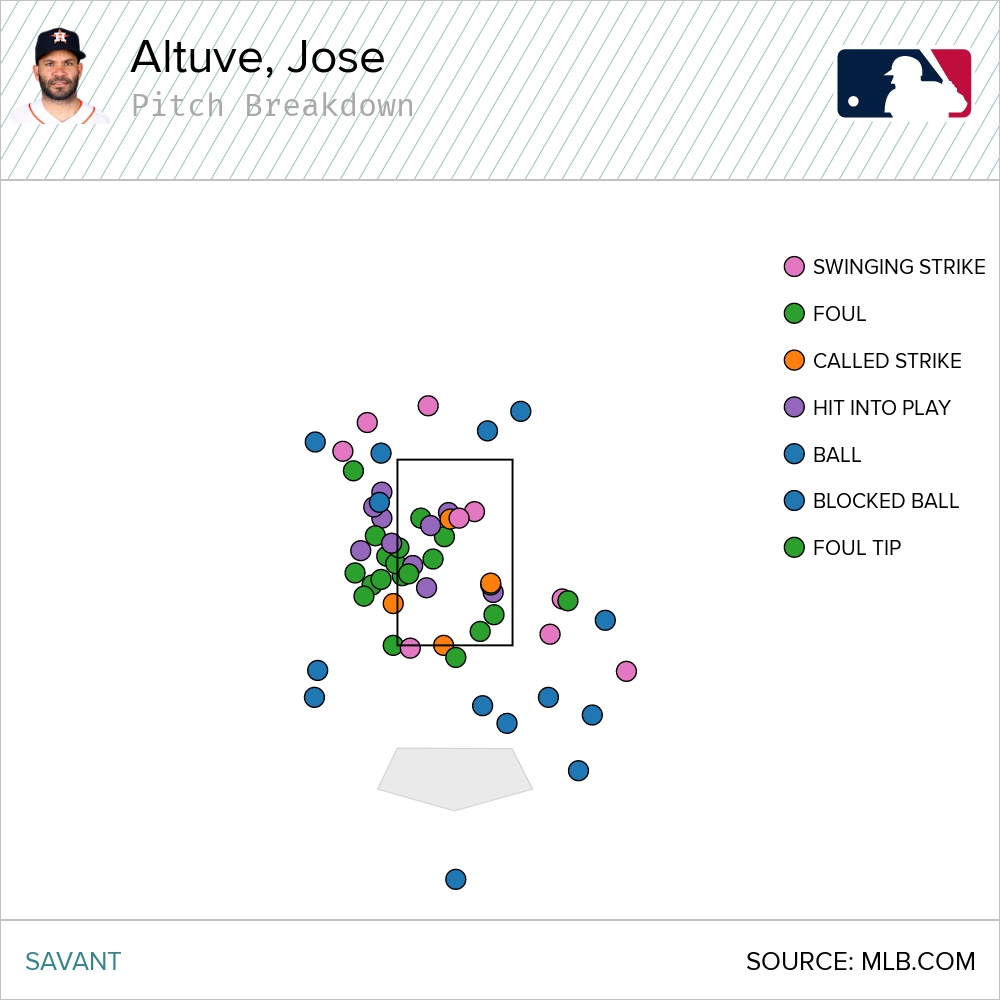
Altuve did swing and miss at three four-seam fastballs up and in, but they were all chase pitches when he was behind in the count, standard against any batter. The only whiff that’s actually on the inside edge is a changeup at the bottom of the zone from Luis Castillo. Most of the dots on the inside edge are green, meaning Altuve fouled them off. He often yanked his fouls the third base side like this one:
The purple dots on the inside edge are balls in play. Altuve was definitely behind on some of them, popping up badly, but he also pulled some for grounders and a fly out. Maybe he was ahead of so many pitches because he was cheating on fastballs, but it seemed to me less like Altuve couldn’t catch up with the inside fastball and more like his timing was just plain off.
The other factor to consider here is that the Mariners changed their pitch mix against Altuve. The regular season is on the left, and the ALDS is on the right:

During the regular season, they threw most of their sinkers in the middle or middle-in. The pitches on the inside edge were largely four-seamers. In the ALDS, however, they switched to sinkers as they pounded Altuve inside. Some of the change comes from the addition of sinkerballer Castillo, but George Kirby definitely went out of his way to throw sinkers to Altuve. During Game 3, he threw his four-seamer and his sinker 43 times each, but against Altuve he threw eight sinkers and just two four-seamers. Breaking down Altuve’s performance against specific pitch types offers some explanation:
| Pitch | Number | Percentage | wOBA | xwOBA | Exit Velocity | ISO |
|---|---|---|---|---|---|---|
| Knuckle Curve | 50 | 2.2 | .717 | .348 | 85.4 | .333 |
| Four-Seam | 682 | 29.5 | .470 | .427 | 89.3 | .368 |
| Sinker | 329 | 14.3 | .451 | .389 | 81.9 | .298 |
| Changeup | 276 | 12 | .386 | .359 | 85.8 | .232 |
| Slider | 586 | 25.4 | .315 | .276 | 83.3 | .115 |
| Curveball | 163 | 7.1 | .294 | .276 | 79.9 | .105 |
| Cutter | 189 | 8.2 | .283 | .305 | 81.7 | .079 |
| Split-Finger | 33 | 1.4 | .196 | .188 | 76.9 | .000 |
| Total | 2,308 | 100 | .397 | .354 | 84.8 | .233 |
It’s certainly not a bad idea to throw fewer four-seamers to Jose Altuve, as he absolutely destroys them. It’s possible that he’s been lucky on sinkers, given the larger difference between his wOBA and xwOBA. Regardless, his exit velocity is considerably lower versus the pitch. If your goal is to keep Altuve in the ballpark, it would make sense to swap four-seamers for sinkers.
It’s worth noting that going after Altuve on the inside edge is not exactly a new approach. I went through the heat maps of the sinkers that he saw each season. Most looked like this year’s, which is to say a big blob of red in the middle of the zone, with maybe a tendril of pink sneaking toward the inside edge. Take a look at the heat map for 2020:

Teams were definitely targeting the inner half with their sinkers, just like the Mariners did in the ALDS. We should take this with a grain of salt, as the season was only 60 games long, but Altuve put up a 74 wRC+ in 2020, the worst of his career. It’s hard to know whether there’s causality here. It strikes me as unlikely that the league figured out how to pitch Altuve in 2020 and then collectively forgot about it.
I went looking for pitches in that spot, up and on the inside edge. If you’re searching on Baseball Savant, it’s Attack Zone 11, which is somehow not the title of a Steven Seagal movie:

It’s not a bad idea to pitch Altuve there. He’s had a .310 wOBA against pitches there since 2015, better than the league wOBA of .283 in that spot, but still way down from his .372 wOBA against all pitches. Here are Altuve’s numbers in that zone, broken down by year:
| Year | Pitches | wOBA | xwOBA |
|---|---|---|---|
| 2022 | 60 | .177 | .153 |
| 2021 | 55 | .386 | .307 |
| 2020 | 24 | .100 | .189 |
| 2019 | 39 | .285 | .264 |
| 2018 | 52 | .155 | .154 |
| 2017 | 46 | .350 | .360 |
| 2016 | 47 | .634 | .528 |
| 2015 | 45 | .407 | .282 |
Keep in mind that these are small samples, especially since this spot is off the plate. Altuve has only swung at 201 of these pitches since 2015, and he’s only put 98 of them in play. That said, he did fare worse against them this year, just as he did in 2020.
It could be that the Mariners decided to try the strategy that seemed to work against Altuve when he was at his worst. Maybe they just decided not get beat throwing four-seamers to a guy who crushes them. I think it’s more likely that they realized early on that he’d lost his plate discipline and decided not to throw anything in the zone. In Game 1, Logan Gilbert didn’t try to come inside until Altuve’s third plate appearance. The one inside pitch he threw in Altuve’s first two plate appearances was a miss on a pitch where catcher Cal Raleigh was set up outside.
It’s not a good idea to overreact to three games. The good news for the Astros is that, as we just saw, they’re good enough to win even if Altuve doesn’t produce at all. I’m sure they noticed how the Mariners were pitching them and I’m sure Altuve is working on getting his timing back. If were the Yankees, I would absolutely follow the blueprint that the Mariners laid out, but I wouldn’t be shocked if it no longer works.
Davy Andrews is a Brooklyn-based musician and a writer at FanGraphs. He can be found on Bluesky @davyandrewsdavy.bsky.social.
That first graph was my heart rate throughout that ALDS
The BB% and K% in your first table are swapped for the regular season and ALDS.
Thanks, updated!