
Catchers Are Finally Joining in on the Fun at the Plate
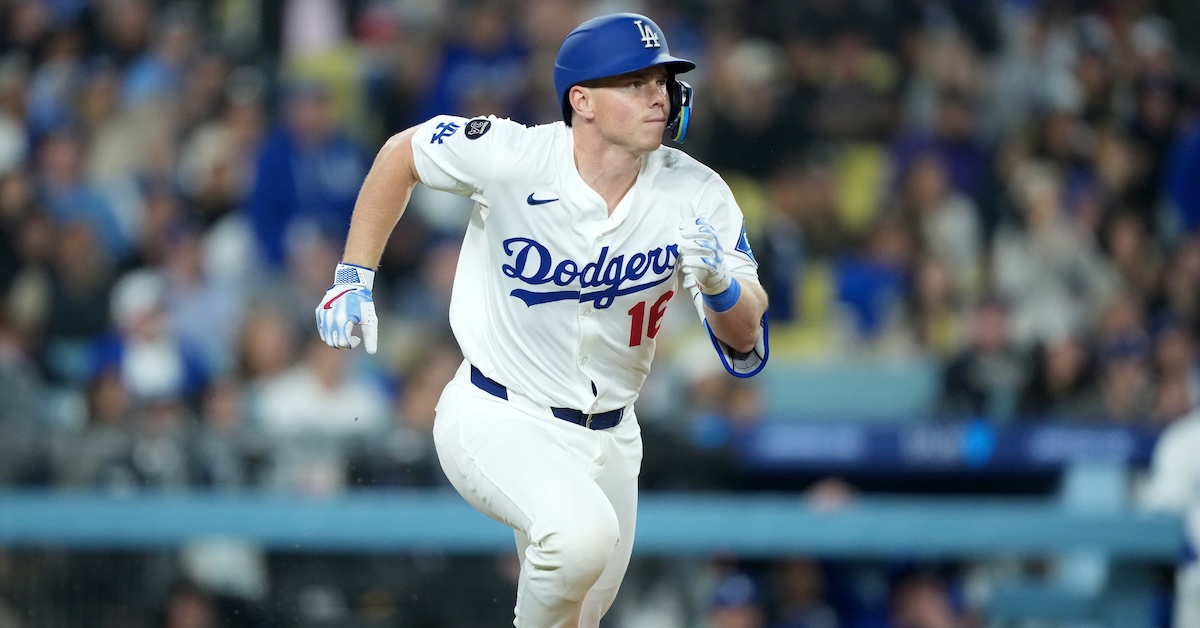
I sometimes worry about overusing the words “for a catcher” in my writing. I don’t like overusing words. Case in point, I hate that I have already overused the word “overusing” (and the word “words”) in the first two sentences of this piece. Yet the “for a catcher” qualifier is often necessary. Catchers aren’t as fast as other position players. He runs well… for a catcher. They aren’t as agile as other position players. He’s athletic… for a catcher. They need more time off than other position players. He plays a lot… for a catcher. Above all else, they tend not to hit as well as other position players. Say it with me now: He hits well… for a catcher.
Catcher is the most demanding defensive position, and as a result, offensive standards for backstops are lower. The average wRC+ at catcher is typically about 10% worse than the big league average. That means that a team whose catchers produce a 100 wRC+ will usually rank among the majors’ top third, even though you wouldn’t want to see those catchers batting higher than the bottom third of the order. This is so often the case that most of us take it for granted. For instance, if I were chatting in a sports bar instead of writing for FanGraphs, I might say that Austin Wells (101 wRC+), Bo Naylor (99 wRC+), or J.T. Realmuto (102 wRC+) has hit “pretty well for a catcher” this year, without even bothering to check how well the average catcher has actually performed. Unfortunately for those guys, I’m far more comfortable sitting behind a computer than sitting in a bar, so I did look into how well catchers have hit in 2025. What I discovered is that, at least for now, I’m at no risk of overusing the phrase “for a catcher” after all. Just past the quarter mark of the 2025 season, catchers have a 101 wRC+.
With a .246/.318/.396 slash line, catchers are slightly outperforming the league average in all three triple slash categories. If they can keep this up, the 2025 season will be the first since at least 2002 (as far back as our positional splits go) in which catchers outperformed the league average in any one of the triple slash statistics, let alone all three.
The Statcast numbers aren’t quite as impressive; catchers fall slightly below the league average in xBA, xOBP, and xSLG. Still, they are closer to league average in each of those three metrics than they have been in any other season of the Statcast era:
| Players | BA | OBP | SLG | xBA | xOBP | xSLG |
|---|---|---|---|---|---|---|
| Catchers | .246 | .318 | .396 | .250 | .321 | .418 |
| League Average | .243 | .316 | .394 | .252 | .324 | .423 |
Don’t read into the fact that catchers are underperforming their expected slash stats. The Statcast numbers don’t align with real results right now; the league average wOBA is .314, while the league average xwOBA is .327. Regardless, the “x” stats support the idea that catchers have been much closer to being league-average hitters than usual. Here’s how they compare to other positions in xwOBA. What stands out is the fact that catchers don’t stand out:
| Position | xwOBA |
|---|---|
| Right Field | .344 |
| Designated Hitter | .342 |
| First Base | .336 |
| Left Field | .326 |
| Catcher | .323 |
| Second Base | .322 |
| Shortstop | .320 |
| Third Base | .319 |
| Center Field | .317 |
| League Average | .327 |
I know it might seem a little silly that I’m all excited about a .246/.318/.396 slash line and an xwOBA four ticks below league average. As I made those first two tables, I felt a bit like a parent putting their child’s B- spelling test up on the fridge. But for a kid who normally brings home Cs and Ds, a B- is something to celebrate! Take a look at how this year’s catchers stack up to those of years past. I’d say that spike on the far right is worthy of the fridge:
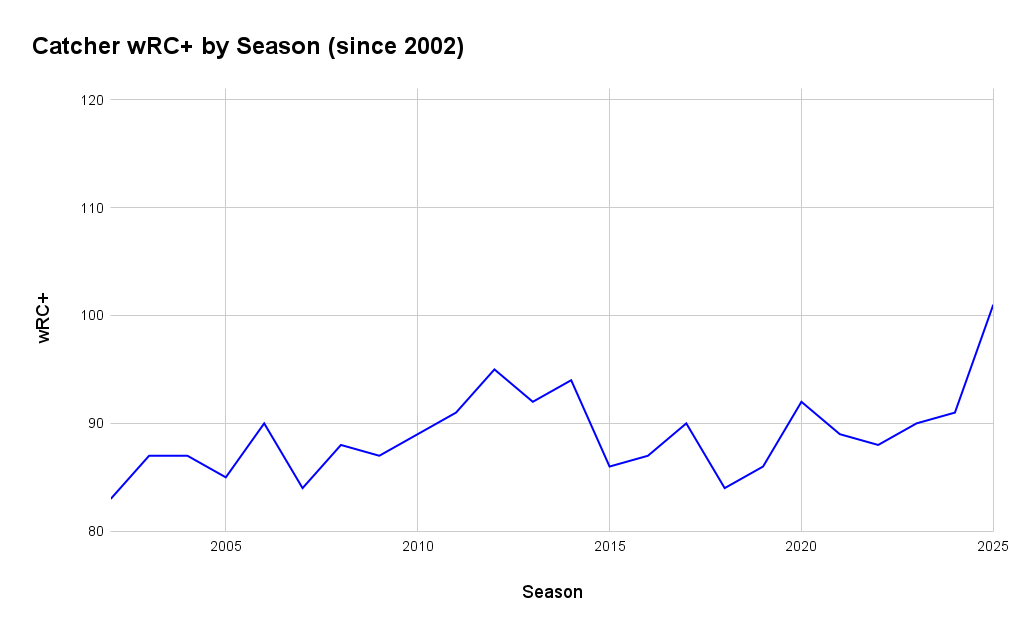
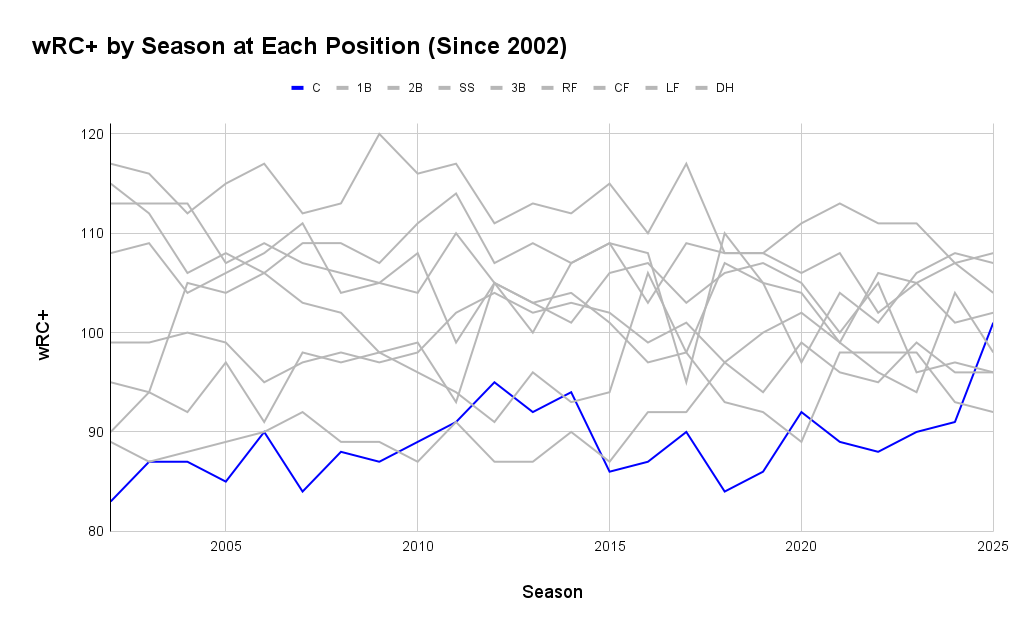
As you can see, catchers enjoyed a brief period of (relative) offensive success in the first half of the 2010s, led by Buster Posey and Joe Mauer. Since 2015, however, catchers have finished last among the nine positions in wRC+ in every season except the shortened 2020 campaign. Here’s the same chart as above, but this time, I’ve added in the other positions. For the better part of two-plus decades, that blue line lived at the bottom. This year, it has jumped up to the middle of the pack:
Thanks to this offensive outburst, catchers lead all positions in WAR. This table is definitely fridge-worthy:
| Position | WAR |
|---|---|
| Catcher | 30.3 |
| Shortstop | 26.2 |
| Center Field | 21.0 |
| Right Field | 18.6 |
| Third Base | 18.4 |
| Second Base | 16.5 |
| Left Field | 13.5 |
| First Base | 11.0 |
| Designated Hitter | 7.5 |
Catchers are born on third base when it comes to WAR, since they receive the biggest boost from our positional adjustments. Even so, they have never finished a season (at least not since 2002) with more WAR than all eight other positions. The highest they’ve ever ranked was a distant second place behind center fielders in 2014. Their average ranking over the past 23 seasons is sixth.
Earlier this year, MLB.com asked a bunch of front office decision-makers which position they’d prioritize if they were building a team from scratch. Catcher was the most frequent response. Indeed, it’s not uncommon to hear the argument that catcher is the most valuable position in baseball. However, that argument is usually founded on game calling and the ability to handle a pitching staff, skills we don’t have a good way to measure. Thus, I’ve always been open to the idea that catchers might offer more to their teams than players at any other position, but it’s hard to know for sure. We just don’t have the empirical evidence. So far in 2025, however, that hasn’t mattered. Catchers have been the most valuable position players on the field, no assumptions necessary.
At this juncture, I feel inclined to state the obvious: The 2025 season is less than two months old, and catchers have roughly another 13,000 plate appearances to take before the year is up. That gives them plenty of time and opportunity to come crashing down to earth. But even if this all turns out to be a small sample size fluke, it’s a fluke like we’ve maybe never seen before.
Using our splits leaderboard, I found catchers’ wRC+ from every consecutive two-month period (i.e., March/April-May, May-June, June-July, July-August, and August-September) in every season since 2002. With the caveat that we’re only part of the way through May right now, March/April-May 2025 ranks at the very top. Out of more than 100 two-month periods from the last 24 seasons, this is only the second time catchers have had a wRC+ above 100:
| Year | Months | wRC+ |
|---|---|---|
| 2025 | March/April-May | 101 |
| 2024 | July-August | 100 |
| 2014 | March/April-May | 99 |
| 2010 | March/April-May | 99 |
| 2013 | July-August | 97 |
| 2023 | July-August | 97 |
| 2013 | June/July | 96 |
| 2012 | June-July | 96 |
| 2016 | July-August | 96 |
| 2012 | July-August | 96 |
In an effort to identify the catchers most responsible for the position’s success this year, I calculated how much the overall catcher wRC+ would drop if you removed each individual player from the equation. These are the 10 catchers who have made the most positive offensive impact for the position this year. Keep in mind, the stats listed below are each player’s stats as a catcher, so they might look a little different than the numbers you’ve seen elsewhere:
| Catcher | PA | wRC+ | wRC+ Impact Score |
|---|---|---|---|
| Cal Raleigh | 149 | 215 | 3.16 |
| Carson Kelly | 104 | 194 | 1.78 |
| Will Smith | 142 | 168 | 1.75 |
| Drake Baldwin | 80 | 176 | 1.10 |
| Iván Herrera | 28 | 306 | 1.04 |
| Sean Murphy | 107 | 142 | 0.81 |
| Hunter Goodman | 96 | 139 | 0.66 |
| Tyler Heineman | 46 | 177 | 0.64 |
| Austin Wynns | 38 | 192 | 0.63 |
| Jose Trevino | 100 | 132 | 0.57 |
To no one’s surprise, the leading player here is Cal Raleigh. The Mariners star has been phenomenal this season. If it weren’t for some guy named Aaron Judge, Raleigh would be building a strong case to be the first catcher to win an MVP since Posey in 2012. His 170 wRC+ would be the highest for a qualified primary catcher since Mauer in 2009. What’s more, Raleigh has saved his best work for his days behind the dish. In 149 plate appearances as a catcher, he has a 215 wRC+. In 45 PA at DH, his wRC+ is 14. Without Raleigh, overall catcher wRC+ would drop by more than three points. It would still be the position’s highest wRC+ in a season since at least 2002, but I’m not sure I’d be writing this piece if catchers’ collective wRC+ were 98 instead of 101.
After Raleigh, the rest of the top 10 is a fun collection of names. Will Smith and Sean Murphy are All-Stars enjoying bounce-back seasons. Drake Baldwin, Iván Herrera, and Hunter Goodman are promising bat-first catchers off to great starts. Carson Kelly, Tyler Heineman, Austin Wynns, and Jose Trevino are veterans playing over their heads in part-time roles.
The lowest wRC+ in the table above is Trevino’s 132. To find a qualified primary catcher who finished a season with a wRC+ that high, you have to go all the way back to Posey in 2015. In other words, you could argue (and I would agree) that none of those 10 performances in the table above are sustainable. But that’s not exactly a shock. Those are the top 10 names from a list where no one has more than 166 plate appearances. You’ll find just as many unsustainable performances if you look at the names at the bottom:
| Catcher | PA | wRC+ | wRC+ Impact Score |
|---|---|---|---|
| Patrick Bailey | 127 | 34 | -1.59 |
| Jacob Stallings | 76 | 15 | -1.20 |
| Ben Rortvedt | 58 | -5 | -1.13 |
| Salvador Perez | 92 | 57 | -0.75 |
| Connor Wong | 48 | 18 | -0.73 |
| Freddy Fermin | 88 | 59 | -0.69 |
| Henry Davis | 45 | 28 | -0.61 |
| Martín Maldonado | 66 | 52 | -0.60 |
| Pedro Pagés | 116 | 74 | -0.60 |
| Tyler Stephenson | 36 | 18 | -0.55 |
Patrick Bailey is the worst offender. It’s not that he has the very worst numbers, but no one else who has been similarly unproductive has received so much playing time. Bailey is such a phenomenal defensive player that he could probably hold onto a starting role even with a 37 wRC+. Thanks to his glove, he’s still on pace for 1.9 WAR; only 18 primary catchers compiled more WAR last season. That being said, Bailey produced a 113 wRC+ over three minor league seasons before his debut and a 79 wRC+ in his first 801 major league plate appearances. His rest-of-season Depth Charts projected wRC+ is 81. Simply put, it’s difficult to imagine he could possibly continue to hit this poorly.
You could say something similar about Jacob Stallings and Ben Rortvedt. I’m not sure either is quite as talented a hitter as Bailey, but major league batters simply don’t hit as poorly as those two have over more than a handful of games. Either they’ll benefit from some positive regression, or they’ll lose their jobs. Stallings has already lost playing time in Colorado to Goodman and could eventually lose his roster spot to prospect Drew Romo. Rortvedt might have a longer leash; he’s eight years younger than Stallings, he was fairly good just last season, and he’s much less of a known quantity. The fact that Danny Jansen also hasn’t played particularly well has helped Rortvedt to continue receiving playing time from the Rays. Still, they could eventually replace him with prospect Dominic Keegan if his slash line doesn’t improve from its current .096/.190/.115.
Perhaps the most interesting name among the bottom 10 is Salvador Perez, who has gotten off to a dreadful start in 2025. However, no qualified batter has a larger difference between his wOBA and xwOBA. Despite a .261 wOBA, Perez has been hitting the ball just as hard as he did in his Silver Slugger-winning 2024 season. Indeed, he recorded the hardest-hit batted ball of his career on an RBI single last Friday. His .362 xwOBA ranks third among qualified catchers, behind only Smith and Raleigh. This is another guy who can’t possibly continue to be this bad for much longer.
Beyond the names listed above, William Contreras, Adley Rutschman, Yainer Diaz, and Ryan Jeffers could also help their position survive some inevitable regression from the likes of Kelly, Heineman, and Wynns. From 2023-24, Contreras, Rutschman, Diaz, and Jeffers were four of the top hitting catchers in the league. So far in 2025, Jeffers is the only one with a wRC+ above 100, and he’s done almost all of his damage in a handful of games as a designated hitter. He has a 119 wRC+ this year, but an 85 wRC+ in 105 PA at catcher compared to a 211 wRC+ in 36 PA at DH. There’s a good chance that will even out eventually. In fact, prior to this year, Jeffers had similarly extreme splits in the opposite direction: From 2020-24, he produced a 106 wRC+ as a catcher and a 60 wRC+ as a DH.
Rutschman has continued to struggle like he did in last year’s second half, but unlike last year, he has an xwOBA in the 78th percentile that says he’s likely to improve. Diaz has been even worse than Rutschman, but he too has “x” stats that suggest he can bounce back. Contreras hasn’t hit quite as poorly as Rutschman or Diaz, but nor does he have a significant gap between his wOBA and xwOBA. However, he has been playing through a fractured finger on his left hand, and he has suggested the pain is at its worst when he’s hitting. It’s hard to know how long an injury like this will take to heal (the Brewers think he’s been dealing with it since last season), but with time, he can hopefully start to look more like the hitter who had a 130 wRC+ from 2022-24.
Ultimately, the basic concept of regression to the mean suggests catcher offense is probably going to drop off as the season goes on. So does the even more basic concept of wear and tear; the major league season is long, and catching takes a toll on the body. Another indication that this is all too good to be true is old, reliable BABIP. Catchers are currently running a .291 BABIP, which is right in line with the .290 league average. Except, catchers never have a league-average BABIP. They came close with a .300 mark in 2006 (league average was .301), but catcher BABIP is usually about 10 ticks lower than league BABIP.
On the other hand, BABIP doesn’t explain all the success catchers are having this year. They’re also walking a bit more and hitting for slightly more power than they have in years past. Furthermore, BABIP isn’t all about luck; higher-quality contact will lead to a higher BABIP, and catchers have higher hard-hit and barrel rates right now than in any other season of the Statcast era. In short, regression is likely, but it’s not inevitable – especially if major players like Perez, Rutschman, and Contreras start carrying their weight.
Catchers have had to deal with a lot this season. The challenge system appeared in spring training, perhaps presaging the eventual implementation of a full automated ball-strike system. Umpires are calling a noticeably smaller strike zone, forcing catchers to adjust on the fly. Stolen base attempts are up for the third year in a row. The most demanding defensive job remains as demanding as ever. With all that going on, I wouldn’t blame catchers if their offense was at its worst. Instead, they’re hitting better than I’ve ever seen and doing everything they can to make that “for a catcher” qualifier redundant. In 2025, a good hitter for a catcher is just a good hitter, period.
Leo is a writer for FanGraphs and MLB Trade Rumors as well as an editor for Just Baseball. His work has also been featured at Baseball Prospectus, Pitcher List, and SB Nation. You can follow him on Bluesky @leomorgenstern.com.
A few years back, it seemed like every fangraphs article could be in someway tied to how great Mike Trout was. I guess the page has turned, because when I saw this:
My immediate thought was: “That’s league average?!? Christ, Aaron Judge is good.”
Also reminder: don’t look up Mike Trout’s stat line for 2025.
* just look up his expected stats and pretend*