Checking in on Some Second-Half Home Run Droughts
By the time the first half of the season ended, Pete Crow-Armstrong appeared to be a lock to join the 30-home run, 30-stolen base club. Elected to start the All-Star Game in center field for the NL in his first full major league season, the 23-year-old phenom had already totaled 25 homers and 27 steals. Things have not come easily since then, however; with one week to go in the regular season, Crow-Armstrong is stuck on 29 home runs, though he does have 35 stolen bases.
It was a fruitful weekend for joining the 30/30 club, with Jazz Chisholm Jr. doing so on Friday, José Ramírez on Saturday, and Corbin Carroll on Sunday; the three of them joined — improbably enough — Juan Soto. This is the fifth season in which four players have attained the dual milestones, and the second in three years, aided by the rules changes that have accompanied the introduction of the pitch clock. Any one of Crow-Armstrong, Julio Rodríguez (who has 31 home runs and 28 stolen bases), Francisco Lindor (28 HR, 31 SB), or Randy Arozarena (27 HR, 28 SB) reaching their needed thresholds would set a major league record.
Although Crow-Armstrong didn’t start against the Reds on Sunday, he came off the bench and had two chances to join the party. He flied out in one and, with the tying run at second base and two outs in the ninth, struck out looking at a borderline four-seamer to end the game.
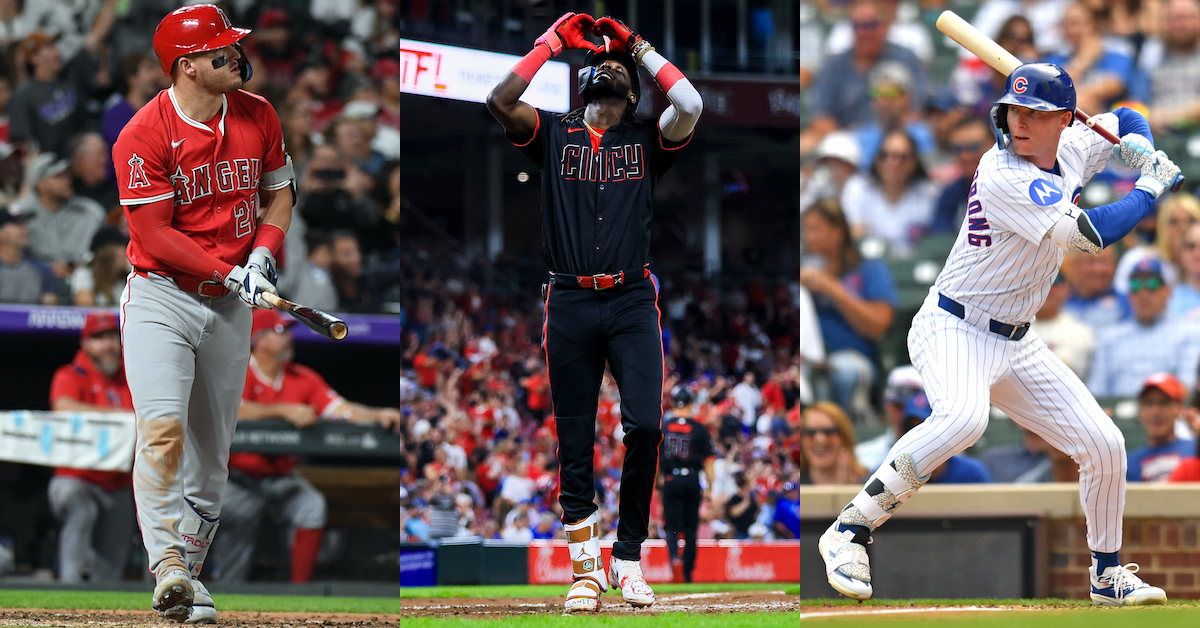
Crow-Armstrong, whose odds of joining the club 30/30 club were the majors’ second highest (85%) when I checked in on September 9, doesn’t have the largest drop-off in home run total or home run rate from the first half to the second, nor does he have anywhere near the longest home run drought in the majors. Rays outfielder Chandler Simpson has yet to homer in 422 plate appearances, for example, and Braves shortstop Nick Allen hasn’t done so in 408 PA. But particularly during a weekend in which Elly De La Cruz went yard for the first time since July 31 and Mike Trout for just the second time since August 6 (the 400th of his career, a monster 485-footer with a nice story attached), I got to thinking a bit about home run droughts, wanting to see where these guys fit in the grand scheme of this season.
In order to do that, I had to set some ground rules. To be considered for the following lists, a player had to make at least 150 plate appearances both before and after the All-Star break. Since it’s not the Simpsons or Allens I’m after — Davy Andrews has been working that side of the street — I decided to consider only players who hit at least 10 homers during the first half, except for this first list. Here’s a look at the longest streaks of homerless games among players with at least 10 total dingers this season:
| Player | Team | PA | HR | Longest HR Drought (G) |
|---|---|---|---|---|
| Gabriel Arias | CLE | 445 | 11 | 48 |
| Elly De La Cruz | CIN | 670 | 20 | 43 |
| Michael Harris II | ATL | 614 | 17 | 42 |
| Mike Yastrzemski | KCR/SFG | 527 | 15 | 42 |
| J.T. Realmuto | PHI | 530 | 12 | 42 |
| Michael Conforto | LAD | 462 | 12 | 41 |
| Freddie Freeman | LAD | 604 | 21 | 40 |
| Otto Lopez | MIA | 566 | 15 | 37 |
| Caleb Durbin | MIL | 481 | 11 | 37 |
| Ozzie Albies | ATL | 660 | 16 | 36 |
| Alejandro Kirk | TOR | 486 | 12 | 36 |
| Steven Kwan | CLE | 664 | 10 | 36 |
| Seiya Suzuki | CHC | 623 | 27 | 34 |
| Heliot Ramos | SFG | 663 | 18 | 34 |
| Brice Turang | MIL | 632 | 18 | 34 |
| William Contreras | MIL | 647 | 17 | 34 |
| Ceddanne Rafaela | BOS | 560 | 16 | 34 |
| Sean Murphy | ATL | 337 | 16 | 34 |
| Jackson Merrill | SDP | 456 | 15 | 34 |
| J.P. Crawford | SEA | 634 | 11 | 34 |
That’s an interesting mix, with some legitimate stars (De La Cruz, Freeman, Merrill, Realmuto), some players with injuries (Murphy), some guys who went through dreadful slumps (Harris) or are still doing so (Conforto), and some whose offensive games just aren’t complete. Arias, for example, as a prospect had 60-grade raw power but just a 30-grade hit tool; he has 11 homers — a career high — but just a 78 wRC+. His teammate Kwan is one of the best contact hitters in the game. As a prospect his grades were the inverse of Arias’, with a 70-grade hit tool and 30-grade raw power; though Kwan has reached the 10-homer plateau, he’s in the midst of a down season, with just a 102 wRC+.
The concentrations of Braves and Brewers stand out, and so does this contrast: All three Brewers in the table above still have a wRC+ of 110 or greater despite those lengthy power outages, and that team was the first to clinch a playoff berth, while all three Braves here have a wRC+ of 96 or lower, and that team can’t wait to be put out of its misery. Murphy already underwent season-ending surgery to repair the torn labrum in his right hip.
While Arias isn’t much of a home run hitter, De La Cruz homered 25 times last season, and at one point looked bound for a 30/30 campaign in this one. He stole 25 bases and homered 18 times by the All-Star break, earning a spot on the NL All-Star team for the second straight season. He has added just two homers in the second half, one on July 31 off the Braves’ Carlos Carrasco, the other on Saturday off the Cubs’ Porter Hodge. De La Cruz has made less contact in the second half, chasing the ball outside the strike zone more often and making lower-quality contact:
| Split | PA | HR | AVG | OBP | SLG | wRC+ | K% | EV | Brl% | HH% | xSLG |
|---|---|---|---|---|---|---|---|---|---|---|---|
| First Half | 415 | 18 | .284 | .359 | .495 | 128 | 24.3% | 91.5 | 13.0% | 46.7% | .495 |
| Second Half | 255 | 2 | .228 | .298 | .345 | 73 | 28.6% | 89.5 | 5.7% | 38.4% | .345 |
I couldn’t shoehorn it into the table, but while De La Cruz has hit the ball in the air more often in the second half, it’s been unproductive; his pulled air rate has dropped from an already-low 9.8% to 8.2%, with his popup rate increasing from 4.9% to 5.7%.
Crow-Armstrong is nowhere to be found on that list above, as his longest homerless streak this season is a mere 25 games, from July 25 through August 21. His home run differential of 21 — 25 homers in the first half, four in the second — is tied with the Nationals’ James Wood and the Yankees’ Aaron Judge for the second-largest gap in the majors, behind Suzuki (from 25 to two, a differential of 23). But with Judge (35 homers in the first half, 14 in the second) and Cal Raleigh (38 homers in the first half, 20 in the second) also in the top five, you can see that it doesn’t make much sense to measure things that way. More sensible, for my purposes, is to go by drop-off in home run percentage (home runs divided by plate appearances).
| Player | Team | PA1 | HR1 | HR%1 | PA2 | HR2 | HR%2 | Dif | Longest Drought |
|---|---|---|---|---|---|---|---|---|---|
| Seiya Suzuki | CHC | 407 | 25 | 6.1% | 220 | 2 | 0.9% | -5.2% | 35 |
| James Wood | WSN | 420 | 24 | 5.7% | 248 | 3 | 1.2% | -4.5% | 21 |
| Pete Crow-Armstrong | CHC | 401 | 25 | 6.2% | 223 | 4 | 1.8% | -4.4% | 25 |
| Mike Trout | LAA | 299 | 17 | 5.7% | 240 | 5 | 2.1% | -3.6% | 28 |
| Elly De La Cruz | CIN | 415 | 18 | 4.3% | 258 | 2 | 0.8% | -3.6% | 43 |
| Ketel Marte | ARI | 297 | 19 | 6.4% | 238 | 7 | 2.9% | -3.5% | 16 |
| Kody Clemens | PHI/MIN | 170 | 12 | 7.1% | 192 | 7 | 3.6% | -3.4% | 15 |
| Ceddanne Rafaela | BOS | 341 | 14 | 4.1% | 223 | 2 | 0.9% | -3.2% | 34 |
| Ronald Acuña Jr. | ATL | 193 | 12 | 6.2% | 191 | 6 | 3.1% | -3.1% | 17 |
| Oneil Cruz | PIT | 360 | 16 | 4.4% | 172 | 3 | 1.7% | -2.7% | 18 |
| Lars Nootbaar | STL | 386 | 12 | 3.1% | 175 | 1 | 0.6% | -2.5% | 33 |
| Corbin Carroll | ARI | 361 | 21 | 5.8% | 263 | 10 | 3.8% | -2.0% | 16 |
| Brandon Nimmo | NYM | 383 | 18 | 4.7% | 243 | 6 | 2.5% | -2.2% | 15 |
| Carson Kelly | CHC | 234 | 12 | 5.1% | 170 | 5 | 2.9% | -2.2% | 27 |
| Wyatt Langford | TEX | 332 | 15 | 4.5% | 239 | 7 | 2.9% | -1.6% | 24 |
Now that’s what I’m talking about. As the table suggests, Suzuki — who last homered on August 6 — has crashed even harder than Crow-Armstrong in the home run department, though being the more disciplined hitter of the two, Suzuki’s wRC+ hasn’t declined by as much:
| Suzuki | PA | HR | AVG | OBP | SLG | wRC+ | K% | EV | Brl% | HH% | xSLG |
|---|---|---|---|---|---|---|---|---|---|---|---|
| First Half | 407 | 25 | .263 | .319 | .547 | 136 | 26.8% | 92.5 | 18.5% | 50.9% | .537 |
| Second Half | 220 | 2 | .200 | .332 | .267 | 80 | 22.7% | 89.4 | 12.8% | 44.4% | .458 |
| Crow-Armstrong | PA | HR | AVG | OBP | SLG | wRC+ | K% | EV | Brl% | HH% | xSLG |
| First Half | 401 | 25 | .265 | .302 | .544 | 131 | 22.9% | 89.4 | 14.2% | 42.0% | .532 |
| Second Half | 223 | 4 | .207 | .257 | .348 | 65 | 26.0% | 89.4 | 9.4% | 38.9% | .402 |
Still, that’s not great news for the Cubs, who have clinched a Wild Card berth but need both outfielders to heat up if they’re going to play deep into October. Suzuki started off the season on a scorcher, hitting .273/.335/.569 (146 wRC+) with 14 homers through the end of May, but then was just slightly above average at the plate in each of the next three months, hitting a combined .227/.317/.400 (104 wRC+) with 13 homers. He’s been nearly unplayable this month, however, hitting .191/.316/.213 (62 WRC+).
Earlier this month, hitting coach Dustin Kelly said of Suzuki, “Seiya, at times, can go back and forth, getting in between on pitches… It’s kind of where sometimes he falls. The default for him is just getting back on time with the fastball. Look to do damage and drive the ball in the air to the pull-side gap.” To his point, in March/April, May, and July, Suzuki slugged .615 or higher against four-seamers, but in the other months, he’s been at .385 or lower — albeit with huge gaps between his actual and expected slugging percentage across small samples. Overall, he’s got a 138-point gap between his actual and expected slugging percentage against four-seamers (.482 vs. .620) and an 162-point gap against sinkers (.514 vs. .676). While the actual slugging percentages are still strong, they’re only doing so much to prop up his production given his struggles against breaking pitches (.322 SLG, .334 xSLG).
As for Crow-Armstrong, his quality of contact is down as well, magnified by an elevated strikeout rate and a tendency to chase. His performance against four-seamers and sliders has completely collapsed in the second half:
| Pitch | Half | PA | BBE | HR | EV | Brl% | HH% | AVG | xBA | SLG | xSLG | wOBA | xwOBA | Whiff% |
|---|---|---|---|---|---|---|---|---|---|---|---|---|---|---|
| 4-Seam | 1st | 110 | 67 | 10 | 94.5 | 15.5% | 62.1% | .216 | .250 | .549 | .633 | .345 | .392 | 31.5% |
| 4-Seam | 2nd | 55 | 29 | 1 | 90.6 | 5.5% | 41.4% | .102 | .188 | .204 | .351 | .153 | .244 | 34.6% |
| Slider | 1st | 59 | 40 | 3 | 85.9 | 3.4% | 35.9% | .278 | .193 | .500 | .347 | .336 | .250 | 33.8% |
| Slider | 2nd | 32 | 19 | 0 | 89.0 | 6.3% | 26.3% | .154 | .199 | .231 | .315 | .222 | .266 | 33.3% |
While Crow-Armstrong has cut his chase rate against all pitches from 45% in the first half to 35.9% in the second, he’s gotten worse results when making contact outside the zone, with his actual slugging percentage falling dramatically, from .336 (on 73 BBE in 153 PA) to .113 (on 21 BBE in 69 PA). Maybe that’s a small-sample artifact, but being a bad-ball hitter is a tough way to make a living.
As for Trout and Wood, since we’ve come this far, here’s a look at their sobering drop-offs:
| Trout | PA | HR | AVG | OBP | SLG | wRC+ | K% | EV | Brl% | HH% | xSLG |
|---|---|---|---|---|---|---|---|---|---|---|---|
| First Half | 299 | 17 | .238 | .365 | .471 | 126 | 26.8% | 92.0 | 16.1% | 53.0% | .561 |
| Second Half | 240 | 5 | .218 | .347 | .345 | 97 | 38.8% | 87.8 | 12.1% | 39.3% | .353 |
| Wood | PA | HR | AVG | OBP | SLG | wRC+ | K% | EV | Brl% | HH% | xSLG |
| First Half | 420 | 24 | .278 | .381 | .534 | 149 | 27.6% | 93.6 | 18.5% | 55.6% | .564 |
| Second Half | 248 | 3 | .212 | .294 | .333 | 78 | 39.9% | 95.1 | 9.8% | 56.9% | .364 |
It’s great that Trout has appeared in 125 games this season, more than he played in 2023 and ’24 combined, but he’s absolutely fallen apart in the second half, with his quality of contact declining and his strikeout rate edging toward 40%; his overall strikeout rate of 32.1% is nine percentage points above his career mark. He’s anything but a free swinger, with his chase rates right around 20% in both halves; instead, he’s being beaten in the zone, with his Z-Contact rate dropping from 84.3% to 76.5%. His performance against fastballs in the zone, good grief:
| Pitch | Split | PA | BBE | HR | EV | Brl% | HH% | AVG | xBA | SLG | xSLG | wOBA | xwOBA | Whiff% |
|---|---|---|---|---|---|---|---|---|---|---|---|---|---|---|
| 4-Seam | 1st | 82 | 58 | 9 | 92.6 | 12.2% | 55.2% | .269 | .267 | .654 | .613 | .399 | .383 | 21.4% |
| 4-Seam | 2nd | 76 | 38 | 2 | 87.1 | 10.5% | 38.5% | .208 | .188 | .333 | .408 | .231 | .258 | 32.6% |
| Sinker | 1st | 43 | 35 | 3 | 92.7 | 7.0% | 51.4% | .302 | .324 | .512 | .512 | .347 | .357 | 3.2% |
| Sinker | 2nd | 24 | 17 | 1 | 91.8 | 8.3% | 64.7% | .217 | .269 | .435 | .489 | .292 | .335 | 8.3% |
Trout is whiffing on nearly one-third of four-seamers in the zone since the All-Star break, and when he makes contact, it’s nothing to write home about. Is the 34-year-old slugger completely washed, as the kids say? Was he pressing in pursuit of the milestone homer? I don’t know, but this is grim stuff, and at some point when playoff baseball isn’t bearing down upon us, his 2025 performance deserves a deeper dive.
The 23-year-old Wood, who is in his first full season, is a disciplined hitter as well, with an overall chase rate of 24.9% and little variance from first half to second. His zone contact rate has dropped from 82.7% to 76.8%. So far, it’s a similar pattern to Trout, but his recent in-zone struggles also include sliders:
| Pitch | Split | PA | BBE | HR | EV | Brl% | HH% | AVG | xBA | SLG | xSLG | wOBA | xwOBA | Whiff% |
|---|---|---|---|---|---|---|---|---|---|---|---|---|---|---|
| 4-Seam | 1st | 81 | 58 | 7 | 102.2 | 21.0% | 79.3% | .385 | .410 | .744 | .852 | .476 | .527 | 17.2% |
| 4-Seam | 2nd | 62 | 34 | 2 | 101.7 | 12.9% | 76.5% | .267 | .289 | .483 | .509 | .329 | .350 | 25.0% |
| Sinker | 1st | 58 | 44 | 5 | 95.7 | 13.8% | 56.8% | .362 | .298 | .672 | .600 | .438 | .375 | 19.1% |
| Sinker | 2nd | 24 | 20 | 1 | 102.8 | 8.3% | 80.0% | .333 | .394 | .542 | .567 | .373 | .415 | 8.1% |
| Slider | 1st | 35 | 29 | 3 | 94.0 | 20.0% | 60.7% | .343 | .376 | .629 | .798 | .412 | .491 | 32.4% |
| Slider | 2nd | 20 | 12 | 0 | 89.4 | 5.0% | 50.0% | .211 | .348 | .263 | .495 | .230 | .379 | 36.6% |
In the first half, Wood was annihilating these pitch types in the zone. He’s still performing well against them, albeit with much more swing and miss. When he does chase, he’s whiffing a lot more often as well, with his rate rising from 51.2% before the break to 63.6% since. As with Trout, a deeper dive is merited at some point.
One thing I wondered with regards to these hitters and their second-half power outages is whether they had been especially homer lucky or unlucky according to Statcast. Statcast doesn’t break its expected home run totals by date, but long story short, the most extreme shortfall from among the players above is that of Carroll, who’s 2.0 homers shy of his expected total. De La Cruz is 2.8 homers above his expected total, and the four others I’ve examined more closely are also above theirs (Trout +1.6, Suzuki +1.0, Crow-Armstrong +0.9, Wood +0.7) so maybe what we’ve seen from them over the past two-plus months has been about their luck starting to even out. Those gaps are small potatoes compared to the ones of, say, Raleigh (+8.2) and Kyle Schwarber (+7.3) at one end and Salvador Perez (-4.1) and Roman Anthony (-4.0) at the other.
Unsurprisingly, there’s no overarching pattern that fits these players under examination; sometimes it’s a bad approach catching up to them, sometimes it’s the regression monster taking a bite of the action. But as the homers of De La Cruz and Trout show, these sluggers will eventually find their way out of their slumps. Particularly with a lot at stake for De La Cruz’s Reds and Suzuki and Crow-Armstrong’s Cubs as the playoffs loom, their respective teams have to hope it’s sooner rather than later.
Brooklyn-based Jay Jaffe is a senior writer for FanGraphs, the author of The Cooperstown Casebook (Thomas Dunne Books, 2017) and the creator of the JAWS (Jaffe WAR Score) metric for Hall of Fame analysis. He founded the Futility Infielder website (2001), was a columnist for Baseball Prospectus (2005-2012) and a contributing writer for Sports Illustrated (2012-2018). He has been a recurring guest on MLB Network and a member of the BBWAA since 2011, and a Hall of Fame voter since 2021. Follow him on BlueSky @jayjaffe.bsky.social.
i maintain that Mike Trout is one of the most cursed GOATs of all time. his 2nd half numbers also coincide with the angels losing a lot of his lineup protection, so i wonder if that could be a part of it too
He really struggles vs fastballs. Don’t have the exact numbers in front of me, but it’s pretty bad. Which make it hard to hit in the mlb.
In a recent four game set against the team I follow pitchers pounded Trout with the fastball relentlessly. He struck out in 10 of 18 PAs.
A lot of hitters sell out for pull side power late in their career and have a rebound. Thing is as evidenced by his 400th home run he doesn’t need to sell out for pull power. He just needs to hit the ball. What seems obvious to me is his reactions have slowed a touch. And a touch, while coupled w pitches coming in faster every year makes it tough. And if robo umps come it will get worse, he constantly gets high fastballs called balls that are actually strikes. I watch basically every at bat he has. You don’t notice it in other zones, but that’s mostly because he loves the ball low and usually swings.
Naturally as you get older reactions slow. Reactions peak I think around like 13iirc. Forgot what video game it was as I don’t play video games, but I read something about how a lot of people age out of a certain video game at elite levels by like 18 because reactions have slowed. You have to imagine in baseball that happens too. Now as you get older you get stronger often, smarter, more mature etc which might counteract reactions slowing. Course Trout is past where curve starts.
I’ve been thinking about reaction times and aging curves a lot in the context of the new bat speed data. Originally, I had thought that bat speed slowing was the major reason that aging hitters couldn’t catch up to fastballs, but I’m now convinced it’s reaction time. A lot of that is because of reveling at Stanton and Arraez. Stanton at 35 still has the fastest swing in baseball, but has had a normal aging curve offensively. It seems like he would still have above average bat speed until 50 (maybe longer) if he kept himself in shape. He’s obviously not going to play that long (because he has been showing signs of age), because he’ll be too slow getting his bat off his shoulder. And then Arraez has made it clear that slow bats (relatively speaking) are positively correlated with contact rates, so having a slow bat has little to do with catching up to a fastball.