Daily Graphing – Jim Thome
For the first time in 7 years, Jim Thome failed play in over 140 games after having season ending elbow surgery in mid August. Before his decision to shut things down, he was easily having the worst season of his career by batting only .207 with a mere 7 home runs in 193 at bats. Jim Thome insists he'll be fully recovered from shoulder surgery next season and ready to play for his new team, the White Sox. While a rebound for the slugger is almost a certainty, how much of an improvement over last year should be expected?
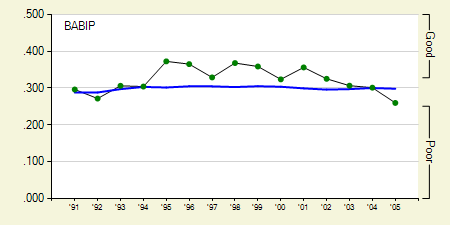
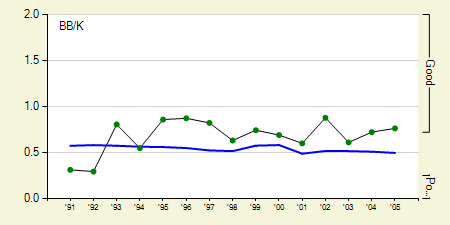
First let's address his poor batting average. Besides injuries, some of his .207 batting average can be attributed to a very low Batting Average on Balls in Play (BABIP). As you can see his 2005 BABIP of .260 is way out of line with his career averages and should revert to at least the .300 mark next year. In addition to his low BABIP, his walk to strikeout ratio remains above average which only bolsters evidence that his batting average will rebound.
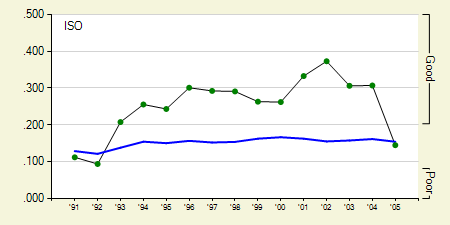
However, the area where he experienced the most severe decline was not his batting average but his Isolated Power (ISO). Much of this decline is likely due to injuries, but he'll be 36 years old next season and I'd be surprised if his age wasn't slightly responsible for the decrease in power.
If Jim Thome can remain healthy next season, I don't see any reason why he won't have a significant rebound. His batting average should return to around his career averages, but I'd be surprised if he had another 40 home run season. Considering his health and age, I think 30 home runs is more within reason.
David Appelman is the creator of FanGraphs.