Do Managers Give Their Toughest Battles to Their Strongest Relievers?
There’s a saying: “God gives his toughest battles to his strongest soldiers.” I guess it started as an earnestly encouraging axiom, but like everything in 2024 it’s gone through a car wash of irony and post-irony, emerging on the other side as something only an expert in semiotics could trace from the Christian bookstore to the Something Awful forum.
Nevertheless, it got me thinking about leverage index. (Most things get me thinking about leverage index.) “There’s nothing so much like a god on earth as a general on a battlefield,” Michael Shaara once wrote. Are the generals of baseball — managers — like God in this respect? Do they give their toughest battles to their strongest soldiers?
The age of managing a bullpen to fit the save rule is, if not over, then at least waning. Today’s relievers are young enough to have grown up mocking Jerome Holtzman, and they accept that the most important inning is frequently not the ninth. That makes the manager’s job a little trickier: Rather than lining up his best bullpen arms by inning, he has to feel the game out. To guess whether the time to use A.J. Minter is with two lefties coming up in a two-run game in the seventh, or to hold on for a higher-leverage situation that may or may not come. How are they doing?
Let’s start with gmLI — that’s average leverage index when a pitcher enters a game. Though a leverage index of 1.00 is neutral, relievers by their very nature enter games in higher-leverage situations than starters do: The league-wide gmLI for relief pitchers this season is 1.13.
Over the course of a season, a pitcher’s gmLI gives a general sense of how tenuous the situation is when he enters the game. It doesn’t account for changing roles, or matchups, or bullpen rest, or who’s coming up in the lineup. But in general, a higher gmLI means higher-leverage usage. Here are the top 10 relievers in gmLI this season.
| Name | Team | gmLI |
|---|---|---|
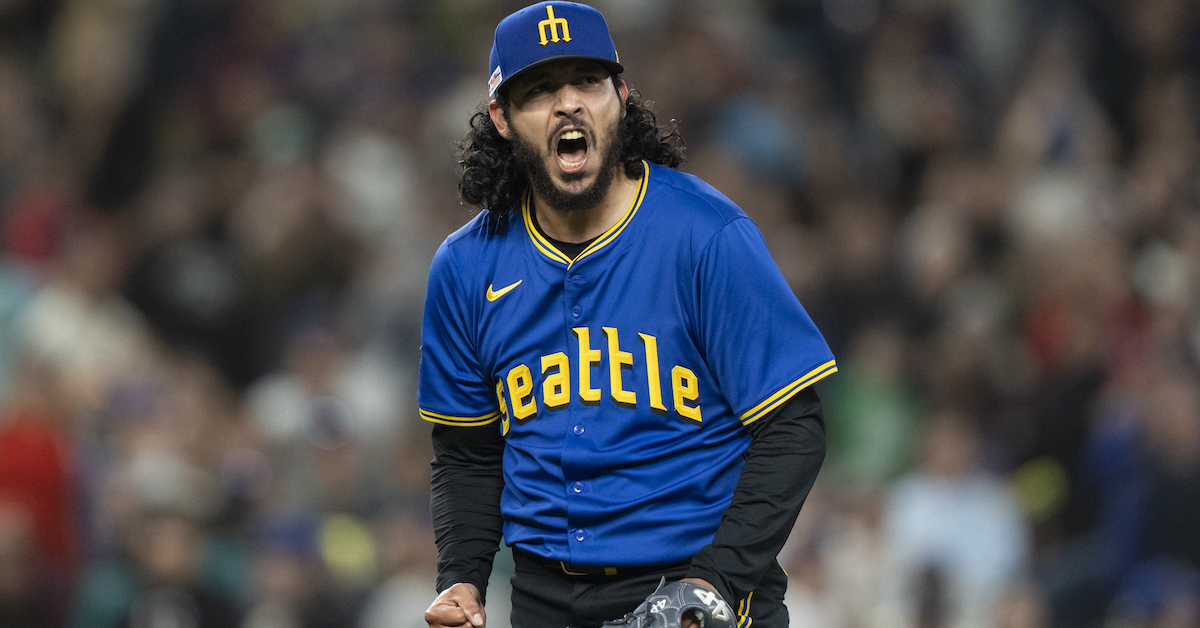
| Andrés Muñoz | SEA | 2.28 |
| Edwin Díaz | NYM | 2.01 |
| Tanner Scott | MIA | 1.98 |
| Trevor Megill | MIL | 1.97 |
| Clay Holmes | NYY | 1.91 |
| Jason Foley | DET | 1.90 |
| Craig Kimbrel | BAL | 1.89 |
| Jhoan Duran | MIN | 1.89 |
| Kyle Finnegan | WSN | 1.87 |
| Kenley Jansen | BOS | 1.87 |
Lots of really good pitchers, or at least big names, plus Jason Foley.
But let’s take all these relievers, and leave alone all that window dressing about God and the Battle of Gettysburg: Are managers using their best relievers in the biggest moments?
To be honest, the answer to this depends on how you define “good.” I’m actually a big fan of using WPA to judge bullpen results, because the job of a relief pitcher isn’t to generate the kind of context-neutral aggregate value measured by WAR; it’s to improve his team’s chances of winning in a specific, often idiosyncratic moment. Context is everything.

But WPA is tied to leverage index, so while the correlation between the two is strong, it’s because WPA is dependent on leverage index. That can be for good or ill. You can see Muñoz and Emmanuel Clase up in the top right corner of the graph, but two of the pitchers at the bottom of the league in WPA — Justin Lawrence and Michael Kopech — are 17th and 40th, respectively, in gmLI. Someone has to pitch high-leverage innings for bad teams.
Let’s try ERA. How closely does that track with gmLI?

For starters, you can see that the slope of the fit line is going down instead of up. That’s not a mistake: A higher WPA is good, but a higher ERA is bad, so it’d make sense that if better pitchers get tougher innings, ERA and gmLI would have a negative correlation. A negative correlation, but (spoiler alert) the weakest one of the stats I went through, with an r-squared of just 0.13.
That’s not nothing in social science circles, but it’s hardly ironclad. For comparison, I took a look at the average leverage index for all events (pLI) for position players with 100 or more plate appearances (391 of them so far this year), compared to their wRC+. As much as bullpen management comes down to educated guesswork, there’s basically no way for a manager to finagle his best hitters into the highest-leverage situations. Sure enough, the correlation between pLI and wRC+ for hitters is not only going in the wrong direction, it’s extremely weak: The r-squared is 0.000092, or so small Excel originally gave it back to me in scientific notation.
So the fact that there’s even this much correlation between reliever quality and gmLI indicates intentionality on the managers’ parts. As one would hope. Managers don’t pick out relievers by throwing darts at their lineup card. (Though I’ve covered a couple playoff series that made it seem that way.)
Anyway, back to the main thread. The (relatively) weak correlation between gmLI and ERA has two sources. First, ERA doesn’t actually measure effective high-leverage relief work. The really big gmLI numbers often result from a pitcher entering the game with someone else’s runners on base; a pitcher could blow a save without actually getting charged with a run. Second, relievers don’t pitch that many innings, so one bad outing could blow up the numerator on said pitcher’s ERA in a way that he can’t recover from, even over the course of a season.
For example, Josh Hader is currently rocking a 3.68 ERA. That’s better than league average, but hardly commensurate with his underlying numbers and definitely not what you want from an elite closer. But about eight-tenths of a run of that ERA comes from one horrendous outing back in April that I remembered only because I wrote about it at the time.
Let’s try opponent wOBA instead.

The correlation here is stronger: 0.185. I’ve marked two guys who are underperforming their roles by leverage: The purple dot is Lawrence, and the light blue dot next to him is Royals closer James McArthur. I don’t want to kick McArthur while he’s down — the night before I wrote this, I watched him give up five runs in a blown save against Arizona, which caused his ERA to balloon by more than a run — but in general he’s been one of the weaker capital-C closers in baseball this year. Not that Matt Quatraro has many options; the Royals’ rotation has been unbelievable but the bullpen in general has been average at best. One understands why they made that early trade for Hunter Harvey.
The strongest correlation of the stats I used is K-BB%. This metric, like wOBA and ERA, has its blind spots, but it does illustrate a pitcher’s ability to do well at what is within his control: miss bats and avoid walks. The r-squared for K-BB% is 0.197.

The fit line goes up this time because, unlike ERA and opponent wOBA, more is better for a pitcher. One thing I like about this graph is it gives us a sense of which pitchers are actually overperforming their roles: Cade Smith, Jeremiah Estrada, and Dedniel Núñez are all way above the pack in K-BB% — third, fourth, and eighth in the league — but with gmLIs that are within a couple hundredths of a point of average for a reliever. But all three of those pitchers 1) is in his first full year in the majors and 2) works for a club with an established and well-entrenched closer: Clase, Robert Suarez, and Edwin Díaz, respectively. Maybe Smith, Estrada, and Núñez have earned bigger roles, but such opportunities might not be available on their current teams.
So do managers give their toughest battles to their strongest relievers? Usually, yeah, it seems like they do.
Michael is a writer at FanGraphs. Previously, he was a staff writer at The Ringer and D1Baseball, and his work has appeared at Grantland, Baseball Prospectus, The Atlantic, ESPN.com, and various ill-remembered Phillies blogs. Follow him on Twitter, if you must, @MichaelBaumann.
“Someone has to pitch high-leverage innings for bad teams.”
A little bit of what should be obvious brilliance, succinctly summarizing something I encounter off the field more often than I’d like!
Bad teams also tend to have their hands forced more about when pitchers pitch, especially if they are bad because of their starting pitching. If the starters go six or seven three days in a row, the bullpen is rested and the manager can pick whatever two or three he likes. If the starters routinely only manage four or five, the manager gets to pick from whoever is available.
One thing that suggests might be an interesting graph–what if you took those stats and normalized them to the total bullpen results for their own team? Like Justin Lawrence’s ERA is 5.40, which is bad, but when you compare it to the Rockies’ overall bullpen ERA of 4.59, it’s… still quite bad, but probably not as much worse by percentage as before.
Oh whoops! I looked at Colorado’s bullpen FIP instead of their ERA. Their bullpen ERA is 5.66, which means Lawrence is better than average for his team. Bud Black is redeemed!
Anyway, for a ridiculously quick and dirty analysis: I took every reliever with at least 20 IP, tossed the ones who’ve pitched for more than one team (sorry Big Mike Baumann), and took everyone else’s ERA divided by their team’s bullpen ERA and their K-BB% subtracted from their team’s bullpen K-BB%. Then I used Excel’s CORREL function with reliever gmLI. ERA/team ERA had a correlation of .049, which doesn’t seem right at all. Shouldn’t it go the opposite way? But K-BB minus team K-BB had a correlation of .408, which is pretty high!
Then I decided to do ERA minus team bullpen ERA and the correlation for that was -.314, which seems more like it. The moral about the difference between switching from ratios to differences is probably “this analysis isn’t very robust.”
According to Excel help this is Pearson correlations, for what it’s worth.