
Dylan Bundy Is Beating the Long Ball
The other day, while I was doing my usual perusal of the FanGraphs’ Season Stat Grid, I came across an interesting find. Orioles pitcher Dylan Bundy had seen the largest year-over-year decrease in home runs allowed per nine of any pitcher in baseball.
This was particularly interesting for a plethora of reasons, none less important than the fact that we’re currently witnessing baseball in its most homer-happy era ever. We all know this, Rob Manfred knows this, and the Orioles certainly know this, having set the record for most home runs allowed in a single season all the way back on August 22. Thus, there is a certain irony here; of all teams, the Orioles currently employ the pitcher who has witnessed the largest year-over-year decrease in home runs per nine.
Bundy’s career has followed an interesting arc. He was the fourth pick of the 2011 draft, with a four-seam fastball that touched 100 mph. He made his major league debut the following year, becoming the first Oriole to debut before his 20th birthday since Mike Adamson in 1967. Bundy only pitched 1.2 scoreless innings, all out of relief, but the excitement in Baltimore for their top pitching prospect was understandably palpable.
Tommy John surgery ended Bundy’s 2013 before it began, and in the process of rehab, he had to be shut down indefinitely due to shoulder issues. Long story short, Bundy didn’t return to the majors until 2016, making his season debut on April 7, a grand total of 1,290 days after his last major league outing.
Bundy is now concluding his third full season in Baltimore’s rotation, and though 2019 did not produce his best results, he certainly wasn’t bad. Over 161.2 innings, Bundy posted a 4.79 ERA, a 4.74 FIP, and 2.5 WAR. But, as noted above, he also posted the largest year-over-year decrease in home runs per nine. Here are the leaders in that statistic:
| Player Name | 2018 | 2019 | Difference |
|---|---|---|---|
| Dylan Bundy | 2.15 | 1.61 | -0.54 |
| Luis Castillo | 1.49 | 1.07 | -0.42 |
| Andrew Cashner | 1.47 | 1.15 | -0.32 |
| Zack Greinke | 1.21 | 0.91 | -0.30 |
| Charlie Morton | 0.97 | 0.69 | -0.28 |
One interesting note: Of the 68 pitchers who qualified for this leaderboard, just 19, or 28%, saw any year-over-year decrease in HR/9. Of course, there is a built in advantage (?) for Bundy to lead the majors here; because he served up so many long balls in 2018, it is easier for him to decrease his HR/9 substantially. If we look at the year-over-year percent decrease in HR/9, Bundy still ranks near the top of the list, but he’s no longer No. 1:
| Player Name | 2018 | 2019 | Difference | % Dec |
|---|---|---|---|---|
| Charlie Morton | 0.97 | 0.69 | -0.28 | 28.9% |
| Mike Clevinger | 0.94 | 0.67 | -0.27 | 28.7% |
| Luis Castillo | 1.49 | 1.07 | -0.42 | 28.2% |
| Dylan Bundy | 2.15 | 1.61 | -0.54 | 25.1% |
| Zack Greinke | 1.21 | 0.91 | -0.30 | 24.8% |
Regardless, I became quite interested in Bundy’s 2019 season for one reason: it’s weird. He struck out fewer hitters this year and walked more, which is not really a recipe for success. But he also started getting many more groundballs. With a 7.5-point jump, Bundy has the third-highest year-over-year groundball rate increase from 2018 to 2019; he’s fourth when you sort by percent growth:
| Player Name | 2018 | 2019 | Difference | % Inc |
|---|---|---|---|---|
| Justin Verlander | 29.1% | 36.6% | 7.5% | 25.8% |
| Matthew Boyd | 29.0% | 36.0% | 7.0% | 24.1% |
| Jake Odorizzi | 28.4% | 35.0% | 6.6% | 23.2% |
| Dylan Bundy | 34.0% | 41.5% | 7.5% | 22.1% |
| Luis Castillo | 45.9% | 55.7% | 9.8% | 21.4% |
Intuitively, what’s the easiest way to avoid allowing home runs? Generate more groundballs. Granted, it’s not the only way to prevent home runs, evidenced by only a weak correlation between GB% and HR/9 league-wide (r=0.35), but it is one way. That is why xFIP exists. Pitchers who generate more groundballs find themselves at less of a risk for allowing home runs, though they are also more at risk for random variations in their HR/FB rate. In general, pitchers with higher groundball rates tend to have lower xFIPs.
Bundy experienced a career-best xFIP- this season, even in spite of fewer strikeouts and more walks. This goes back to his increase in groundball rate, which likely came on the back of a decrease in fastball usage.
“Everyone’s bringing up [throwing] less than 50% fastballs,” Bundy told The Baltimore Sun in June. “It’s not something where I just said, ‘Oh, I’m going to go do that.’ You can’t just go and do it. It’s not that easy.”
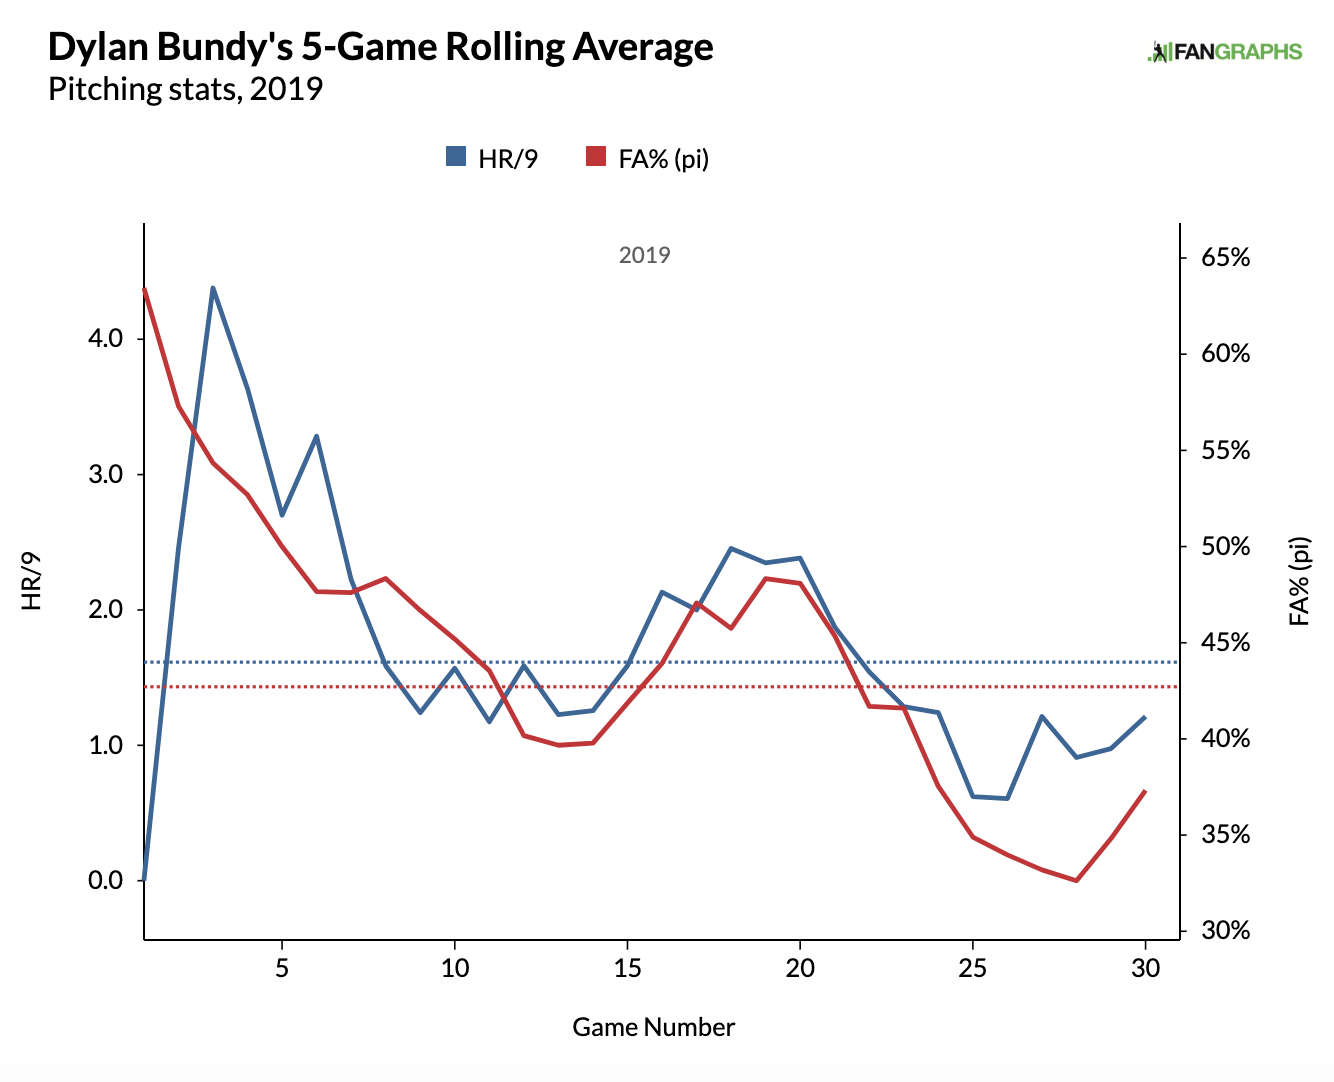
While Bundy claims that it isn’t that easy to decrease his fastball rate, he certainly did it. Bundy’s fastball usage early in the season was fairly high; he threw more than 50% fastballs in seven of his first eight starts. Since then, he’s mixed it up more effectively, adding on only nine more starts with more than 50% fastballs, out of 22 total outings. What’s important about this is that his home run rate began to drop almost directly alongside his decrease in fastball usage:
The pitcher who once could throw 100 mph at the age of 18 has had to reinvent himself. Bundy still has swing-and-miss stuff. His slider has generated whiffs on 48% of swings, his changeup 33%, his curveball 29%. Likewise, they both generate groundballs. Over 50% of the batted balls against all three of these pitches went for grounders. Each experienced a huge spike from 2018:
| Pitch Type | 2018 GB% | 2019 GB% | Difference | % Change |
|---|---|---|---|---|
| Fastball | 24.6% | 23.2% | -1.4% | -5.7% |
| Slider | 43.2% | 50.6% | 7.4% | 17.1% |
| Changeup | 49.3% | 57.3% | 8.0% | 16.2% |
| Curveball | 30.4% | 51.4% | 21.0% | 69.1% |
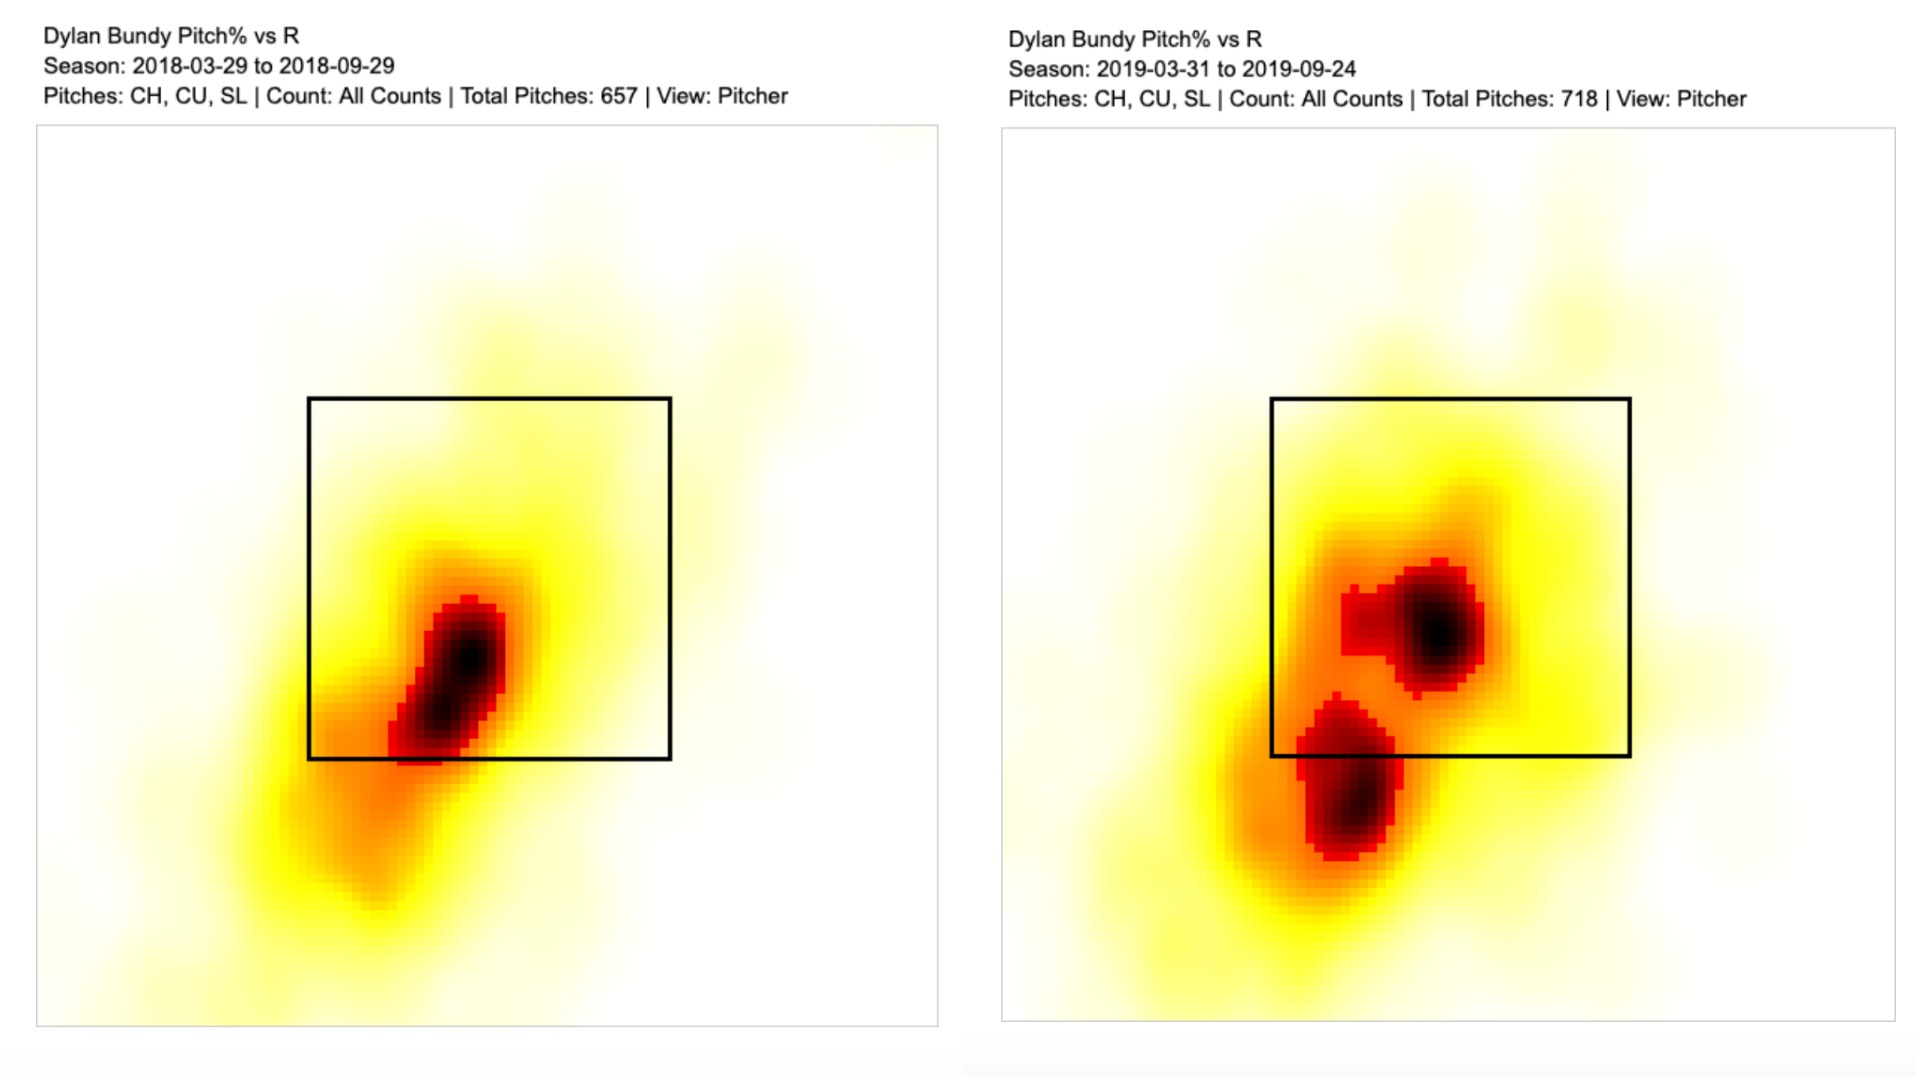
Something like this does not happen by accident. All of his pitches have a generally similar movement profile in both 2018 and 2019, so I doubt that he started throwing anything new or different. Plus, if that were the case, we would likely see only that pitch experience a significant change in outcomes, not all of his pitches like we’re seeing now. I’m inclined to believe that Bundy is locating his offspeed pitches more effectively, and that is the cause of the spike in groundball rate.
I lumped Bundy’s curveball, slider, and changeup results together because, again, they’re all experiencing similar results. Here’s a comparison of where those pitches are being located from 2018 to 2019, first to righties:
And now to lefties:
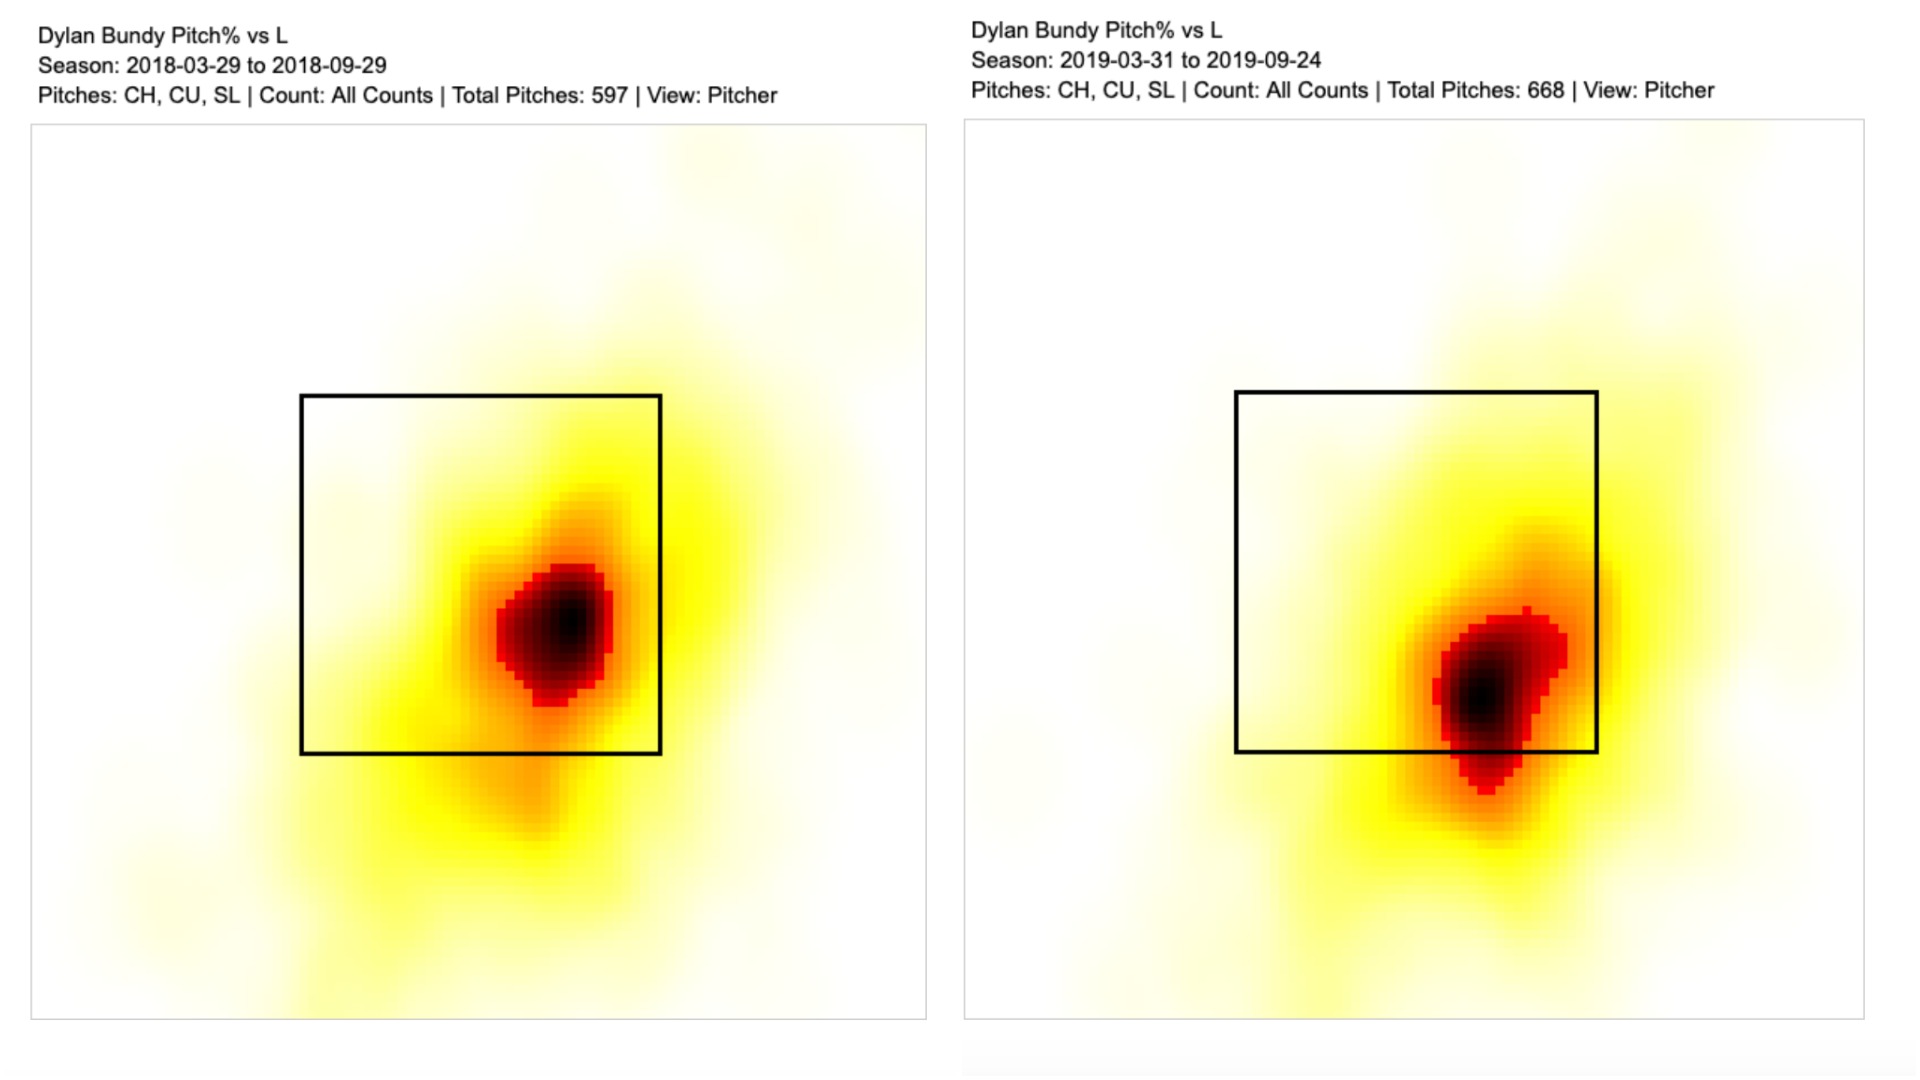
There is definitely a significant change in Bundy’s usage of the low-and-away corner to batters of both handedness. More generally though, Bundy has made a conscious effort of trying to be more around the plate versus right over it. His Heart% — the percentage of pitches in the heart of the strike zone (click this as a guide) — has dropped by four points; for his non-fastball pitches, it has dropped by six. Additionally, his Shadow + Chase% has increased by five points for his non-fastballs. As a result, Bundy is throwing fewer strikes. His Zone% is a career-low, which probably explains his increase in walk rate and decrease in strikeout rate.
All told, Bundy has made a trade-off not too dissimilar from the trade-off I examined with regard to Yu Darvish back in August. Darvish started throwing more pitches down the middle, upping his strikeout rate and home run rate, all while lowering his walk rate. Bundy, however, has decreased the number of pitches he’s thrown in the heart of the plate, and we’re seeing almost identically opposite results. He’s struck out fewer hitters and walked more, all while limiting homers, which — especially in 2019 baseball — could be a good thing.
Dylan Bundy no longer has the ace ceiling that he once had, but that doesn’t mean he’s not interesting. In a wonky year for baseball, we shouldn’t be too surprised to see that the pitcher to decrease his home runs per nine by the most would also be on the team to set the home runs allowed record with over a month to play. At least we know that Bundy tried his best to delay the inevitable history.
Devan Fink is a Contributor at FanGraphs. You can follow him on Twitter @DevanFink.
I expected to see Eduardo Rodriguez on the GB% increase table. Am I missing something?
You’re absolutely right, he should be there. I believe my note w/r/t the qualifiers is incorrect, and I will change that. On the stat grid, there is an input entitled “min. IP,” which, until now, I believed was min total IP across the two seasons, not min. IP in Y1. The reason Rodriguez was excluded was because he did not reach 150 IP in 2018. Thus, I will need to edit my note on the bottom of the table, and going forward, I will choose more effective qualifying figures for IP/PA. Thank you very much.