FanGraphs Pitch Framing
In 2008, when Dan Turkenkopf was the first to quantify the value of pitch framing, he noted that it appeared to be alarmingly important. Bill Letson was similarly astounded when he calculated the size of the effect in 2010. Max Marchi and Mike Fast each took a turn in 2011, finding large and highly correlated catcher values despite using different methods. Other sabermetric luminaries have contributed sophisticated methods and sanity checks, some of which I’ll touch on below. And yet, this terrifically important, seemingly well-established, and impressively repeatable defensive skill has been left out when calculating FanGraphs player WAR and ignored when Steamer forecasts pitchers and catchers. . . until now.
In what follows, I’ll briefly lay out a series of steps for calculating how many framing runs each catcher contributed as well as and how many extra strikes each pitcher was granted (or, in some cases, earned). This much has all been done and clearly described before thanks to Dan Brooks and Harry Pavlidis; that research was updated and expanded upon by Pavlidis and Jonathan Judge. I’ll then compare the values I’ve obtained to the ones created by Baseball Prospectus, StatCorner, and Sports Info Solutions and demonstrate (I hope) that those extra strikes really do result in extra strikeouts and fewer walks. Lastly, I’ll discuss what this means for Steamer forecasts.
Modeling the Strike Zone
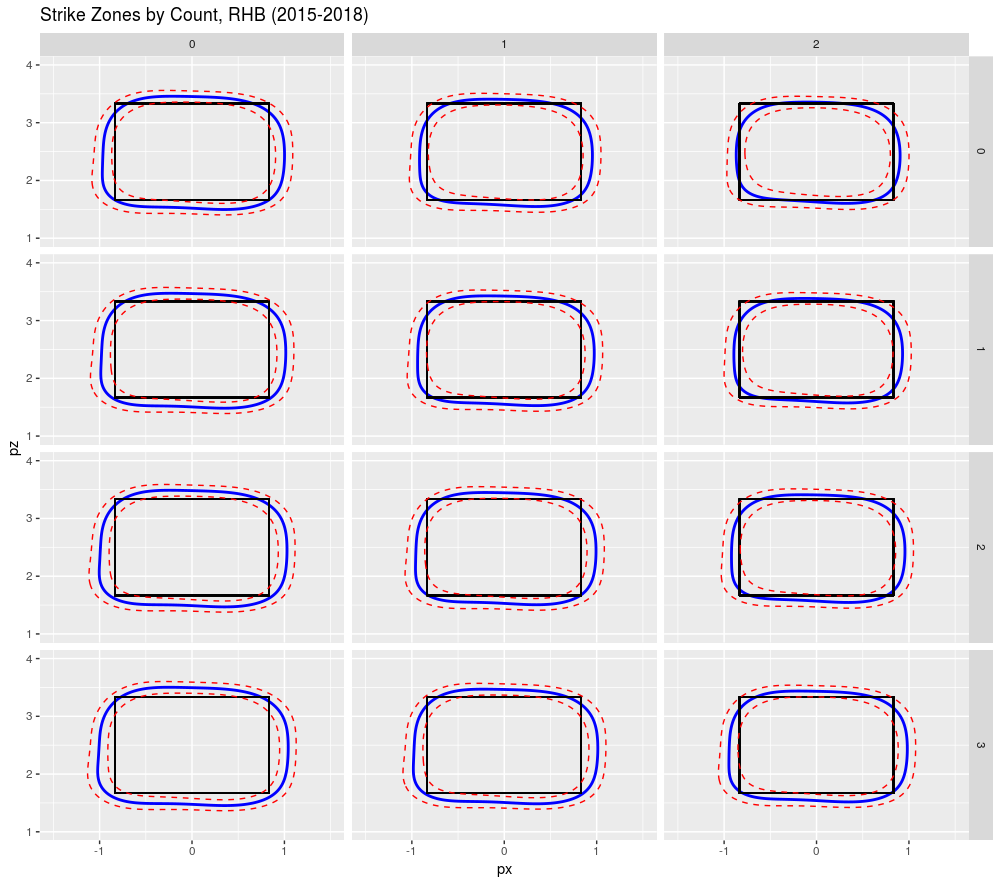
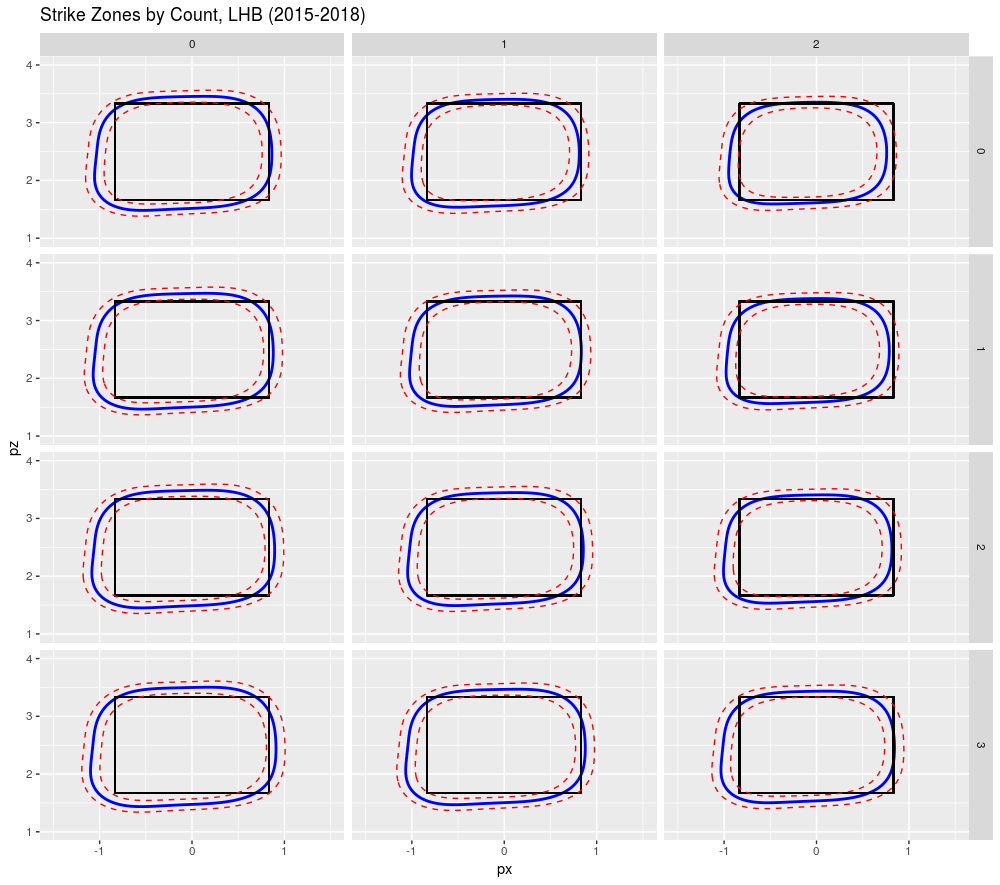
It all starts with the strike zone and I started by using generalized additive models to estimate the probability of a strike in any count, to either left-handed or right-handed batters at each location in and around the plate. On the first pass (shown below), I created strike zones averaged across seasons and, on the second pass, looked for changes in the strike zone by season. The blue contour lines in the images below show where strike calls are a coin flip and the red dashed lines show where we’d expect a 25% or 75% chance of a strike. If you’re read Matt Carruth or Jon Roegele, you’ll be unsurprised to see a small 0-2 strike zones (shown in the upper right facets) and large 3-0 strike zones (in the lower left).
Distributing Extra Strikes and the Case of Ryan Doumit
We can now compare actual strike calls to predicted strike probabilities. I used a logistic mixed effects model (with batters and pitchers as random effects) to split up credit for extra strikes between pitchers, catchers and dumb luck (or, if you prefer, unattributed variance). For now, I left umpires out of the model reasoning that pitchers and catchers each see roughly their share of pitcher-and-hitter-friendly umpires. Also, I’m looking for a model that we can update daily throughout the season and adding random effects quickly adds computational time.
These extra strikes can be roughly translated into saved runs at a rate of 0.135 saved runs per additional called strike. When we do that we find the following highlights and low-lights of (PITCHf/x era) framing history:
| Year | Catcher | FramingRuns |
|---|---|---|
| 2011 | Jonathan Lucroy | 42.4 |
| 2008 | Brian McCann | 37.5 |
| 2011 | Brian McCann | 34.1 |
| 2010 | Jonathan Lucroy | 32.4 |
| 2008 | Jose Molina | 32.1 |
| 2017 | Tyler Flowers | 31.9 |
| 2013 | Jonathan Lucroy | 31.8 |
| 2009 | Brian McCann | 31.6 |
| 2008 | Russell Martin | 28.1 |
| 2010 | Yadier Molina | 27.2 |
| Year | Catcher | FramingRuns |
|---|---|---|
| 2008 | Ryan Doumit | -57.8 |
| 2009 | Gerald Laird | -32.3 |
| 2014 | Jarrod Saltalamacchia | -31.8 |
| 2011 | Carlos Santana | -30.3 |
| 2012 | Carlos Santana | -27.6 |
| 2008 | Chris Iannetta | -26.6 |
| 2009 | Ryan Doumit | -24.6 |
| 2010 | Jorge Posada | -24.2 |
| 2008 | Gerald Laird | -23.9 |
| 2014 | Kurt Suzuki | -22.8 |
“Negative 57.8 runs?” I hear you cry! Well, Jeff Sullivan asked this same question when confronted with Baseball Prospectus’ estimate of -63 runs for this same Doumit season in an article entitled “How Bad Could a Pitch Framer Possibly Be?” Sullivan noted that Doumit was estimated to have lost 200 runs due to poor framing over the course of his career. For a sanity check on this number, he compared how pitchers fared with Doumit behind the plate relative to other catchers on the same team and found that pitchers had in fact allowed 213 more runs with Doumit.
Comparisons to Baseball Prospectus, StatCorner, and Sports Info Solutions
The following charts compare our new Framing Runs to the ones provided by Baseball Prospectus, StatCorner and Sports Info Solutions. Each data point is one catcher season. I’ve kept the axes the same across all three graphs so that you can gauge the relative spreads in runs. One thing that jumps out is that Sports Info Solutions is decidedly more cautious in their numbers than the other three systems.


The following tables shows the correlations between the systems from 2010 (the first year of SIS numbers) through 2018 and the year-to-year correlations for catchers from one season to the next. Our model appears to be most similar to the Baseball Prospectus model but all four models are highly correlated. Our model and BP’s model have the highest year-to-year correlations for catchers but, again, all four systems are in the same ballpark.
| Fangraphs | BP | StatCorner | SIS | Y-to-Y | |
|---|---|---|---|---|---|
| Fangraphs | 1.00 | 0.96 | 0.92 | 0.93 | 0.742 |
| BP | 0.96 | 1.00 | 0.90 | 0.91 | 0.732 |
| StatCorner | 0.92 | 0.90 | 1.00 | 0.87 | 0.698 |
| SIS | 0.93 | 0.91 | 0.87 | 1.00 | 0.695 |
xxFIP really works (and so does pitch framing)!
In 2013 Chris Carruthers asked “How can we take a good ERA Estimator like xFIP, and eliminate framing and bias?” To answer this question he created metrics with inputs that are not affected by the umpire call: swinging strike rates, ball in play rates, zone and out-of-zone looking rates (with zones defined by the rulebook rather than by the umpires) and foul rates. Carruthers created expected strikeout (xK%), walk (xBB%) and xFIP (xxFIP) metrics using only these bias-free inputs. I updated these metrics so that their means for each season match the means of pitchers’ actual rates and then asked whether the differences between pitchers’ actual strikeout rates, walk rates and xFIPs and Carruther’s metrics could be predicted by pitch framing.
More specifically, I built regression models to predict the differences between a pitcher’s actual rates and Carruthers’ bias-free metrics based on the pitcher’s framing runs per game (including runs attributed to the pitcher himself, to his catchers and to luck).
If all these saved strikes our model thinks it sees, really do cause a divergence between xFIP and Carruther’s xxFIP in just the way we might imagine, we’d expect every run per game of framing to correspond to 0.92 runs of difference between the biased and un-biased ERA estimators (since 92% of runs are earned).
| Estimate | Std. Error | t value | Pr(>|t|) | |
|---|---|---|---|---|
| (Intercept) | -0.01602 | 0.004262 | -3.76 | 0.000172 |
| FramingRuns_per9 | -0.8884 | 0.02031 | -43.74 | 0 |
According to our regression model, each framing run predicts a 0.89 difference (with a standard error of 0.02). Not bad! We might also be interested in how much framing affects strikeout and walk rates.
| Estimate | Std. Error | t value | Pr(>|t|) | |
|---|---|---|---|---|
| (Intercept) | -0.0005538 | 0.0001919 | -2.886 | 0.003915 |
| FramingRuns_per9 | -0.03881 | 0.0009144 | -42.45 | 0 |
| Estimate | Std. Error | t value | Pr(>|t|) | |
|---|---|---|---|---|
| (Intercept) | 0.002668 | 0.0002269 | 11.76 | 1.603e-31 |
| FramingRuns_per9 | 0.03932 | 0.001081 | 36.36 | 2.599e-258 |
Our models show that each framing run (per game) adds 3.9% to a pitchers strikeout rate and subtracts 3.9% from his walk rate. Or put another way, it adds 7.8% to the difference. What does this amount to in terms of runs? For that, we can use Tango’s kwERA formula:
kwERA = 5.40 − 12 · (SO% − BB%)
Adding 7.8% to the difference between SO% and BB% should add 12 · 7.8% = 0.94 to a pitcher’s ERA. Again, this is consistent with the 0.92 we’d expect.
These regression models gives me confidence that, although the magnitude of our pitch framing numbers seems astounding, it’s not far wrong. Or, in truth, it gives me further confidence since I was already a believer. If you’re still on the fence, I’d recommend reading Mitchel Lichtman’s research which shows that catcher projected to be good/bad framers really do save/cost runs in the way we’d expect.
Player Projections
With framing numbers now in hand, it’s time to start forecasting. The following table shows a projection for Yasmani Grandal who is expected (by Steamer) to catch 120 games and see 7,599 called pitches (within a 3.5’ x 3.5’ box around the strike zone) in the upcoming season. The “Framing Rates” are Framing Runs per 6000 called pitches and the seasonal weights are how much weight we give to each called strike from that season. The projection is the weighted average of Grandal’s past framing rates with 1000 league average called pitches added to the mix (the “regression towards the mean”). The upshot is that Grandal is expected to save 17.5 runs by virtue of his framing in 2019. His teammates, Manny Pina and Erik Kratz, contribute an additional 1.3 runs of framing to bring the Brewers team total to 18.8 runs.
| season | CalledPitches | FramingRuns | FramingRate | season_weight | proj_weight |
|---|---|---|---|---|---|
| 2018 | 6654 | 13.0 | 11.7 | 1.00 | 6654 |
| 2017 | 6571 | 20.1 | 18.3 | 0.41 | 2714 |
| 2016 | 6550 | 25.7 | 23.5 | 0.17 | 1117 |
| 2015 | 5624 | 23.0 | 24.6 | 0.07 | 396 |
| 2014 | 4156 | 14.7 | 21.2 | 0.03 | 121 |
| league average | 1000 | 0.0 | 0.0 | 1.00 | 1000 |
| 2019 | 7599 | 17.5 | 13.8 | NA | NA |
| Catcher | Team | Games | FramingRuns | FramingRuns120 |
|---|---|---|---|---|
| Yasmani Grandal | MIL | 120 | 17.5 | 17.5 |
| Tyler Flowers | ATL | 74 | 15.4 | 24.8 |
| Jeff Mathis | TEX | 70 | 12.8 | 21.8 |
| Austin Barnes | LAN | 70 | 11.6 | 19.8 |
| Austin Hedges | SDN | 73 | 11.0 | 18.0 |
| Martin Maldonado | KCA | 102 | 10.3 | 12.1 |
| Buster Posey | SFN | 114 | 8.5 | 8.9 |
| Max Stassi | HOU | 50 | 8.5 | 20.2 |
| Roberto Perez | CLE | 55 | 7.0 | 15.4 |
| Jorge Alfaro | MIA | 101 | 6.5 | 7.7 |
| Catcher | Team | Games | FramingRuns | FramingRuns120 |
|---|---|---|---|---|
| Tucker Barnhart | CIN | 116 | -11.6 | -12.1 |
| Willson Contreras | CHN | 113 | -11.6 | -12.2 |
| Omar Narvaez | SEA | 97 | -9.8 | -12.1 |
| Robinson Chirinos | HOU | 70 | -8.4 | -14.3 |
| Isiah Kiner-Falefa | TEX | 25 | -5.2 | -24.5 |
| Mitch Garver | MIN | 46 | -4.9 | -12.8 |
| Kurt Suzuki | WAS | 58 | -4.6 | -9.5 |
| Jonathan Lucroy | LAA | 70 | -4.5 | -7.6 |
| Welington Castillo | CHA | 76 | -3.7 | -5.9 |
| Michael Perez | TBA | 35 | -3.4 | -11.8 |
We use the following three steps to adjust pitcher projections based on framing:
1. Adjust past strikeout and walk rates to what they would have been with typical ball and strike calls. This includes removing any benefit pitchers received due to extra strikes regardless of whether these strikes were attributed to the catcher, the pitcher or plain old luck.
2. Forecast 2019 strikeout and walk rates (in the usual way) using these adjusted strikeout and walk rates.
3. Adjust these forecasted rates based on each pitcher’s projected ability to get extra strikes as well as the abilities of his team’s catchers.
The affects on individual pitcher’s projections are generally quite small. Pitchers who were good at getting extra strikes are projected to continue to get extra strikes going forward so that much is mostly a wash. Pitchers expected to benefit from catchers with soft hands often benefited from these same skilled framers before (meaning that good framing was baked into their numbers already) and, even where their battery mates have changed, they’re only feeling a fraction of that catcher’s contribution to the team.
Nonetheless, here are the pitchers who benefited the most from adding framing to Steamer.
| Pitcher | team | IP | oldERA | newERA | diff |
|---|---|---|---|---|---|
| Mike Minor | TEX | 175.4 | 4.60 | 4.44 | -0.16 |
| Brian Flynn | KCA | 40.0 | 4.41 | 4.28 | -0.12 |
| Chris Martin | TEX | 50.0 | 4.07 | 3.94 | -0.12 |
| Danny Duffy | KCA | 185.2 | 4.36 | 4.25 | -0.11 |
| Jose Leclerc | TEX | 65.0 | 3.64 | 3.53 | -0.11 |
. . . and the pitchers who took a hit.
| Pitcher | team | IP | oldERA | newERA | diff |
|---|---|---|---|---|---|
| Marco Estrada | OAK | 129.7 | 5.24 | 5.41 | 0.17 |
| Alex Wood | CIN | 137.4 | 3.99 | 4.15 | 0.16 |
| Yusmeiro Petit | OAK | 60.0 | 4.39 | 4.53 | 0.14 |
| T.J. McFarland | ARI | 35.0 | 4.07 | 4.19 | 0.13 |
| Jerry Blevins | OAK | 25.0 | 4.47 | 4.60 | 0.12 |
We can add this all up and see how this affects the number of runs each team is expected to allow.
| team | ChangeInRunsAllowed |
|---|---|
| Royals | -13.2 |
| Brewers | -10.2 |
| Rangers | -9.3 |
| Braves | -7.3 |
| Giants | -6.6 |
| team | ChangeInRunsAllowed |
|---|---|
| Mariners | 8.8 |
| Diamondbacks | 6.3 |
| Athletics | 5.7 |
| Angels | 4.5 |
| Astros | 4.4 |
The Royals, Brewers and Rangers feel the benefit of acquiring Martin Maldonado, Yasmani Grandal, and Jeff Mathis, respectively, while the Mariners get dinged for adding Omar Narvaez and the Diamondbacks feel the loss of Mathis.
WAR Adjustments
Once we’ve estimated how many runs each catcher saved (or, in the case of projections, might be expected to save) we translate those runs into wins and adjust WAR accordingly. We can adjust pitcher WAR by doing essentially the inverse and subtracting out the value of catcher framing. Essentially, we’re shifting runs (and thus wins) between pitchers and catchers since catchers deserve some share of the credit (or blame) for what transpired.
Please see David Appelman’s WAR post for all the details.
Jared Cross is a co-creator of Steamer Projections and consults for a Major League team. In real life, he teaches science and mathematics in Brooklyn.
This is so awesome. Also, with the adjustment, Brian McCann looks like he might be a Hall of Famer.
Hall of Framer
He’s also “missing” 2500 innings of framing benefit at the start of his career (2005-07). That could be another 70-80 framing runs or so: a further 7-8 WAR bump.
Of course, lots of the catchers in the HoF (and plenty who aren’t) would presumably have gotten bumps for framing in the past, and the all-time leaderboard is no longer a fair comparison.