Fastball Velocities Are Already Up
Early-season baseball analysis can pose challenges. While it’s fun to consider a world in which Yermín Mercedes is the best player in baseball, we know that this level of performance will not stick in the long run. That can make early-season analyses of players premature, as we need data to begin stabilizing before drawing firm, player-specific conclusions. Luckily, however, league-wide data stabilizes much faster, especially when we put league data in its proper monthly context — acknowledging that April baseball and July baseball are, in fact, different. That’s why it’s fascinating to analyze early season league-wide fastball velocity.
Given how much we at FanGraphs have discussed fastballs lately, it might be time to start calling us FastballGraphs. In all seriousness, there has been some excellent discussion about the fastball here on the site, with both Tess Taruskin and Kevin Goldstein covering the pitch. Taruskin made note of young prospects who threw harder in spring training, while Goldstein underscored the importance of the pitch’s shape. Today though, I’ll be focusing on velocity in the season’s early going.
So far, in 2021, pitchers are throwing hard. Through games on April 7, more than 15,000 fastballs — four-seamers, two-seamers, sinkers, and cutters — have been thrown, with an average velocity of 92.7 mph. On the surface, that might not be eye-popping, but if that holds, it would represent an April record in the Statcast Era. In fact, since 2015, no April or May has ever featured a league-average fastball velocity over 92.5 mph:
| Year | April | May | June | July | August | September |
|---|---|---|---|---|---|---|
| 2015 | 91.8 | 92.2 | 92.4 | 92.4 | 92.7 | 92.6 |
| 2016 | 92.2 | 92.4 | 92.6 | 92.7 | 92.7 | 92.8 |
| 2017 | 92.2 | 92.3 | 92.6 | 92.6 | 92.3 | 92.6 |
| 2018 | 92.0 | 92.4 | 92.5 | 92.5 | 92.5 | 92.6 |
| 2019 | 92.4 | 92.5 | 92.7 | 92.7 | 92.6 | 92.7 |
Further, 92.7 mph is rare for a league-wide fastball velocity reading even later into the season. As velocities have increased over time, we’ve seen more months of 92.7-plus, but it’s worth noting that not once during the 2017 or ’18 seasons did major league pitchers throw as hard in a single month as they are throwing now. Only seven of the 30 months in the above table saw the league-wide fastball velocity hit 92.7 mph.
Of course, if league-wide fastball velocity is increasing, then it must be increasing on an individual level as well. And it is. Consider: Just over a full week into the season, 85 different pitchers have thrown a fastball harder in 2021 than they did during the entirety of the 2020 season. Here are the hurlers with the largest difference in maximum fastball velocity year-over-year:
| Name | 2021 Max | 2020 Max | Change |
|---|---|---|---|
| Mike Foltynewicz | 97.3 | 92.9 | 4.4 |
| Clay Holmes | 98.0 | 94.0 | 4.0 |
| Shohei Ohtani | 101.1 | 97.1 | 4.0 |
| Sean Doolittle | 95.6 | 92.3 | 3.3 |
| José Alvarado | 101.8 | 98.9 | 2.9 |
| Josh Hader | 99.6 | 96.8 | 2.8 |
| Sean Newcomb | 98.6 | 95.8 | 2.8 |
| Cionel Pérez | 98.7 | 96.7 | 2.0 |
| Dylan Bundy | 95.1 | 93.3 | 1.8 |
| Justin Dunn | 95.8 | 94.0 | 1.8 |
| Trevor Rogers | 98.0 | 96.2 | 1.8 |
| Madison Bumgarner | 92.5 | 90.8 | 1.7 |
| Tyler Matzek | 100.2 | 98.5 | 1.7 |
| Taylor Rogers | 98.0 | 96.3 | 1.7 |
| Kyle Crick | 94.3 | 92.6 | 1.7 |
| Joey Lucchesi | 93.7 | 92.0 | 1.7 |
| Nick Pivetta | 97.1 | 95.4 | 1.7 |
| Wade Davis | 95.0 | 93.4 | 1.6 |
| Kolby Allard | 95.0 | 93.4 | 1.6 |
| Casey Mize | 97.9 | 96.4 | 1.5 |
This list is filled with interesting names. At the top, we see players who are returning to full health, like Foltynewicz, Holmes, Ohtani, and Doolittle. Further down the list are players like Bundy, who was throwing noticeably harder even during spring training. And, of course, there are guys like Davis, who has struggled with declining velocity in recent years but might have found something left in the tank.
But the sheer fact that we have 85 different pitchers who have already surpassed their max pitch velocity from 2020 is pretty fascinating. And it’s not like we’re dealing with a small sample phenomenon, either. It would be pretty easy to surpass your maximum fastball velocity in 2021 if you only threw one fastball in 2020, but of the 85 pitchers to break their 2020 highs, 68 threw at least 100 fastballs last year. Right out of the gate, pitchers are throwing much harder this season, and that’s something we’ve been able to observe at both the league-average as well as the individual level.
This might not be totally surprising, given that we’re coming off of what was the weirdest year for baseball everyone in recent memory. For pitchers in particular, their preparation was thrown off, with MLB halting play due to the pandemic in the middle of spring training, before returning for a brief summer camp and a 60-game sprint to an expanded postseason. What a whirlwind it was.
But, among the many ways in which the 2020 season impacted the game, what it also did was throw off the ramp-up period for pitchers. Even after a month of spring training, fastball velocities don’t peak until the middle of the season, where they then typically plateau through the rest of the year. This is represented pretty well when we evaluate the change in league-wide fastball velocity relative to April from 2015 to 2019:
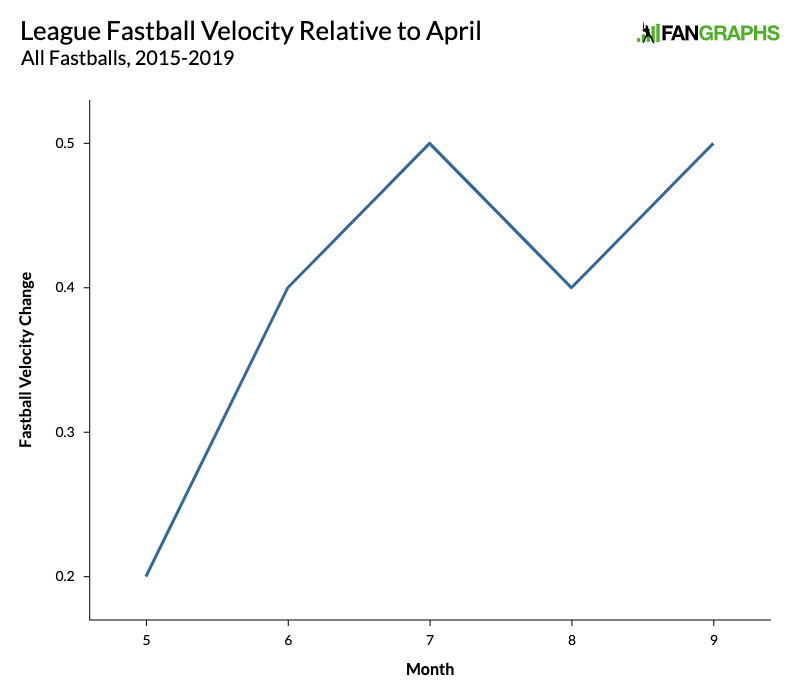
By May, pitchers typically throw fastballs 0.2 mph faster than they do in April, and by June, they typically throw 0.4 mph faster. Things settle in after that, as the month-to-month fluctuations from June through the rest of the season are by no more than 0.1 mph.
As a result of the shutdown, pitchers did not have the opportunity to ramp up. That’s why, in 2020, velocities were actually down a touch. From Opening Day through the end of August, pitchers averaged 92.5 mph on the fastball, while in September, they averaged 92.6, both of which were down year-over-year compared to the same month in 2019. Rather than ramping up during the course of a season, pitchers spent April through most of July throwing on their own. (There’s also Alvarado (notably near the top of the table), who told Matt Gelb of The Athletic that, instead of throwing, he ate too much of his mother’s cooking.)
Perhaps it’s not a surprise, then, that fastball velocities are up compared to 2020. But they’re up even compared to 2019, and with further ramp up, we very much could see the average fastball velocity for a month hit 93.0 mph for the first time. Pitchers are throwing harder than ever before, and even though we’re analyzing all the other ways pitchers can fool hitters with the fastball, it’s important to remember that velocity is still king.
Devan Fink is a Contributor at FanGraphs. You can follow him on Twitter @DevanFink.
I’m sure we’ll see a natural rebound when all these dudes’ tendons and ligaments start snapping like overstretched rubber bands.
Jokes aside, part of the reason why late season velocities run higher than early season velocities could very well be a survivorship issue. Pitchers who enter the year injured, or who’s bodies don’t well adapt to restarting the season, or who try throwing harder and end up exploding their arms…aren’t registering on radar guns in August
Dumb physics question, but is the new baseball partly responsible? If force equals mass times acceleration, then could a tiny change in the mass be responsible for more velocity if thrown at the same force? (Yes, I know that velocity and acceleration are not exactly the same thing.)
I’m not a physicist either, but it’s important to note that there is no relationship between mass and velocity. Mass will affect the rate at which velocity changes — acceleration — but because pitch velocity is measured instantaneously when the ball leaves a pitcher’s hand, any change in mass will have no effect. They are entirely independent.
Effectively, Rawlings loosened the tension “on the first of three wool windings within the ball.” This may have an impact on pitch *movement* but would not have any effect on velocity. MLB even said itself that it “does not anticipate the weight change to impact pitchers’ velocity.”
That’s pretty much why I didn’t mention the ball here. Because MLB only altered the bounciness of the ball, I didn’t think including the ball as a possible reason for this shift made sense as a hypothesis. Feel free to disagree, but that was my take when looking into it.
Source on MLB: https://www.mlb.com/news/mlb-to-alter-baseballs-for-2021
MLB even said itself that it “does not anticipate the weight change to impact pitchers’ velocity.”
I’m not choosing now to start believing MLB’s claims about the baseball itself.
🙂
But, thanks very much for the response and clarification on velocity, and noting your thoughts. Much appreciated!
Ha, neither am I, but I must admit that hearing that was MLB’s take, presumably with the input of actual physicists, made me feel that I was finding the correct conclusions there.
It shouldn’t influence the velocity after it’s left the hand, but won’t the change in mass have some kind of influence on the acceleration of the arm imparting that velocity? The reason we can throw a baseball a lot hard than a 16-pound bowling ball isn’t entirely due to size and drag.
“I’m not a physicist either, but it’s important to note that there is no relationship between mass and velocity.”
As a physicist, gotta mark that one wrong. The velocity as the ball leaves the pitcher’s hand is precisely equal to the change in velocity compared to when the ball was at rest before the pitch. And that change depends, by definition, on acceleration. And hence on the mean force supplied by the pitcher, the duration of that force’s application and — the ball’s mass.
The comment above, about the bowling ball, is entirely on point.
MLB’s claim that a change in mass of the ball will not impact pitch velocity requires some justification that is not given in the linked article.
Yep. If mass had no effect on velocity, then throwing a ball the exact same size and configuration as a baseball, but with a lead core, would have no effect. It does. I believe the author is confusing acceleration due to gravity and the fact that mass has essentially zero effect with the velocity of an object moving parallel to the ground and going from rest to movement.
“While it’s fun to consider a world in which Yermín Mercedes is the best player in baseball…”
You know what they say–it’s no longer a small sample when Mike Trout is on top of the WAR leaderboards. Well, guess who is sitting on top in the morning of April 9th, 2021? Yes sir. So break out that wild Yermin Mercedes speculation, sample size is big enough.
I’m surprised at the lack of mention of the ball, seems to me that is the driving factor here
See above. Responded to another comment on this!
How much of the the 2021 league number is attributable to greater use of relievers? That’s the first hypothesis that came to mind for me looking at a league wide number — we have starters throwing fewer innings than in years past (both because of league wide trends and usage caution because of the shortened 2020 season) and so relievers, who on average throw harder, are accounting for more of the overall pie.
Weight discrepancy ’21 from ’20 matters (about 0.1oz less) shouldn’t matter but I do know it is easier to throw a tennis ball (2oz) much faster than a baseball (5-5.25oz) (assuming you’ve trained well enough for deacceleration). However, it doesn’t seem like enough to help a pitcher speed up his arm action to produce those gains, so I would agree that better conditioning and health preparation may be a big factor.
Another reason why I could see pitchers improving is better video feedback to mechanical improvements (see DeGrom’s improved efficiency) could be finally sweeping through the league. I think that a lot more teams are looking into this as well as their minor leaguers. The road it took DeGrom to reach his peak velocity was not straightforward or quick, so the introduction of efficiency tuning may have started to gain a foothold.
I don’t think we should undersell the degree to which a miniscule change in weight could influence speed of arm action to produce modest gains in fastball velocity (a few tenths of a mph, in this case). It’s not going to be responsible for pitchers who are up several mph individually, but could be an underlying contributor to league-wide trends.
.1 oz can matter seem my conservation of momentum argument below.
The new(est) baseball has both lower mass and higher drag (check out Justin Choi’s article). One place that this higher drag could come from is slightly taller seams which could provide pitchers with better grip/leverage on the ball.
Additionally a reduced mass would increase the velocity as well. Assuming pitchers are imparting roughly the same amount of momentum into the ball via their deliveries that they have previously the reduction in mass would necessitate a proportional increase in velocity to conserve momentum (p=mv). The small mass change in the ball shouldn’t appreciably alter the total momentum inherent in a pitcher’s delivery even if you only take into account the mass and velocity of the pitcher arm and ball in the moment just before release because even a quarter of an ounce(the maximum allowed variation in a mlb ball) is negligible compared to the several lbs weight of a human arm. However a 0.25 oz difference in the weight of the ball represents a 5% change in mass which would lead to a corresponding 5% increase in velocity which would theoretically raise average fastball velocity to 97.125 mph. Obviously there are other real world considerations to be had but the point is that small changes in the balls weight can absolutely affect pitching velocity, at least theoretically. It is entirely possible that the small weight change to the ball is responsible for the increased exit velocities we have already seen this year.
Anyone have a theory as to why velo is up overall? Did Manfred Labs, LLC make the ball heavier this year?
Ah, just read the full comments.
One question: has MLB always measured velo at pitch release? That seems pretty suboptimal, given the amount that spin will affect drag on the way to the plate.
Oh, google is friend….here’s the full story:
https://www.baseballamerica.com/stories/the-measure-of-a-fastball-has-changed-over-the-years/
There are really only two possibilities here: something changed in the way velocity is measured, or something changed about the ball such that it allows for higher release velos.
If MLB is claiming neither is true, they are simply lying.
*Third possibility: Trevor Bauer’s special stick-um prevents slippage of fingers on release, allowing more energy to get transferred to the ball.
One thing I immediately thought when I saw Folty at the top of that list was that his 2020 was the outlier. He’s thrown plenty harder than that before. Many on the list have.
The fact that 85 pitchers surpassed 2020 doesn’t surprise me. How many of them surpassed 2019?
And how much are they up compared to 2019? That’s the better question.
I’m happy to see Folty return to his previous form. He was not a pitcher that could survive in the league at 92 mph. His command isn’t precise enough, and the movement on his secondary pitches isn’t crisp enough to generate whiffs without a significant velocity differential from his fastball.