High Fastballs and Hidden Strikeouts
Every year, I help write the Fantasy Profiles you see on FanGraphs player pages. One of my assigned players for the 2020 season was Michael Pineda. Pineda is a bit of a mystery. In 2019, his fastball was a unicorn. Nothing in his profile made sense. I decided to investigate, and tweeted out my initial findings:
Pineda's 2019 fastball is a unicorn.
Velo down over 1 mph
Spin down
Bauer units (spin/velo) down
Drop in its vertical breakBut
Career-high SwStr%
Career-low GB%The only change I noticed what that in 2017 and 2019, he started living up in the zone more.
— Jeff Zimmerman (@jeffwzimmerman) January 5, 2020
Here’s a detailed breakdown of the above numbers:
| Season | FBv | Usage | Spin | Bauer Units | GB% | Zone% | Total Movement | SwStr% |
|---|---|---|---|---|---|---|---|---|
| 2016 | 94.1 | 51% | 2086 | 22.2 | 41% | 54% | 8.6 | 6.9% |
| 2017 | 93.9 | 49% | 2088 | 22.2 | 48% | 62% | 9.6 | 6.7% |
| 2019 | 92.6 | 55% | 1999 | 21.6 | 29% | 61% | 7.7 | 9.2% |
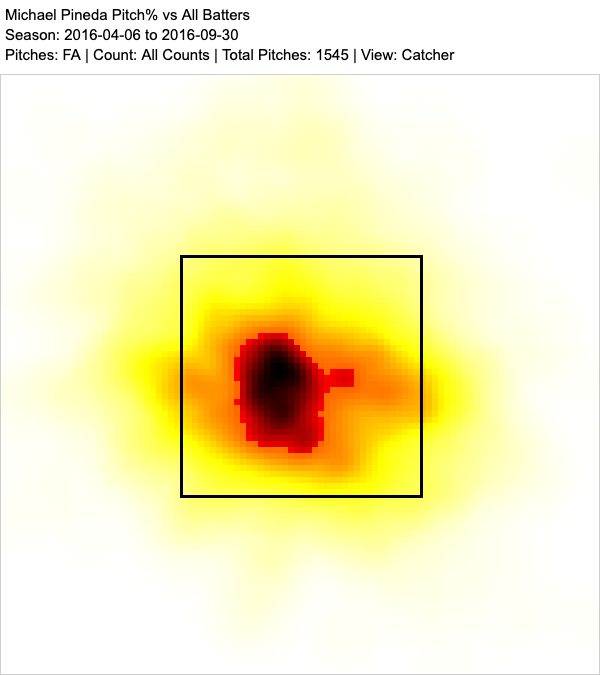
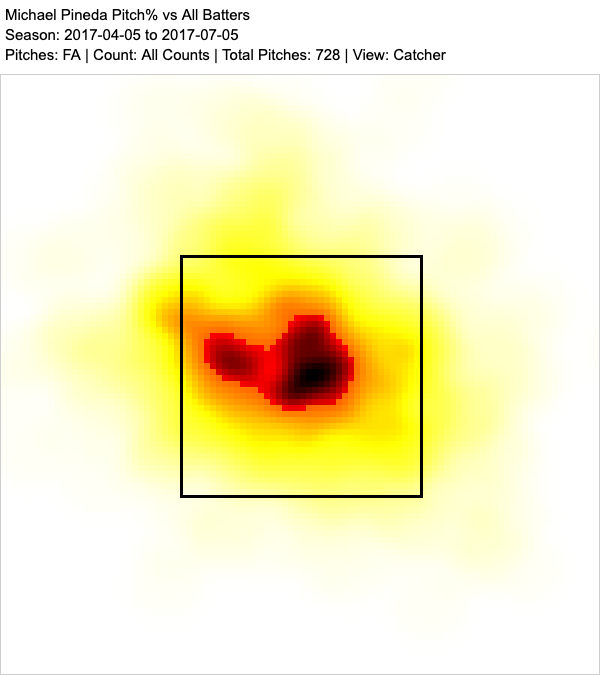
No improved performance indicators stick out quite like higher velocity, greater spin, or a pitcher living in the strike zone more. Sometimes a pitch will improve if it’s thrown less often since batters don’t expect it, but Pineda’s fastball usage jumped. The flashing red lights are with the groundball rate; Pineda’s fastball’s groundball rate was almost halved. Maybe he was throwing higher in the strike zone. Here are his pitch location heat maps over those three seasons.
2016
2017
2019
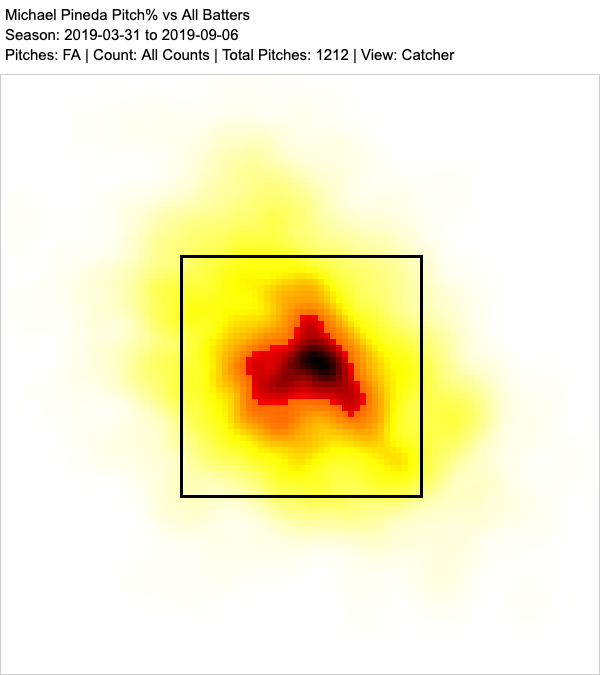
If I squint hard enough, maybe the pitch location is moving up. While a higher fastball location can lead to more fly balls, can it increase a pitch’s swinging strike rate by 50%? It turns out, yes, and here is the proof.
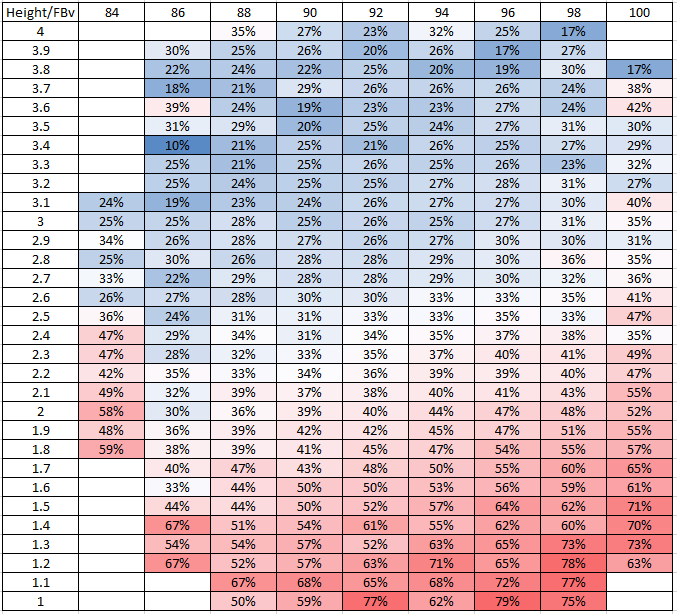
To begin my study, I examined only those pitches in the horizontal strike zone and grouped them into 2 mph increments. From these values, I found the swinging-strike rate depending on the four-seam fastball’s vertical location (min 100 pitches per grouping) from 2015 to 2019. The rulebook strike zone changes based on the batter’s height (these values are in feet), but 2.5 feet is standard for the middle of the zone, with 1.5 feet the bottom and 3.5 feet considered to be the top.
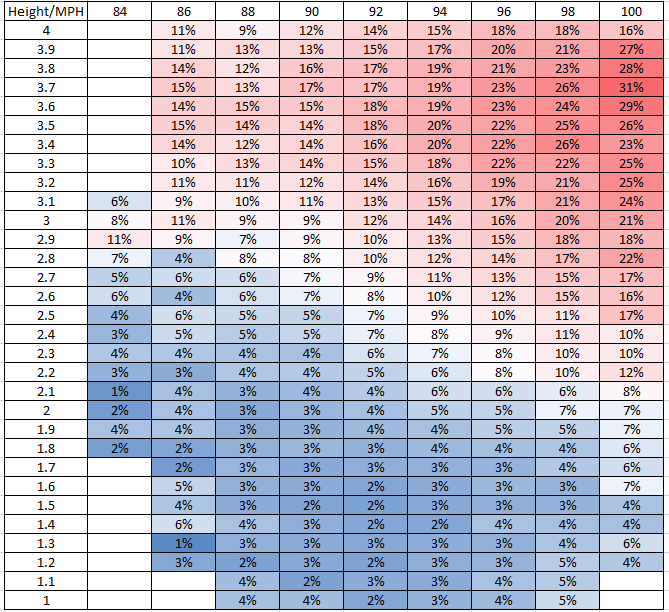
Whoa. A four-seamer’s swing-and-miss ability is all about location, location, location. The swinging strike rate can change by a factor of three-to-four times depending on the pitch’s vertical location in the strike zone. A 90 mph fastball at the top of the zone has a better swing-and-miss rate than a 98 mph bullet right down the middle (14% SwStr% vs 11% SwStr%). No wonder most pitching coaches encourage their pitchers to live up in the zone.
I understand that pitchers can’t just throw high fastballs down the middle of the plate. They need to keep batters guessing when it comes to the pitch and its location. Pitchers are already trying to throw everywhere, and the results show that it’s not exactly working.
And the additional strikeouts do come with a tradeoff: more balls hit in the air. Here are the groundball rates of various four-seam velocities and vertical locations:
Even at the bottom of the zone, the groundball rate is not close to being elite at 50%. Most groundball gains (increased double plays and baserunners going station-to-station) start at around 55% to 60%.
To help balance both the good and the bad of pitching up in the strike zone, I’m going to use pERA to help determine the ideal pitch location. I created pERA a few years back to isolate each pitch’s results and then combine them into an ERA equivalent value. With the juiced ball, the unerlying formula recently changed; now I have three different formulas depending on which version of the ball is being used. Here are the pERA graphs from the three baseball types:
Happy Fun Ball (2017 and 2019)
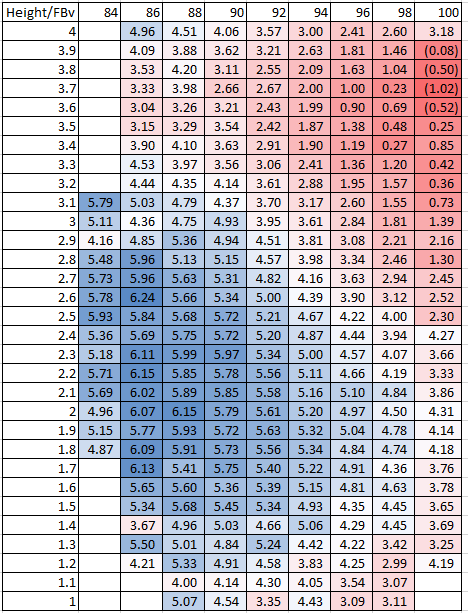
Juiced (2016 and 2018)
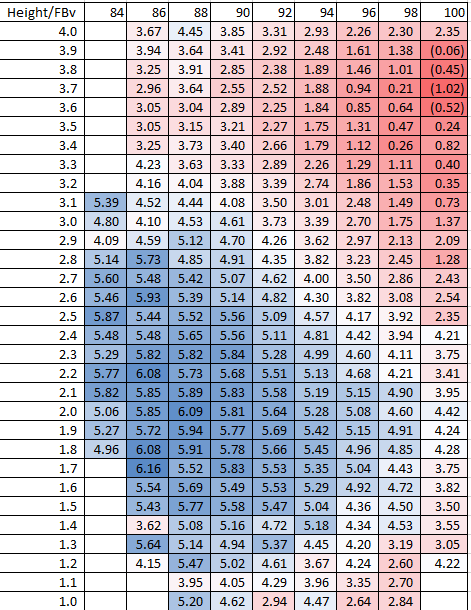
Normal (2010 to 2015)
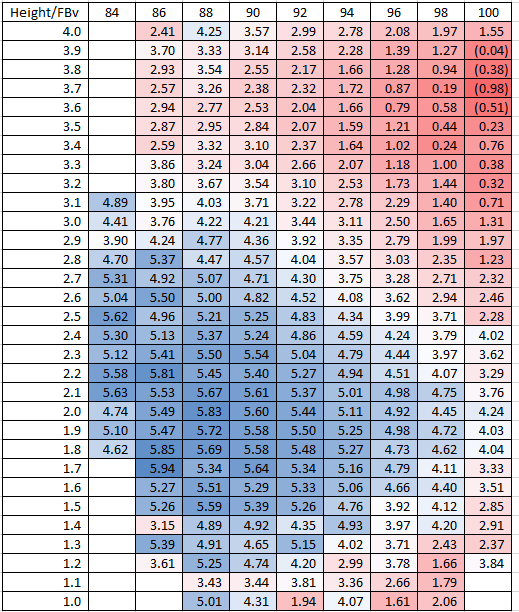
Overall, it’s ideal to locate four-seamers up in the zone, and it doesn’t matter which ball is being used in the majors. The pitch’s effectiveness does drop as the ball becomes livelier. Just looking at 92 mph and a height of three feet, the pERA increases from 3.44 to 3.73 to 3.95, or about a half a run. It should be of no surprise that with so many four-seamers being thrown, the league-wide ERA has increased by almost the same amounts over the same time frame.
Getting back to Pineda, he didn’t raise his pitch height in 2019 (2.7 feet) compared to 2107 (2.6 feet). Some of the disconnect between the pitch’s characteristics and the results could be from him needing Tommy John surgery, and missing all of the 2018 season. The 2019 height is higher than his 2.4 foot mark in 2016. For comparison, here are his swinging-strike rates by height over the three seasons (min 25 pitches per height range):
| Height | 2016 | 2017 | 2019 |
|---|---|---|---|
| 3.5 | 19.2% | 7.8% | 20.5% |
| 3.0 | 10.4% | 14.6% | 15.9% |
| 2.5 | 6.5% | 5.4% | 8.8% |
| 2.0 | 5.4% | 0.9% | 4.6% |
| 1.5 | 6.1% | N/A | 4.2% |
While sample size variation limits consistent values from season to season, the 2016 and 2019 values line up, except for the three-foot value. Pineda isn’t the ideal example, but he helped unearth some usable information. So how about everyone else?
Eyeballing the above images, I created a high zone between 3.3 feet and 3.7 feet. The pitches in this zone have a 17.7% SwStr% and pERA values between 2.10 and 2.20. This is where pitchers want to live. Before creating another unwanted stat, I checked to see if the average vertical position correlates with this high zone and could function as a proxy. Here is the 3.3-to-3.7-feet-high zone compared to the average vertical position for pitchers with a minimum of 100 four-seam fastballs:
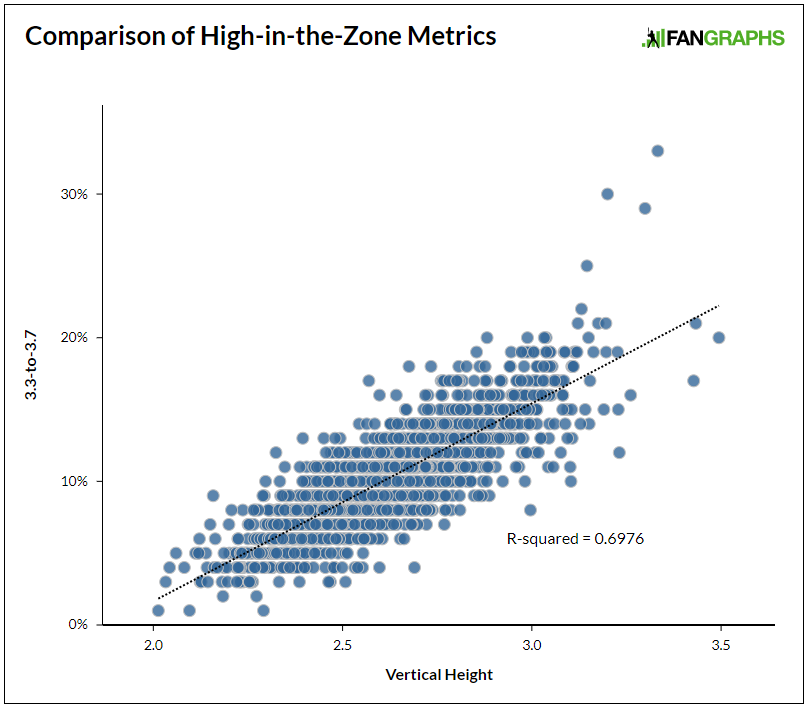
The average vertical height, which is available at Brooksbaseball.net, is an OK proxy. I’m going to continue with the 3.3-to-3.7 rate for now.
Here are the 2019 pitchers who had the largest and smallest high zone rates (min 300 four-seamers and the full list):
| Player | 3.3-to-3.7% | FBv | Avg Vert Hgt | SwStr% | Spin (rpm) | Count |
|---|---|---|---|---|---|---|
| José Quijada | 21.1% | 93.3 | 3.2 | 19.7% | 2400 | 370 |
| Brandon Workman | 19.6% | 92.9 | 3.5 | 14.2% | 2125 | 358 |
| Kyle Hendricks | 19.5% | 87.1 | 3.1 | 13.3% | 2050 | 442 |
| Matt Barnes | 19.1% | 96.6 | 3.2 | 13.5% | 2400 | 498 |
| Dylan Cease | 19.1% | 96.4 | 3.1 | 11.4% | 2450 | 519 |
| Rick Porcello | 18.9% | 91.0 | 3.2 | 9.8% | 2425 | 789 |
| Jake Odorizzi | 18.6% | 92.9 | 3.1 | 16.2% | 2225 | 1404 |
| Nick Anderson | 17.7% | 96.0 | 2.9 | 17.2% | 2325 | 565 |
| Caleb Smith | 17.6% | 91.5 | 3.0 | 11.4% | 2425 | 1111 |
| Tanner Roark | 17.4% | 92.1 | 3.0 | 10.4% | 2150 | 587 |
| Chi Chi González | 6.5% | 92.4 | 2.4 | 9.7% | 2425 | 372 |
| Brad Hand | 6.3% | 92.8 | 2.5 | 10.7% | 2425 | 317 |
| Reyes Moronta | 6.3% | 97.2 | 2.4 | 9.7% | 2375 | 431 |
| Aníbal Sánchez | 6.3% | 90.2 | 2.5 | 6.6% | 2225 | 624 |
| Luis Cessa | 6.2% | 94.5 | 2.4 | 7.2% | 2300 | 374 |
| Jason Vargas | 6.1% | 84.2 | 2.5 | 5.4% | 2225 | 411 |
| Gabriel Ynoa | 5.9% | 93.5 | 2.4 | 7.5% | 2050 | 439 |
| Zack Greinke | 5.6% | 89.8 | 2.4 | 7.4% | 2325 | 927 |
| Corbin Burnes | 4.9% | 95.2 | 2.3 | 8.9% | 2650 | 370 |
| Will Smith | 4.8% | 92.6 | 2.3 | 10.1% | 2225 | 355 |
Kyle Hendricks stays in the league with his 87 mph fastball by throwing it high and having an elite changeup. Another near-90 mph pitcher, Rick Porcello, has a better swing-and-miss fastball than Corbin Burnes and his 95 mph heater. If Burnes decided to average 3.0 feet of vertical, he could see his fastball’s swing-and-miss rate double. When paired with his elite slider (31% career SwStr%), he could post one of the league’s best strikeout rates. For reference, here is Burnes’ heat map of ISO per fastball:
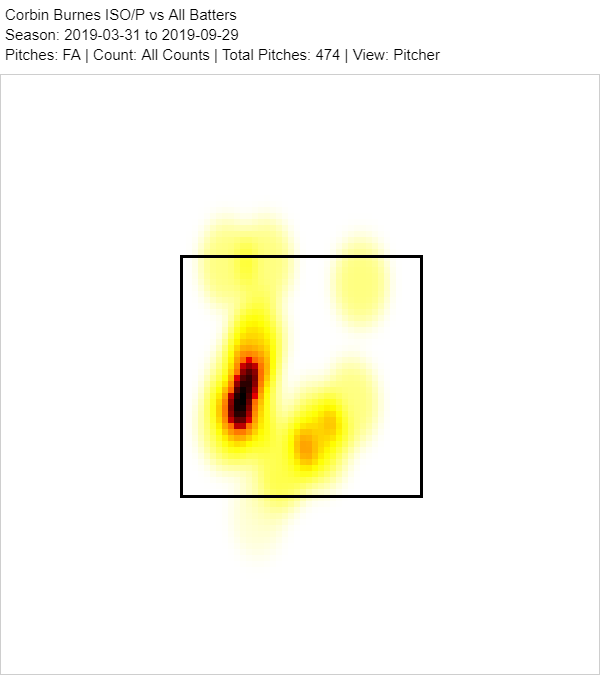
While he was trying for more groundballs by keeping the pitch low, he generated more contact and therefore more extra-base hits. Four-seamers work up in the zone … pitchers should throw them there.
It’s time to wrap up this investigation. I came up with so many more questions than answers while doing this research. What about the location of sinkers/two-seamers? How does spin matter? How are other pitches affected if fastballs are located differently? Is the 3.3-to-3.7 foot zone the ideal sampling box? The velocity groups could be divided up and searched for outliers. Also, control is another input that at some point needs to be included. I’m guessing this won’t be the last post on the subject.
The high fastball has started to dominate the game and for good reason. The results in the upper half of the strike zone are twice as good as those in the lower half — possibly three to four times better. A pitcher can keep every aspect of his fastball the same except for the average location and, on average, improve his performance. Also, pitchers could start throwing in the zone’s lower half with the hope of limiting home runs. If they live in the bottom half, they’ll surrender fewer home run per batted but more balls will be hit into play, so it’s not a huge advantage. When nothing makes sense about a pitcher’s results, don’t forget to look into his average fastball location. It could be the key.
Jeff, one of the authors of the fantasy baseball guide,The Process, writes for RotoGraphs, The Hardball Times, Rotowire, Baseball America, and BaseballHQ. He has been nominated for two SABR Analytics Research Award for Contemporary Analysis and won it in 2013 in tandem with Bill Petti. He has won four FSWA Awards including on for his Mining the News series. He's won Tout Wars three times, LABR twice, and got his first NFBC Main Event win in 2021. Follow him on Twitter @jeffwzimmerman.
Outstanding insights, thanks Jeff!
Thanks
Thanks