Hitters Keep Getting Younger. Pitchers Stay The Same Age.
I have a confession to make. I started this article with a conclusion in mind, only to find that that conclusion was spectacularly untrue. But then I pivoted, and found something else I think is quite interesting. Is it obvious, in retrospect? I kind of think so. But I had fun doing it and learned something in the process, so I decided to write about it anyway.
I had a theory that the average catcher age, along with the average age for all the hardest defensive positions, had plummeted over the past decade, with the average DH age increasing as a counterbalance. My theory was that the universal DH allowed teams to massively alter their behavior. National League teams that had been playing older sluggers in the field could shift them down the defensive spectrum, either directly to DH or by displacing other old players to DH via a chain reaction of moving to easier defensive spots.
It’s beautiful logic, with just one problem: It’s untrue. Here’s the average seasonal age (as of July 1 each year) of catchers, shortstops, and DHs since 2002, the first year we have positional splits that allowed me to run this analysis:
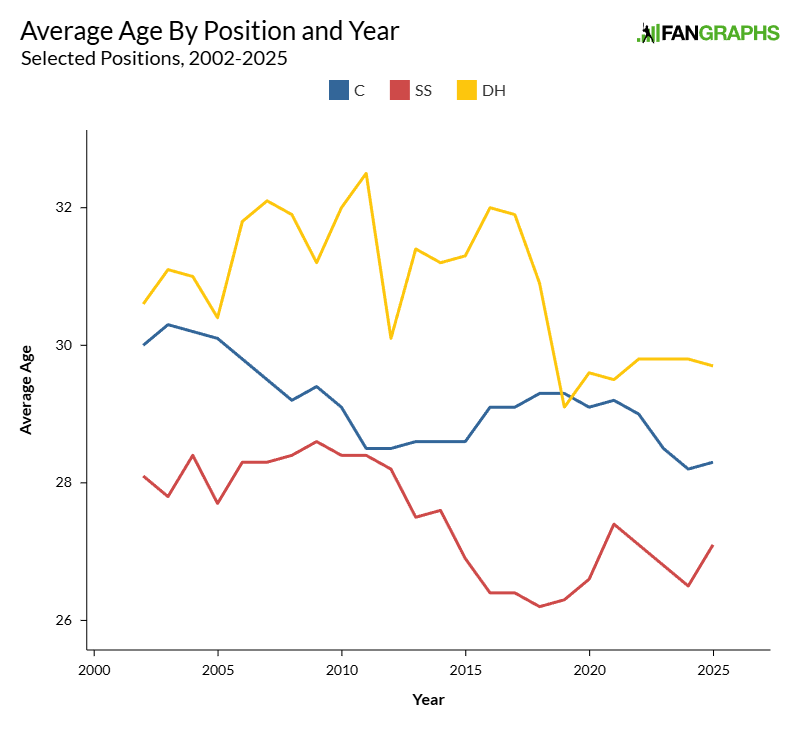
The data is pretty noisy, which makes sense to me. It’s not like teams are targeting a given age; they’re just making baseball decisions about cost, team control, and production. Average age is a downstream result of a lot of decisions that are made for other reasons. But in the aggregate, the pattern I hoped to see just wasn’t there:
| Period | C | SS | DH |
|---|---|---|---|
| 2002-2010 | 29.7 | 28.0 | 31.4 |
| 2011-2020 | 28.9 | 27.1 | 31.0 |
| 2021-2025 | 28.7 | 26.7 | 29.7 |
| 2002-10 vs. 2021-25 | -1.1 | -1.3 | -1.6 |
In fact, DH has experienced the greatest decline in average age across all positions. That’s very much not what I expected. I do think that some of that is overstated. First base has had the smallest decline among positions, and I’d expect many of the displaced older hitters I mentioned in my hypothesis to end up there too. But if you average the age changes of first base and DH, they’re almost exactly the league average for position players. Clearly, the data do not support my claim.
But wait! That’s just position players. My initial theory was about DHs, but there’s another group of older players I always think of when I broadly categorize the league into age cohorts: pitchers. I’ve been writing about the new team-building strategy of drafting hitters and signing older pitchers in free agency for my entire FanGraphs career. If it’s not the Cubs and the Astros, it’s the O’s and the Jays, or the Yankees and the Cardinals, or any number of teams you can think of that fit this model. Last year, only six teams (the Guardians, Dodgers, Phillies, Pirates, Padres, and Mariners) had a pitching group younger than their position player counterparts.
Here’s a different way of looking at the evolution of player age over time:
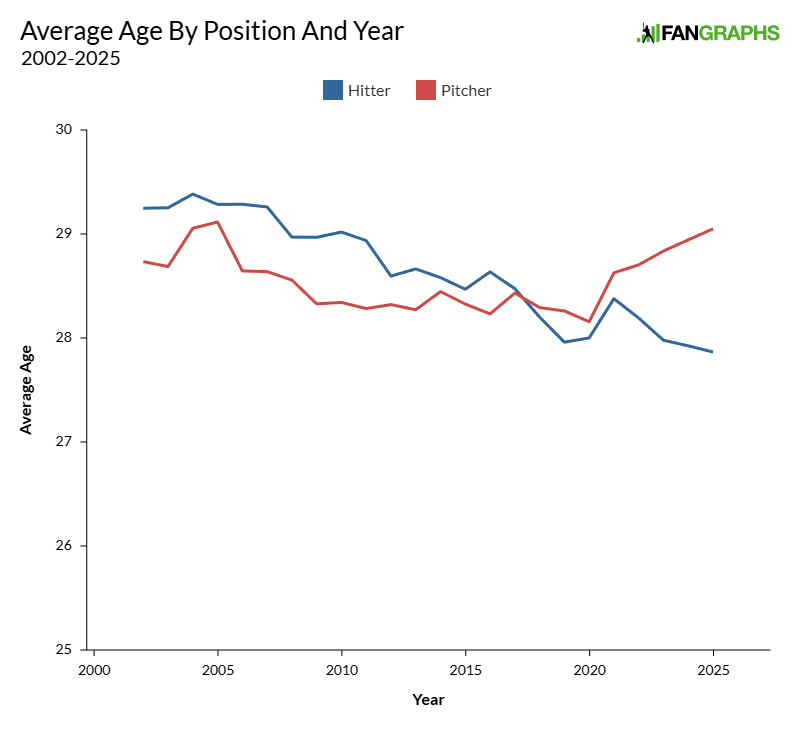
Oh. Yeah. That looks pretty significant.
As I mentioned, this isn’t some great secret. Jeff Lamb wrote about it all the way back in 2016 in the context of the cursebreaking Cubs. But at that point, the average pitcher was still younger than the average hitter, and they had been for decades. Since then, hitter age has continued to decline. Teams are doling out a record low share of plate appearances to batters 35 and older. Recent looks at aging curves have shown hitters declining earlier and pitchers later. It matches the conventional wisdom, as well: Hitters age, while pitchers break.
Many effects have fed this divergence, but I think that the strongest one is the evolution of teams’ opinions about pitcher workloads. Innings caps, workload management, ramp-up plans: Teams are guarding their young pitchers’ health more than ever before, cognizant of the risk of injury that comes with overwork. Meanwhile, pitcher aging isn’t as severe as hitter aging, and the pitchers who are most trusted to deliver big workloads are the ones who are already doing it. That leads to more teams trying to find their pitchers from the group of currently performing veterans. It really is the golden age of the older starting pitcher. Pitchers debut just as early as their hitting counterparts, but modern workload management means teams lean on the olds anyway.
Another way of looking at it: Twenty-seven pitchers in their 30s threw 150 or more innings in 2025. That’s pretty close to the number of 30-year-olds who threw 150 or more innings in 2010 (30). The average from 2000 to 2015 was around 33 30-year-olds hitting 150 innings. That proportion of the game hasn’t changed much at all. On the other hand, 2025 saw 43 pitchers in their 20s hit that 150-inning threshold. Back in 2010, there were 73 20-somethings who hit that mark. The average from 2000 to 2015 was roughly 62. In other words, we’ve seen a bigger decline in workloads for younger starters than older ones.
When team perceptions around health limit the workloads of young pitchers disproportionately, you see the divergence in that chart. It’s not something anyone set out to do on purpose, at least in my opinion. It’s just a natural consequence of the way teams operate these days. The decline in hitter age is that, too: Good young hitters with gobs of team control keep knocking on the door earlier and earlier, and what are teams going to do, not play them? The injury risk looks completely different there; older position players are more at risk, not younger ones, as best as I can tell from the data. And thus, hitter age keeps going down.
Those are hardly the only reasons that this behavior could be occurring. If you can think of a way that the game has changed in the last 25 years, there’s a decent chance that it might, indirectly, change relative pitcher and hitter age. Maybe the universal DH is getting more young fielders playing time. Maybe the latest CBA has changed teams’ relative propensity to start service time clocks on their young hitters who might compete for awards. Maybe, as Eric Longenhagen detailed in 2022, the Rule 5 draft pushes some international pitching prospects to relief roles, getting them to the majors faster but for smaller chunks of playing time. It’s a complex problem, and undoubtedly one with many correct answers.
It’s not entirely accurate to say that Major League Baseball is a young man’s game these days. It’s true to some extent, no doubt. But it’s mostly the case for hitters. Pitchers are headed in the opposite direction. It’s a paradox Matthew McConaughey would appreciate.
Ben is a writer at FanGraphs. He can be found on Bluesky @benclemens.
I’ve pointed this out here a couple of times, but this is very much in line with the Yankees model in the “Judge era”. Based on RosterResource’s current estimated lineup, adjusting for injury, the Yankees have 6 of 9 lineup slots occupied by a 20-something, with only Grisham technically being outside of the initial “control window”. But the rotation is basically a bunch of FA acquisitions well in their 30s (Cole, Rodon, Fried) with only Schlitter really guaranteed a season-long rotation slot from the 20-somethings that they’ve developed.
It really does come down to how the FA market economics have developed — league average pitching is expensive, but the curve bends at the very top end — superstar level starting pitching is cheaper to acquire than superstar level hitting (the Yamamoto/Cole contracts are smaller than even Judge’s, let alone Soto).
90s Yankees were often built like this too
This was also the old Theo Epstein playbook: draft and develop hitters, acquire veteran pitchers.
Interesting group of teams going the opposite direction from this trend (Guardians, Dodgers, Phillies, Pirates, Padres, and Mariners).
I was just thinking this, though when the SuperDodgers were first being constructed, the hitters were younger, and an aging Kershaw was supported by a continuing cast of young phenom pitchers whose arms blew out (Buehler, Miller, May, Gonsolin, and hopefully not Ryan), with the occasional Lance Lynn sighting.
Iirc, he also said during the Cubs 2016-ish era that this plan didn’t come together how he’d expected. Quality veteran pitching became significantly more expensive (in FA $ or trade value) than it had been a few years earlier.