
How Adrian Beltre Has Defied Father Time
This is it. This is the year Adrian Beltre finally declines.
Yep, you heard it here first, folks. Adrian Beltre is donezo. I mean, come on — dude’s about to be 36 years old. He’s logged 10,001 plate appearances since he entered the league in 1998, a number topped by only Derek Jeter. His defense has declined significantly the past two seasons, no matter what metric you use. He only hit 19 dingers last year after averaging 32 over the previous four seasons. Clearly, all that wear and tear has taken its toll on Beltre. The jig is up! The fat lady has sung.
We don’t know everything about how baseball players age, but we know more than we ever have. We know that hitters generally peak around age 26 and are no longer what they once were by age 32. Beyond that, we know, to some extent, how specific components of a batter’s profile age. Walk rates don’t peak until a batter is in his late 20’s. Strikeout rates peak a bit earlier than the magic 26. And power peaks earlier than anything else, and also has the most dramatic decline.
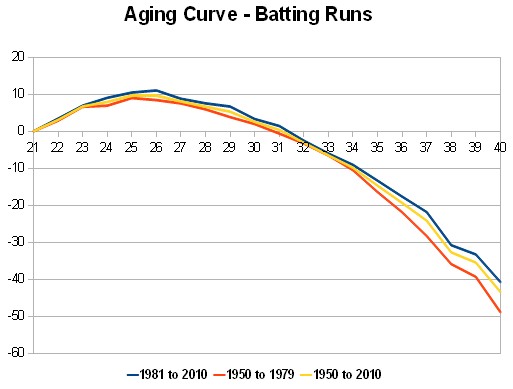
And that makes sense, if you think about it. As a player gets older and his body wears down, is he more likely to lose bat speed and strength, or vision and discipline? Intuitively, we’d expect the former.
Which brings us to our subject. These numbers shouldn’t come as a surprise to you, but I’m about to list the last four years of Adrian Beltre’s isolated slugging percentages. Beside each number, I’ll name a player from the 2014 season with a similar ISO, for context:
- 2011: Age 32, .265 ISO (Giancarlo Stanton)
- 2012: Age 33, .240 ISO (Jose Bautista)
- 2013: Age 34, .193 ISO (Neil Walker)
- 2014: Age 35, .168 ISO (Brett Gardner)
Welp, that’s it. Stick a fork in him. A 36-year-old third baseman on a bad team with declining defense and the power of Brett Gardner? No thanks.
To be fair, Gardner is kind of a sneaky pick, given that his power boost over the last couple years is worthy of an article on its own. I could just as easily have picked Hanley Ramirez or Hunter Pence, who were right in the same spot, but you get the picture. Beltre’s power has declined, and it’s declined significantly. Over the last four seasons, in the power department, Beltre has gone from Giancarlo Stanton to Brett Gardner, all while playing in the hitter-friendly Ballpark in Arlington.
Yet, still, we have this:
- 2011: Age 32, 135 wRC+
- 2012: Age 33, 142 wRC+
- 2013: Age 34, 135 wRC+
- 2014: Age 35, 141 wRC+
I didn’t include player comps this time, but I might as well have just put (Adrian Beltre) four times. Because in terms of overall production, he hasn’t changed one bit. In fact, relative to the league average, he was a more productive hitter in 2014 with Brett Gardner power than he was in 2011 with Giancarlo power.
Which brings us to our question: What the hell? How is Adrian Beltre defying Father Time? Age is taking its toll on Beltre’s power. It’s taking its toll on Beltre’s athleticism. It might be taking its toll on Beltre’s health. So why isn’t it taking its toll on his production?
Split Beltre’s four seasons in Texas into two halves and this is what you see:
| Name | PA | AVG | OBP | SLG | ISO | BABIP | K% | BB% | HR | wRC+ |
|---|---|---|---|---|---|---|---|---|---|---|
| Adrian Beltre, 2011-12 | 1,179 | .310 | .347 | .561 | .251 | .298 | 12% | 5% | 68 | 139 |
| Adrian Beltre, 2013-14 | 1,304 | .319 | .379 | .501 | .181 | .333 | 12% | 8% | 49 | 138 |
We’ve talked about the power, and you can see it right there. A 70-point drop in ISO is a big drop! But so is a 30-point increase in on-base percentage. As Beltre has aged, he’s dealt with his declining power in the best way he can — by just getting on base.
Beltre’s walked more often. That’s the easy one. His walk rate last season was the highest its been in 14 years. He’s swinging less than ever, and, specifically, he’s chasing less than ever. Boom. Increased walk rate. It’s that easy! But a 3% increase in walks doesn’t fully explain a 30-point increase in OBP. No, that’s also got to do with what’s happening when Beltre puts the ball in play.
I think I’m more of a believer in a hitter’s BABIP being a skill than most. Last week, I wrote about Starling Marte and his quest for the perfect batted ball profile. Marte has been able to sustain an exceptionally high BABIP, and I cited his line drive rate, pop up rate, and speed as reasons why. I found that these three factors alone can explain more than 50% of a players batting average on balls in play. Beltre was never fast, and he’s only getting slower as he ages, but we’ve still got a couple places left to look to potentially explain Beltre’s 30-point boost in BABIP the last two years.
Start with the line drive rate, and you see something. Prior to Texas, 19% of Beltre’s batted balls were line drives. Those first two years in Texas, 19% of Beltre’s batted balls were line drives. These most recent two years, 22% of Beltre’s batted balls have been line drives.
Line drive rates can be subject to year-to-year fluctuation, but Beltre was one thing throughout his career, and now he’s something different. Couple that with a career-low fly ball rate, and you get the sense of a slightly altered swing. I’m not an expert on swing mechanics, so that’s just a guess, but it would be an understandable change for a guy with declining strength and bat speed — a flatter swing, aimed to spray the ball rather than an uppercut aimed to rely on the long ball.
If that is indeed the case, it’s paying off in another area, and it’s a big one. This graph should do the trick. Beltre’s rate of infield flies, since we started logging batted ball data in 2002:

Early in Beltre’s career, he popped up quite a bit. Once he hit his peak, he hovered right around the league average from 2008-12. In 2013, he dropped his infield fly rate by three percentage points, and that was the 17th-biggest improvement among qualified hitters. Then, in 2014, he dropped his infield fly rate another seven percentage points, and that was the 3rd-biggest improvement among qualified hitters. Beltre only hit four infield flies in 614 plate appearances last year. He used to hit upwards of 20 a season.
Infield flies are the equivalent of strikeouts, in that they’re essentially a guaranteed out. Not only has Beltre maintained his already-elite strikeout rate over the years, but he’s significantly dropped his “guaranteed out” rate by not popping out anymore. Take those 20 or so missing pop-ups and call them strikeouts, add them to Beltre’s 2014 and you’d get a 3% boost in strikeout rate. That’s something we’d notice. Instead, what used to be pop-ups are now regular balls in play, and as we’ve already discussed, those balls in play are now line drives more often than they’ve ever been before.
Line drives are good. Never popping out is good. Walks are good. Adrian Beltre is good. Hitters dingers is good, too, but it’s not the only way to succeed. He’s still an easy candidate for 20+ homers, but this is how Adrian Beltre continues to excel without all the power he once had. This is how Adrian Beltre continues to defy Father Time.
August used to cover the Indians for MLB and ohio.com, but now he's here and thinks writing these in the third person is weird. So you can reach me on Twitter @AugustFG_ or e-mail at august.fagerstrom@fangraphs.com.
Quit being such a hypocrite, DAD. I did the yardwork last week, I’m not doing it again this week.
No, I don’t pay rent. Do you want me to?
No, I just want you to appreciate me a little bit, you ungrateful brat!
Well, fine, dad. I appreciate you. Happy now?
It’s all I’ve ever wanted, son. As thanks, I’ll let you have another 2 seasons of 130+ wRC+. Because you’re my little guy.
I’m sorry, dad. I love you.
I love you too, son. I love you too.
[insert gif of Father Time rubbing Beltre’s head]
Father, nobody touches my head… NOBODY!
*Stabs Father Time*
I-I’ve killed him. It’s over. It’s finally over! I am now IMMORTAL!
Stephen Colbert and I will take over this world!
“But a 3% increase in walks doesn’t explain a 30-point increase in OBP.”
Wait, isn’t that EXACTLY what it explains?
Not all of it. That’s kinda what the rest of the article after that sentence is about.
Well I don’t want to nit-pick, but…. I am gonna anyway…
FG data: BB rate / OBP
2011-12: 0.052 / 0.347
2013-14: 0.082 / 0.379
delta: 0.030 / 0.032
So you are right it doesn’t explain ALL of it, only 300 / 320bps or 93%. So you’re statement that it doesn’t explain it is wrong.
Oh, I see you added “fully” in there now… I guess we are getting closer to correct.
So the point is… that it is weird that you have focused on something for “the rest of the article” while dismissing the bulk of the actual explanation (i.e., walk rate.)
But more importantly, this is a weird article… you assert that players “are no longer what they once were by age 32” yet totally ignore the fact that Beltre has had 4 of his 5 best seasons (out of 17) at 32+
Instead of trying to explain that, you focus on differences inside of this period. Further, you focus on ISO which certainly explains why 2011 was so good, but it should be noted that his 2013-14 ISO was actually in-line with his LAD and SEA ISOs (0.189 and 0.176) despite league-wide ISOs coming down, meaningfully…
Take a theoretical look. Keep in mind this is not including HBP or sac flies.
310H / 1000 AB = .310 AVG
~5% BB% = 53BB / 1053 PA
(310H + 53BB) / 1053 = .345 OBP
(I know it’s .347 for Beltre’s 2010-11 in reality b/c of HBP sac flies)
Now let’s increase the BB% to 8% while leaving the AVG the same.
310H / 1000 AB = .310 AVG
~8% BB% = 87BB / 1087 PA
(310H + 87BB) / 1088 PA = .365 OBP
As you can see, 3% increase in OBP increased the BA in the example by 0.020 (20 points). That bears out in Beltre’s numbers above, as his AVG increased 9 points (directly corresponding to an increase of 9 points on his OBP), and his increased BB% translated to about 20 points of OBP increase. From these two factors, we get about a 29 point increase in OBP (theoretically). The reality is his OBP increased 32 points.
If you can take the 3 points and be happy because you know sac flies and HBP and what not can account for that difference, great. You don’t need to read further. Seriously. The work triple to find that 3 point difference.
I decided to see what caused the 3 point difference.
We know that HBP as well as sac flies, bunts, and hits are not accounted for in AVG but are in OBP and PA. For starters, Beltre was hit by a pitch 10 times in 2011-2012 and 10 times in 2013-2014, meaning the influence there is negligible. The sample sizes for the windows are different so not non existent – 1179 vs 1304. This causes HBP% to be 0.85% in 2011-2012 and 0.77% in 2013-2014. Based on our rough estimate above (20 points OBP from 3% BB% increase – 6.67 points OBP for 1% BB% increase), this causes roughly an increase of 0.53 points of OBP.
Beltre hit 17 sac flies in 2011-2012 and 7 sac flies in 2013-2014. The higher sac flies in the earlier time frame caused his OBP to be slightly lower relative to the later time frame, as sac flies don’t count in AB’s but do in PA’s. This attributed to the 3 point discrepancy between actual and theoretical OBP increased based on BB% and AVG increases. To see the numbers:
300H / 1000 AB = .300 AVG
5% BB% assumed.
(300H + 53BB) / 1053 PA = . 3352 OBP
14 sac flies added (sample size difference means ~14 vs. 17 sac flies):
(300H + 53BB) / 1067 PA = .33083 OBP
6 sac flies added (sample size difference means ~6 vs. 7 sac flies):
(300H + 53BB) / 1059 PA = .33333 OBP
Sac flies can be shown to increase the OBP by 0.00250 (2.50 points) for Beltre’s time windows above.
Adding the difference due to sac flies to the slight difference due to HBP% being different, we come up with a 3.03 OBP point difference from one time frame to the next solely due to HBP and sacrifices. That’s really close.
That’s probably more than you wanted to know, but I like math so suck it.
For the second half of this, I used a SS of 1000 instead of the 1179 or 1304, thus the change in # of sac flies.
Here’s the thing, though — Beltre took a lot more intentional walks from 2013 to 2014 than he did from 2011 to 2012. And since August is concerned with wRC+, which doesn’t include intentional walks, the walk rate can’t account for all of the jump.
Might it also be true that Beltre’s numbers in ’14 were depressed by the lack of protection in the Texas lineup?
Depends on if you consider “protection” to be a real thing or not. I am personally leaning towards it existing and being viable. However, this idea seems to fall more so on the eye test than in numbers at times.
Hard to fly like an eagle, when you’re surounded by turkeys.
Gonna preface this by saying I’m not accusing Beltre in the slightest, this was just where my first thought went.
What traits would one look for when trying to determine which players, statistically, are possibly on steroids? Understanding all the roadblocks to assembling this data (namely, the lack of a firm list of who does/does not use steroids when), are there any very broad guides to look for? I’d have to imagine that stubbornly durable ISO is the first or second thing you’d look for.
Perhaps, but if I were trying to determine which players, statistically, are possibly on “wily veteran changes approach to extend career” foregoing power in favor of OBP is the first or second thing I’d look for.
First be sure to apply the “went from pitchers park and then worst park for RH power hitters in baseball in 20’s to great parks for RH power hitters in 30’s” filter.
Quiet you!
Don’t you know nothing in baseball happened more than 3 years ago?
You don’t determine who is on steroids by looking at their baseball stats. You do a chemical analysis of their urine samples. MLB in fact does this at least twice a year for all MLB players.
If I were a baseball player, I’d make sure to gradually suck more and more as I aged, to avoid the appearance of impropriety. Is that really too much to ask for?
How’s that HGH test coming?
LOL Hitters peak at 26.
Hank Aaron is laughing, too, at the notion that players are “no longer what they once were by age 32.”
What would be interesting generally, and especially in light of the comments on here, is how common this adjustment is. I am sure that some version of transforming fly balls into line drives is attempted by every aging hitter, but rarely to the degree of success that Beltre has enjoyed. I am willing to believe that he is an exceptional case, as he is a great player, but I am still curious about the context.
I don’t really have anything to say except that I love Adrian Beltre and when he retires two decades from now, baseball will be worse off. So, yeah…
Blah blah blah Hall-of-Famer blah blah.
We listen to what matters.
Texas isn’t a bad team. No one knows how good they will be this year, but they are not a bad team.
The Ballpark is no longer a hitter friendly place. They redid some of the areas behind home plate, and killed the jet stream. Eventually you national idiots will figure this out.
Agree on the “not a bad team” – as both a fan and a mean reversionist
On the Ballpark… not sure the data agrees with the construction narrative. FG park factors are done on a 5yr basis and the total park factor and HR park factors were both 106 in 2012 (so data from 2008-12.) Assuming they didn’t count the reconfiguration as major construction (in which case they would use data less than 5yrs long,) the current 2014 data should have 2yrs of post-jetstream impact… and it is still 106 / 106.
I think it’s possible that the Rangers’ lost a lot of power (ISO was 0.134 last 2yrs versus 0.171 the 5yrs prior) at the same time the league was losing power (similar stats to Rangers) and the narrative of the disappearing jetstream was born.
Or maybe the data will decline to a 100 park factor… who knows… but suffice it to say, the data does not yet support that the Ballpark has lost offense.
Adrian Beltre’s career is one big middle finger to the way baseball players typically age. So we shouldn’t really be surprised he’s got more tricks up his sleeve.
So who is the better third baseman? Schmidt or Beltre? If just looking at career WAR, JAWs, etc, Schmidt but oh what would have been if Beltre had not batted in Safeco for five years?
I’m a big Beltre fan, but Mike Schmidt? He was 1st or 2nd in the National League in WAR for position players 8 years in a row (with another 2nd, and 2 3rds).
Beltre in his career has one 2nd, and 3 3rds. (Each player has a 4th as well)
The guy was more affected than most by Safeco field, and I think he belongs in the top ten all-time for 3rd basemen, but Schmidt’s a bit of a stretch…