How Andrew Miller Can Return to Dominance

From 2014 to 2017, relief pitcher Andrew Miller was one of the most dominant arms to come out of a bullpen. Miller averaged 2.4 WAR during those four seasons, and in three of those four, he posted a sub-2.00 FIP. In fact, in 2016, Miller struck out nearly 50% of hitters he faced while walking just over 3%.
As we know, decline is inevitable for baseball players. Whether it’s due to playing over your head, the impact of aging, or just loss of ability, the equalizer comes for everyone at some point. By the time Miller landed with the St. Louis Cardinals in 2019, he was a little bit older and a shell of his former self. His walk rate rose to over 11%, his FIP ballooned over 5.00, and his home run rate became, to date, the highest it had ever been. Be it age or an impending decline, Miller doesn’t necessarily have to succumb to either just yet. Yes, he’ll turn 35 next May, but he might have something left in the tank.
Despite 2019 being one of the worst seasons in his career, Miller showed some flashes of returning to his mid-2010s form. During the month of July as well as the Cardinals’ October playoff run, Miller made a subtle but important adjustment to the pitch that made his career, the slider. It’s unclear if this slider adjustment was intentional, but it made a big difference in its effectiveness. If Miller can keep this particular change more consistent in 2020, the Cardinals could have one of the most dominant relievers in baseball.
Miller’s 2019 started off pretty badly. In 11.1 innings pitched during March and April, he allowed nine runs off of 11 hits (four home runs) and walked nine hitters, although he did notch 16 strikeouts. May and June saw flashes of improvement (16 IP, 7 ER, 3 BB, 22 K), but then something changed for Miller in July.
Have a look at his monthly slider metrics:
| Axis | Avg Velo | Avg RPM | HRel | VRel | Hmov | Vmov + G | Whiff/Swing | wOBA | |
|---|---|---|---|---|---|---|---|---|---|
| March/Apr | 277 | 82.9 | 2554 | 2.3 | 5.4 | 5.8 | 35.5 | 36.8% | .293 |
| May | 274 | 82.0 | 2555 | 2.3 | 5.3 | 6.3 | 36.7 | 28.6% | .273 |
| June | 272 | 82.1 | 2562 | 2.4 | 5.4 | 5.9 | 36.0 | 39.0% | .309 |
| July | 267 | 82.7 | 2639 | 2.4 | 5.4 | 5.9 | 35.5 | 47.5% | .177 |
| August | 273 | 81.7 | 2616 | 2.4 | 5.3 | 6.6 | 36.6 | 35.7% | .225 |
| September | 274 | 82.4 | 2648 | 2.5 | 5.3 | 7.0 | 36.3 | 32.8% | .348 |
| October | 267 | 82.9 | 2692 | 2.6 | 5.2 | 7.6 | 35.0 | 28.0% | .130 |
| AVG | 272 | 82.4 | 2609 | 2.4 | 5.3 | 6.4 | 35.9 | 35.5% | .251 |
There are two things that stand out in this chart; looking at his monthly slider wOBA, we see July’s .177 well below his 2019 average and in stark contrast to the previous months. His whiffs per swing jumped up almost 10% and his spin rate increased by almost 100 rpm that month. In October, during the series against the eventual World Series Champion Washington Nationals, Miller approached the elite level that once made him a star reliever.
Looking closer, note that his release points stayed the same and not a whole lot changed with the movement profile either. Have a look at Miller’s slider heatmaps from March through June, and then for the month of July, one of his two outlier months:
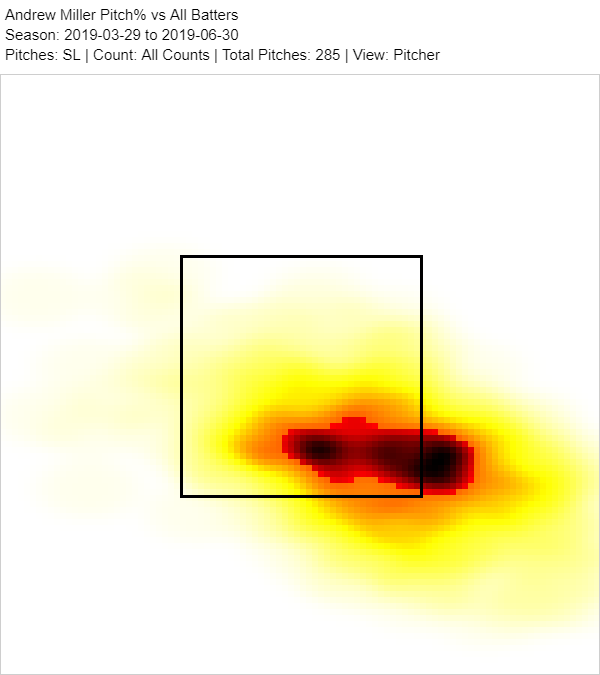
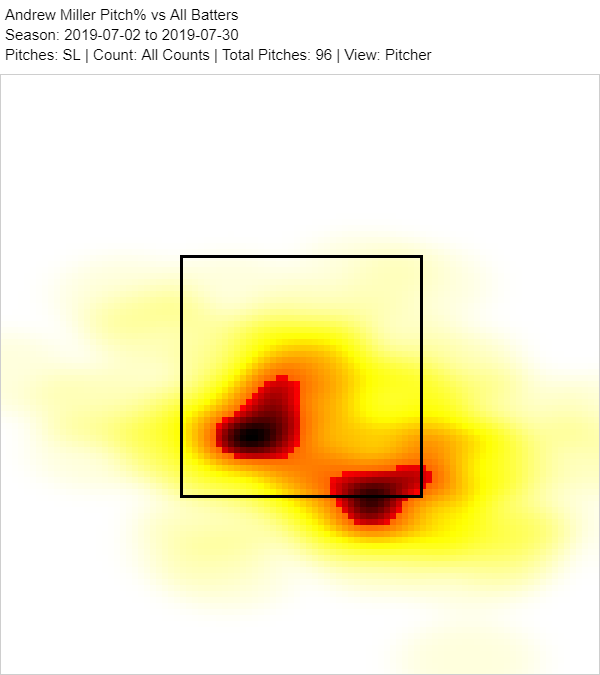
We can see from the heatmaps that Miller’s slider location didn’t change all that much, and that gap between locations in July is more likely due to a much smaller sample size. However, what we’re more concerned with is how it got there.
With that said, the most important thing to note in the chart is Miller’s month-to-month average spin axis. With the exception of July and October, clearly his most effectual months, Miller was at or above the 270 degree mark, or a spin direction of three o’clock. The data implies the axis change impact, but why does that matter? Well, let’s talk about spin axis for a minute.
Before I elaborate, any directional rotation mentioned will be coming from the pitcher’s perspective. Keep in mind that “axis” and “direction” aren’t the same; spin axis is the actual tilt of the ball when thrown, and spin direction is what way the pitch is turning during its rotation. With a 270 degree spin axis, we are looking at pure side-spin, which is much like a spinning top. Think of it this way: a pitch thrown under a 270 degree spin axis will be turning towards 3:00 on a clock (from the pitcher’s perspective).
That 3:00 spin direction creates almost pure horizontal movement with only gravity working to pull the pitch down; Magnus Force works to drag the ball to the glove side of the pitcher. Tilting the axis above 270 gives the pitch an element of top-spin which, like a fastball, will induce a bit more vertical movement. For some pitchers, that vertical movement might be good or necessary, but for others (such as Miller), it can be bad. It all comes down to the type of shape a pitcher wants to create with a particular pitch.
The problem with Miller is that his 270 degree-plus spin axis changed his pitch shape for the worse, as shown by the data in the slider chart. Below is an example of Miller’s slider shape, on an axis around 278 degrees:
Here’s one with a 265 spin axis:
The proceeding overlay demonstrates the pitch shape differences that are created:
The hop on the first gif exemplifies the additional topspin on Miller’s slider that has, according to the metrics, created issues with its effectiveness. So is it just the spin axis that is creating issues? Well, yes and no.
We understand that all pitchers have at least two pitches. Some with only two pitches in their arsenal are able to lean on one of them much more, either because of velocity or understanding its movement in conjunction with an ability to successfully locate (i.e. command). Miller has a roughly 60/40 slider to fastball split, so he needs both to be able to work off of each other in a larger capacity.
This is where tunneling comes in, which is an attack that is dependent on two (or more) correlating pitch shapes. Going back to the “hopping slider,” here’s an example of an at-bat from mid-April. Take a look at the slider to fastball sequence using the Baseball Prospectus Matchup Tool:
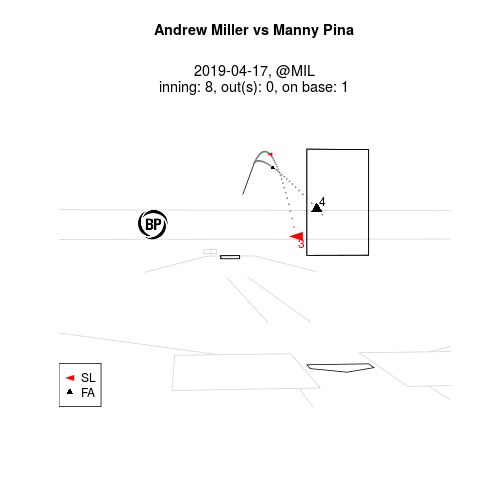
As you can see, Miller’s 270 degree-plus slider spin axis hops out the tunnel early and could be easily identified by an eagle-eyed hitter.
On the other hand, when Miller’s slider is more horizontal than vertical, it makes it much harder for the hitter to discern what is coming.
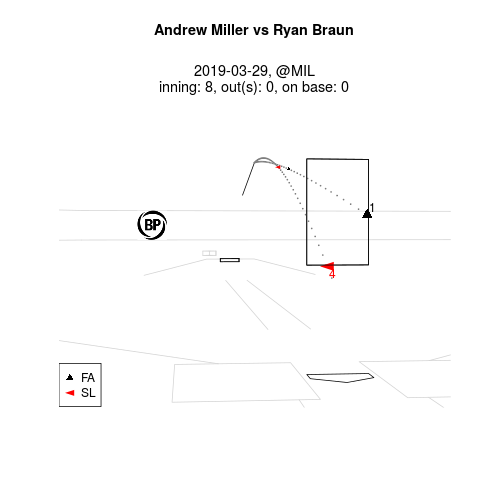
One thing I will point out in these two charts is the location differences for the four-seam fastball. In the top example, if Miller locates the four-seamer middle-away (as he did against Braun in the second example), the pitches might tunnel a bit better, but that doesn’t negate the hop of the slider, which will still be something of a giveaway to the hitter.
The beginning of Miller’s 2019 gave the appearance that his decline which started in 2018 was going to carry over and possibly get worse. Looks were not deceiving, and Miller posted a -0.4 WAR, his worst since 2011 with the Boston Red Sox. Yet the aberration of both July and October revealed the possibility that Miller could stabilize, or even improve, by creating a more biting, leveled-out slider that pairs much better with his four-seam fastball.
Miller’s work in the postseason approached his once elite level of performance. Going back to his monthly slider metrics, notice how Miller not only generated a lot more spin on the pitch, but it also created additional glove-side action that was both sharper and deeper than it was during the entire regular season. That’s the kind of slider Miller wants to create and the type that the Cardinals need from him out of the bullpen in 2020.
Pitching strategist. Driveline Baseball pitch design-certified. Systems Administrator for a high school by day, I also provide ESPN with pitching visuals and am the site manager for SB Nation's Bucs Dugout.
this is great to read. hope Miller will be dominant again as he’s fun to watch.