How Spray Angle Helped Create the Season’s Shortest Home Run

This past Tuesday’s slate of games provided us with a cluster of enjoyable home runs. Among them were Shohei Ohtani’s longest career home run (an estimated 470-foot blast); Ke’Bryan Hayes inadvertently missing first base and having his third bomb of the year overturned; and a fly ball off the bat of Carlos Correa that just (and I mean just) cleared the Green Monster.
Correa’s home run, the shortest of the season so far, was struck at a launch angle of 49 degrees and traveled an estimated 310 feet; it’s one of only four (over-the-fence) home runs hit since 2015 with a launch angle that high or higher. There have been several homers hit 310 feet or less, but the lion’s share of them have been the inside-the-park variety. Here’s the list of impressively short out-of-the-park home runs:
| Player | Date | Dist (ft) | EV (MPH) | LA (°) | xBA |
|---|---|---|---|---|---|
| Carlos Correa | 2021-06-08 | 310 | 105.5 | 49 | 0.086 |
| Andrew Benintendi | 2019-07-27 | 310 | 87.7 | 38 | 0.020 |
| Lorenzo Cain | 2017-07-29 | 302 | 90.4 | 39 | 0.013 |
| Stephen Vogt | 2019-09-18 | 307 | 105.9 | 21 | 0.927 |
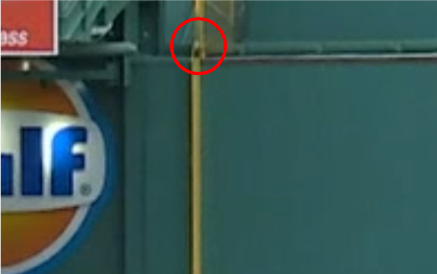
So why all the excitement about short home runs? We should be celebrating Ohtani’s long home run, right? But his blast is one of 113 home runs since 2015 with a projected distance of 470 feet or more. Correa’s home run is a rarer breed, and arguably more entertaining. These require a bit of scrutiny as they barely clear the fence; two of the four home runs listed above went under review before being ruled a home run. The screenshot below illustrates just how close Correa’s ball was to both hitting the wall and being a foul ball.
It’s highly unusual for a batted ball with such a high launch angle to not result in a fly ball out. The Statcast xBA for the home run was .086, and the league-wide batting average on balls with a launch angle greater than 45 degrees this season is .025. Even factoring in Correa’s exit velocity of 105.5 mph doesn’t help: On hard-hit balls (exit velocity greater than or equal to 95 mph) with a launch angle above 45 degrees, the league-wide batting average is actually worse at .017.
So how exactly did Correa get that ball over the fence? One thing that all four of these short home runs have in common is they were all hit in Fenway Park. Without going into too much detail (since I dug into Fenway’s relationship with home runs a few weeks ago), the stadium’s unique geometry is ripe for fringy home runs in right and left field. While it’s not considered a home run-friendly park overall, the left and right field corners are closer to home plate than any other ballpark in the majors; those balls are probably not home runs anywhere else.
What really jumps out about these home runs is that they are all right on the foul line. Again using Statcast and filtering batted balls for a launch angle and exit velocity profile similar to Correa’s home run, the distribution is as follows:
| BBE | Hits | 1B | 2B | 3B | HR |
|---|---|---|---|---|---|
| 208 | 39 | 2 | 5 | 2 | 30 |
Out of 39 hits on such balls since 2015, 30 have been home runs. If the ball remains playable, it’s likely to get caught. (Surprisingly, Correa’s home run is the only one of the 30 that was hit at Fenway.)
We can presume that the other 29 home runs were pulled down the line, but to understand by how much, we’ll need to look at a third batted ball parameter: spray angle. While not a direct measurement tracked and provided by Statcast, spray angle can be calculated based on the hit position. A spray angle value of 0 would mean a ball is hit up the middle; -45 degrees represents the left field foul line; and 45 degrees represents the right field foul line. Correa’s home run has a spray angle of exactly -45 degrees, as is the case for any home run making contact with the left field foul pole. The subset of home runs with a launch angle over 45 degrees and exit velocity over 105 mph averaged an absolute spray angle of 38 degrees; not all of these homers were pulled to the extreme, but they were pulled nonetheless.
The relationship between wOBA and batted ball position is well established. Pulling the ball tends to generate harder-hit balls and more extra-base hits. Using spray angle, we can take a more granular look at this relationship.
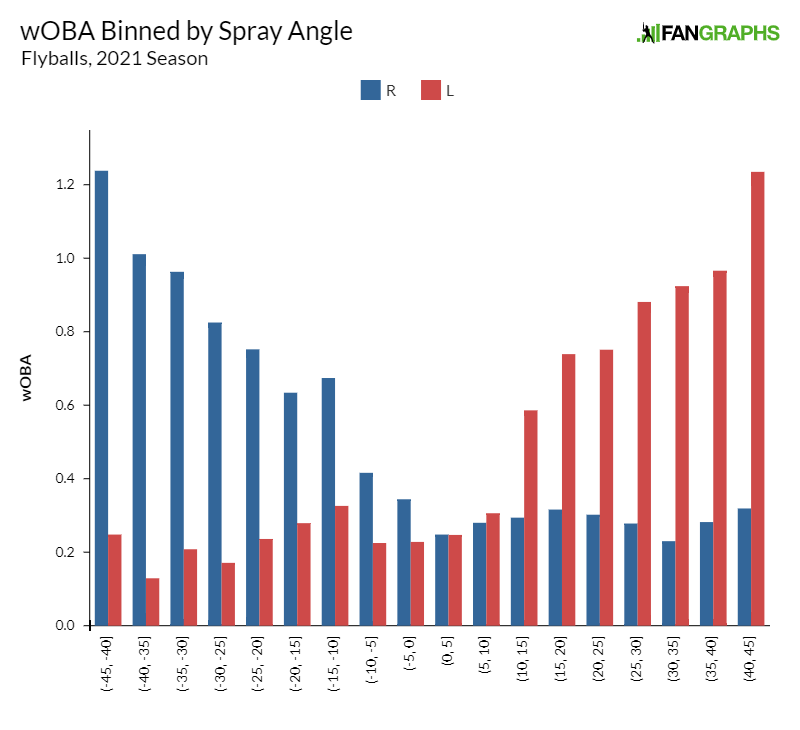
The bar chart above shows the average wOBA value separated by spray angle on fly balls so far this season. It’s clear that a batted ball’s value goes up the further toward the line that it’s pulled and plateaus once it crosses over the centerfield boundary. We can also see that there is basically a uniform relationship for opposite field hitting, with a wOBA of .288 for righties and .228 on opposite field fly balls. Correa’s home run had an extremely low xBA, but the expected values are based on only launch angle and exit velocity.
If we examine the HR/FB by batted ball location, we find that it follows a similar pattern.
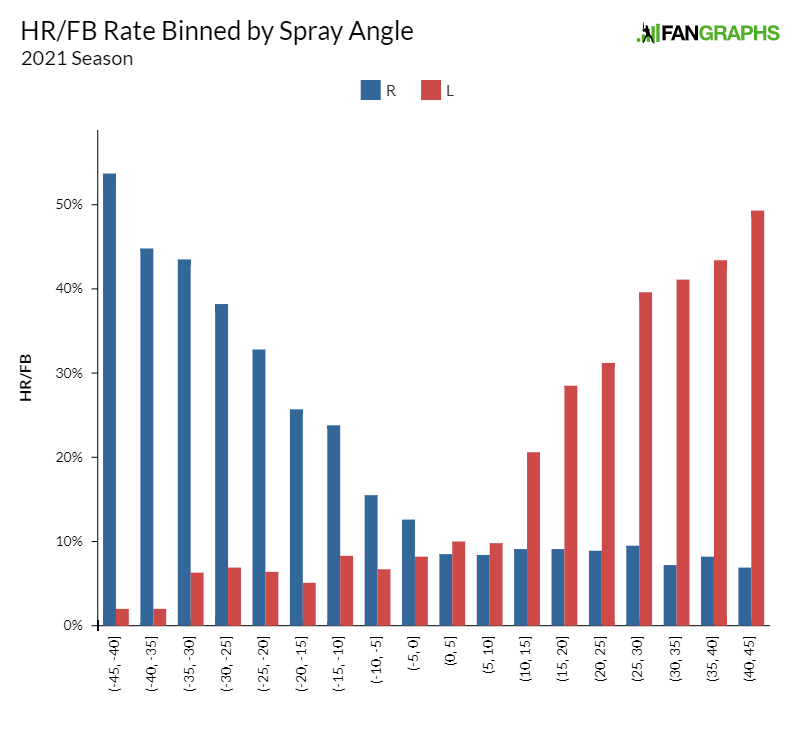
This is what you would expect given that the distance from home plate to the fence (i.e. home run boundary) is shortest at the corners and gradually runs further away from home plate working toward the center of the field. What it illustrates best, though, is the impact of the direction of the ball on home runs. Understanding the impact of spray angle, the xBA would be much higher if ball position data were also included in the expected value calculations.
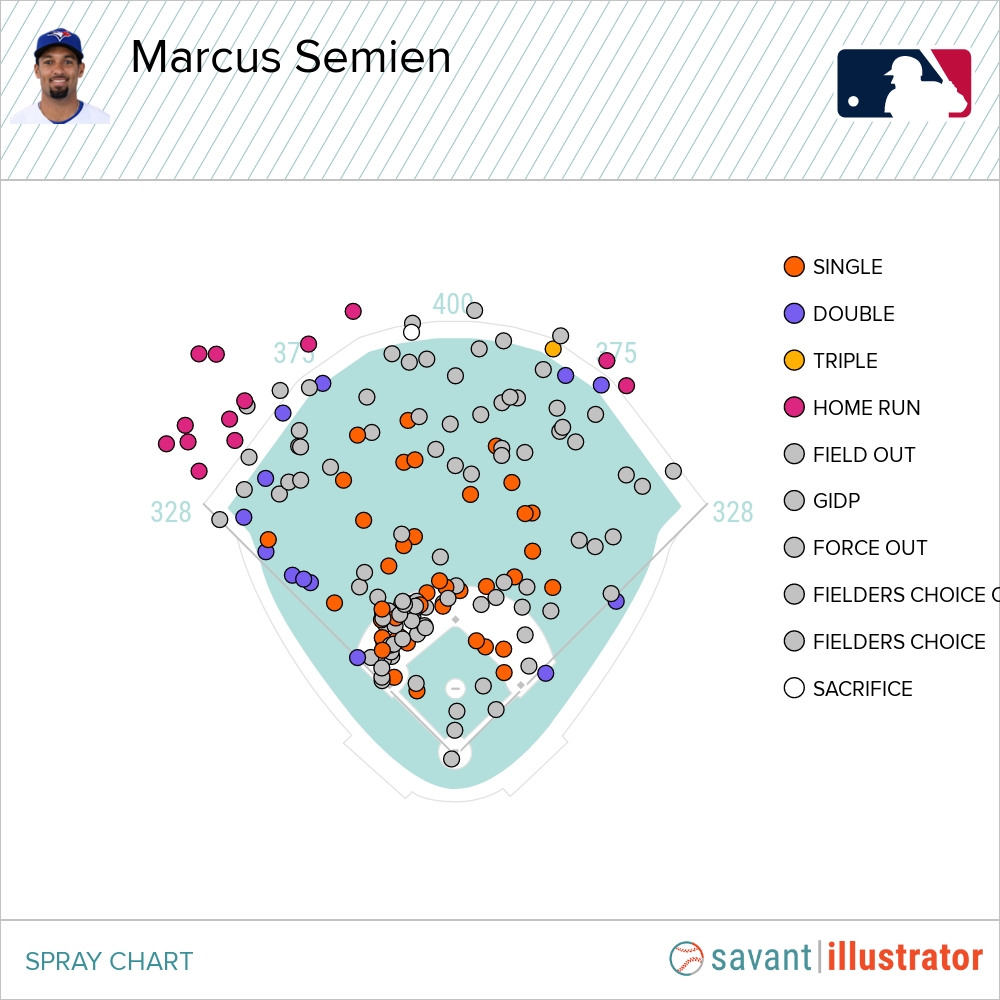
As for Correa, this one batted ball event doesn’t say anything about him in particular. With a max exit velocity in the 98th percentile, he has power to all fields, and his Pull% on the season is well below average at 32.6%. But for players who don’t have elite power, leaning on an extreme pull profile may be the best way to boost their home run potential. Case in point: Marcus Semien, who leads all right-handed hitters with nine fly balls hit with a spray angle of greater than 35 degrees. His spray chart shows his batted ball profile skews toward the pull side, with nine of his 13 home runs hit to left field.
Every hitter has unique characteristics, and pulling the ball doesn’t always result in increased performance. Another hitter among this season’s leaders in fly balls down the line is Anthony Rizzo, but his wOBA on such batted balls (.363) is far below average. Rizzo does generally pull the ball more often than league average (43.2% in ‘21), but he distributes his power more evenly across the fields, and more of his balls that have been pulled down the first base line ended up as singles rather than home runs. He’s an example of a player who bucks the trend, with a better wOBA on balls toward center field (.383) than to the pull side (.357) this season.
So is Semien now a better power hitter than Rizzo? The latter has been a much more prolific power hitter, but for the first two months of this season, the former has been mashing home runs at over twice Rizzo’s rate even though he ranks well behind Rizzo in maximum exit velocity by pulling the ball over the fence at a markedly improved rate. There are several other hitters with big jumps in their Pull% in ‘21; some have seen their HR/FB increase (Jorge Polanco and Jose Altuve), and some have seen no change (Chris Taylor and Xander Bogaerts). Perhaps some hitters seeing Correa’s sky-high home run will be tempted to follow suit.
Chet is a contributor for FanGraphs. Prior to FanGraphs, he wrote for Purple Row. When not writing about baseball, he is a data scientist and outdoor sport enthusiast. He can be found on Twitter at @cgutwein.
Jose Altuve followed Correa with a similar HR on Thursday. Not almost foul but high launch angle and I assume low exit velocity that just cleared the Monster