Introducing On-Pace Leaderboards!
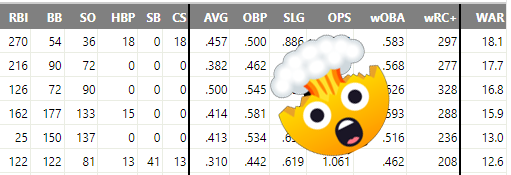
For your amusement (and your amusement only), we’ve put together two on-pace leaderboards.

As some of the season totals you’ll see there will likely make obvious, these leaderboards are a good illustration of why it isn’t great to draw conclusions from small samples.
There are two varieties of on-pace leaderboards available:
- On-Pace Every Game Played (EGP) projects future playing time as if the player will play in every single remaining game this season. For pitchers, it projects starters to pitch every 4.5 days and relievers to pitch every 2.5 days. This is calculated proportional to their current season games started to games played ratio.
- On-Pace Games Played% (GP%) projects playing time as if the player will play in the same percentage of total future team games as they’ve already played in this season. For instance, if a player has played in five of their team’s 10 total games, we would project them to play in 76 future games.
Needless to say, neither of these attempts to project future playing time is any good, but that’s fine! These aren’t intended to be smart — they’re just dumb on-pace metrics that we should all know have no basis in reality at this point in the season.
If you are interested in forecasting what a player’s actual end of season stats might be, I suggest taking a look at either the Steamer (Update) or ZiPS (Update) projections. These projections add together a player’s existing stats and Rest of Season (RoS) projections for a much more realistic look at what a player’s end of season stats might actually be.
Enjoy!
David Appelman is the creator of FanGraphs.
Excellent addition! Please make sure to add these two selections to the “Projections” hover menu at the top of the page.
I Sooooo disagree. These are a waste of Fangraphs. Big Time waste.
Robert was positively delighted when NotGraphs went by the wayside…
Note that these are not predictions. They represent player statistics for the rest of the season if they play in all remaining matches *. It’s really not how the player will behave until the end of the season and should not be used for anything but your personal entertainment.
*Beginners throw every 4.5 days, and lighter ones throw every 2.5 days.
Big Time Waste!?! These were probably trivial to add relative to the rest of the stuff this site offers.