Introducing NOLA: A Metric for Starting Pitcher Consistency
Aaron Nola is having a truly awful season: Through nine starts, he’s 1-7 with a 6.16 ERA, which is bad for any pitcher. For the putative no. 2 starter on a big-market team whose fans are getting pretty tetchy about not having won a World Series in a while, it’s disastrous. Especially when said pitcher is in year two of a seven-year, $172 million contract. In fact, you’d have to say Nola has been surpassed in the pecking order by Cristopher Sánchez at the very least, and possibly by newcomer Jesús Luzardo.
Everyone’s got their theories as to what’s gone wrong. Davy Andrews tried to figure out Nola’s deal last month. Timothy Jackson of Baseball Prospectus speculated earlier this week that there’s something off with his fastball, and that lefty-heavy opposing lineups might be to blame. The Phillies, for their part, just put Nola on the (non-COVID) IL for the first time in almost eight years. The stated reason is an ankle injury Nola says is messing up his mechanics, but a player in a slump this bad can almost always use some time off to clear his head as well.
It’s a shocking development. Nola is one of the most durable, reliable pitchers in the game, and has been for almost a decade. Since the end of that last IL stint in May 2017, Nola has made more starts and thrown more innings than any pitcher in baseball. He’s third in WAR, a tenth of a win behind Gerrit Cole. I don’t think Nola has been in the conversation for best pitcher in the league at any point, but he has received at least one Cy Young vote in four of the past seven seasons. To see him go in the tank like this is, well, it’s shocking.
Unless you’re a Phillies fan. I’ll speak in generalities here; “Phillies fans” as a class of people include millions of Mikes and Nicks and Lauras and Danas, from Allentown to Atlantic City. Outgoing, outspoken folks, fueled by Yuengling and Wawa coffee and processed meats in vast quantities. These are my people, and I love them, and they contain multitudes. But generally speaking, Aaron Nola isn’t their favorite pitcher.
The reasons are numerous. He’s soft-spoken and has big, sad eyes, a combination that’s doomed athletes in every sport across the world. His style of pitching involves dangling curveballs and two-seamers right around the edges of the strike zone; when it works, it’s surgical. When it doesn’t, it’s unbelievably frustrating. No one wants to watch an All-Star pitcher nibble.
He’s also merely a very good pitcher on a team with one of the best pitchers in the league, traditionally a highly uncomfortable place for a Phillies hurler; being the World Series MVP didn’t save Cole Hamels from similar derision 15 years ago. It took the retirements of Cliff Lee and Roy Halladay for “Hollywood” to become an entirely complimentary nickname.
Baseball fans are free to like or dislike players for any reason. Everyone is full of irrational opinions, and far be it from me to judge others for theirs. Our bespoke individual haterism is what makes us human.
But I admit, I get annoyed when people say, “Aaron Nola stinks,” when what they mean is, “Aaron Nola has a stupid face and I don’t like looking at it.” Because he doesn’t stink. Or, at least, he didn’t stink until eight weeks ago. This is a verified empirical fact, or as near as we get to one after 150 years of baseball analysis. Saying otherwise is mistaken at best, mendacious at worst.
Over the weekend, I was yelling something to this effect into the void, when Philadelphia sports luminary Andrew Unterberger made an interesting point. For those of you who haven’t been on Philly sports social media for 15 years, AU is an editor at Billboard by day and a writer for The Rights to Ricky Sanchez by night. Writing about the Sixers for the past decade makes him a leading expert in rooting for frustrating athletes.
Anyway, AU said this: “Is there an easy way to track high variance in pitcher starts? Anecdotally it feels like Nola has a lot of gems and a lot of blowups and not many of the just-barely-quality starts that at least tend to give you a baseline of confidence in a pitcher, but that might not be stat-supported at all.”
That’s a great question. I mean, the answer to the “Is there an easy way…” part of it is, “No.” But this is a critique of Nola that’s founded in emotion but nevertheless empirically testable. In other words, it had my name all over it.
AU’s assessment of Nola’s inconsistency did track with my own gut feeling. Nola can go from unhittable to a blowup on a start-to-start, or even an inning-to-inning, basis. Nola allowed nine earned runs and 12 hits in his last start before he went on the IL, but just two and a half weeks before, he’d gone seven innings and allowed one run. The start after that, he struck out eight over six scoreless innings. Those two starts cut Nola’s in-season ERA by nearly two runs, but in less than four innings, his May 14 blowup shot his ERA back into the 6.00s.
Surely there was a way to quantify this, to create a stat that measured pitcher inconsistency start by start. I could even name this new metric after the player who inspired it, like SEAGER or PECOTA. NOLA: Normalized… Observed… Level of Anxiety? I’ll work on the backronym.
The first thing I needed was a simple number that placed a value on each start: Game score, in other words. Bill James created game score back in the early days of sabermetrics for just this purpose, and as you’d expect from a metric that had to be calculated by hand, it’s incredibly simple. A starting pitcher starts a game with 50 points. He gains points for doing good things (recording outs, especially strikeouts), and loses them for doing bad things (allowing hits, walks, and runs).
There are two formulas in use: James’ original recipe, and Tom Tango’s 2014 update. Baseball Reference, which has the game-by-game logs required for this project, uses James’ version.
Is it a perfectly scientific measure of how well a pitcher performed? Of course not. But it’s easy to understand and readily available. Besides, this is ultimately about tracking player performance over dozens or hundreds of starts, for the purpose of putting a number on an emotional response. If the inputs are a little fuzzy, I’ll live.
Game score is great for putting in a line chart to compare two pitchers. Nola is one of three pitchers with at least 150 starts since 2020, and one of two with exactly 150 starts. So here’s how his game score matches up against José Berríos’ game score start by start. What can you tell by looking at this graph?
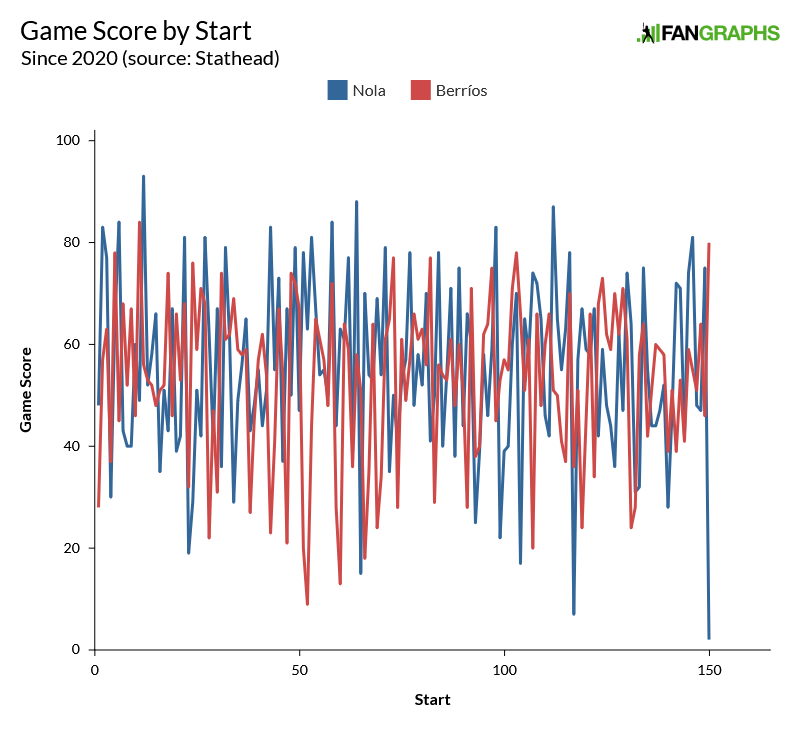
That’s right, nothing. It’s gobbledygook. I want a number to hang my hat on, not the visualizer from Windows Media Player.
A Stathead search gave me the full list of individual starting pitcher performances between Opening Day 2020 and this past Monday night. There were 22,652 individual starts, made by 833 different pitchers, each one with a game score. That means each of those 833 starters has a population of game scores, each with a mean and a median and all that stuff you learned in middle school math.
Generally, the higher the average game score, the better the pitcher. The more variance between game scores, the less consistent the pitcher. Now, that population of 833 starters included a couple hundred openers and one-start wonders. The pitcher with the second-highest average game score since 2020 is actually Nola’s temporary replacement, Mick Abel, who struck out nine over six scoreless innings in his major league debut on Sunday. No. 1 is Easton McGee, whom I’d never heard of. But apparently he made one start for the Mariners in 2023, allowed one hit over 6 2/3 innings, and didn’t pitch in the majors again until he threw a hilariously timed inning of relief for the Brewers literally yesterday.
After setting minimums of 20 starts and three innings pitched per start, the list of top 15 average game scores since 2020 is just a list of good pitchers:
| Name | Mean GS | Median GS | Starts | ERA- | FIP- |
|---|---|---|---|---|---|
| Trevor Bauer | 65.5 | 65.5 | 28 | 52 | 81 |
| Jacob deGrom | 65.0 | 67 | 56 | 53 | 50 |
| Paul Skenes | 63.1 | 62 | 33 | 50 | 63 |
| Brandon Woodruff | 60.6 | 62 | 81 | 66 | 74 |
| Zack Wheeler | 60.1 | 62 | 143 | 69 | 69 |
| Shohei Ohtani | 59.9 | 61 | 76 | 70 | 76 |
| Corbin Burnes | 59.9 | 61 | 142 | 69 | 74 |
| Gerrit Cole | 59.9 | 62 | 125 | 76 | 78 |
| Shane Bieber | 59.7 | 62 | 82 | 71 | 72 |
| Max Scherzer | 59.6 | 61 | 102 | 73 | 80 |
| Tyler Glasnow | 59.5 | 62 | 75 | 83 | 75 |
| Spencer Strider | 58.9 | 61 | 55 | 83 | 63 |
| Kodai Senga | 58.8 | 58 | 39 | 63 | 81 |
| Max Fried | 58.5 | 60 | 122 | 64 | 75 |
| Yoshinobu Yamamoto | 58.3 | 58 | 27 | 66 | 68 |
Bauer tops this list because about half of his major league experience since 2020 came during his Cy Young season; everyone else has had to deal with aging and injuries, to a greater or lesser extent. Except Skenes, who’s only played the equivalent of one full season in the majors.
If you wanted to look at the variance between the pitcher’s best and worst games, Nola is sixth out of 833. His best game of the 2020s had a game score of 93; his worst, a game score of two. I don’t love using that as a hard-and-fast measure of volatility, because any good or bad game is necessarily an outlier. If I’d run that query a year ago, Nola’s game score range would’ve been 79, not 91. The current leader in game score range is Tanner Houck at 100; six weeks ago, his game score range was 75, which would’ve been tied with Berríos and several others for 78th.
Relying on extreme outliers is just a little too crude for my NOLA metric. (Number Of Life-Sucking… Afternoons? Feels like I’m moving in the wrong direction here.)
The number I need is clearly standard deviation. Which sounds like a fancy math thing, but it’s a pretty foundational statistical descriptor. Two data sets can have the same average but different contents; standard deviation describes how much variance exists within the set. The higher the number, the more variation.
With the 20-start and three-inning-per-start minimums, the population of starters shrinks from 833 to 314. I calculated the standard deviation of game score for all 314 pitchers, and this is what I got:
| Name | Mean GS | Median GS | Standard Deviation | Starts | ERA- | FIP- |
|---|---|---|---|---|---|---|
| Joey Estes | 45.8 | 49.5 | 19.7 | 28 | 148 | 140 |
| Carlos Martinez | 42.3 | 40 | 19.7 | 21 | 167 | 123 |
| J.A. Happ | 47.4 | 50 | 18.9 | 39 | 123 | 117 |
| Gavin Stone | 49.4 | 49 | 18.7 | 29 | 110 | 102 |
| Spencer Arrighetti | 50.8 | 49.5 | 18.4 | 30 | 118 | 104 |
| Adam Wainwright | 51.6 | 52 | 18.3 | 95 | 98 | 100 |
| Germán Márquez | 49.1 | 50.5 | 18.3 | 90 | 103 | 96 |
| Josh Fleming | 43.7 | 44 | 18.3 | 25 | 140 | 121 |
| Joey Wentz | 42.5 | 44.5 | 18.2 | 26 | 152 | 127 |
| Sandy Alcantara | 56.8 | 57 | 18.2 | 109 | 80 | 85 |
| Bowden Francis | 54.8 | 56 | 18.0 | 22 | 100 | 125 |
| Lucas Giolito | 52.9 | 55 | 17.9 | 110 | 105 | 99 |
| Mike Foltynewicz | 46.4 | 52 | 17.8 | 25 | 133 | 147 |
| Kenta Maeda | 50.9 | 55 | 17.7 | 69 | 113 | 99 |
| Anthony DeSclafani | 50.8 | 51 | 17.7 | 61 | 101 | 100 |
I wouldn’t call these pitchers frustrating in the sense I’m trying to capture with NOLA. (Numerical Output of statisticaL Aberration?) Márquez and Giolito have been, for sure. But mostly, these guys all got old within the sample, or lost their fastball, or just plain stunk to begin with.
Bad pitchers aren’t frustrating. You know they’re bad going in, so if they shove one start and get torched the next, that’s kind of just the price of doing business. Before I set the playing time minimums, one pitcher who showed up near the top of my leaderboards was Tyler Phillips, another Phillies right-hander. Last year, Phillips threw six scoreless innings in his third career start, then threw a complete-game shutout in his fourth career start. The start after that, he gave up eight runs in 1 2/3 innings, and was back in the minors within two weeks.
The fans didn’t rag on Phillips the way they do Nola, because they didn’t expect much from him. This was a 26-year-old rookie, a 16th-round pick, who’d been picked up on waivers. Not a first-round pick and Cy Young finalist on a nine-figure contract. So there has to be some acknowledgement of pitcher quality baked into NOLA. (Normal Outcome Likelihood Assessment?)
Moreover, just tossing a standard deviation out there isn’t very intuitive. Part of the appeal of game score is that it starts at 50, with a maximum around 100 and a minimum around zero. (It’s possible to go outside those bounds, but anything over 100 or below zero is extremely rare.) The standard deviation of game score, meanwhile, goes from 8.7 to 19.7… great, what the heck does that mean?
So I tinkered and bodged and tried to scale the results to 100, like OPS+ or ERA-, but couldn’t because I had some negative numbers and some positive numbers. After some trial and error, I ended up with the final version of NOLA: Normalized Outlier Likelihood Above average. Here’s the formula:
(Pitcher game score standard deviation – median game score standard deviation for all pitchers) – (0.1*|100 – pitcher ERA-|)
Subtracting the absolute value of 100 minus the pitcher’s ERA- reflects the real-world reality that good pitchers are less frustrating because they pitch well, and bad pitchers are less frustrating because they come in with low expectations. The most nerve-racking starters are those with average overall stats, but you don’t know going into a start what you’re going to get.
And in order to make things more intuitive, I added the median outcome across all pitchers, so a NOLA of zero would be league average. A starter with a positive NOLA is more consistent; a starter with a negative NOLA is less consistent.
So without any further preamble, here are the 10 highest NOLAs of the 2020s:
| Name | NOLA | Mean GS | GS SD | Starts | ERA- | FIP- |
|---|---|---|---|---|---|---|
| Adam Wainwright | 4.54 | 51.62 | 18.33 | 95 | 98 | 100 |
| Germán Márquez | 4.39 | 49.14 | 18.29 | 90 | 103 | 96 |
| Bowden Francis | 4.34 | 54.77 | 18.00 | 22 | 100 | 125 |
| Gavin Stone | 4.09 | 49.41 | 18.69 | 29 | 110 | 102 |
| Anthony DeSclafani | 4.01 | 50.77 | 17.72 | 61 | 101 | 100 |
| Lucas Giolito | 3.77 | 52.87 | 17.86 | 110 | 105 | 99 |
| Eric Lauer | 3.24 | 51.41 | 16.87 | 61 | 100 | 114 |
| Luis Severino | 3.20 | 51.58 | 17.40 | 78 | 106 | 106 |
| Aaron Nola | 3.19 | 55.25 | 17.28 | 150 | 95 | 83 |
| Bryce Miller | 3.15 | 54.45 | 17.19 | 64 | 96 | 94 |
And look, there’s a familiar name at no. 9. This is definitely a list of pitchers who’ll make you want to tear your hair out. If you flip the chart upside down and look at the lowest NOLAs, unfortunately, the least volatile pitchers are either not very good or haven’t pitched much in the relevant time period:
| Name | NOLA | Mean GS | GS SD | Starts | ERA- | FIP- |
|---|---|---|---|---|---|---|
| Spencer Howard | -8.24 | 41.97 | 12.37 | 32 | 170 | 138 |
| Michael Soroka | -8.06 | 44.77 | 9.87 | 22 | 143 | 139 |
| Paul Skenes | -7.93 | 63.12 | 10.68 | 33 | 50 | 63 |
| Trevor Bauer | -6.41 | 65.46 | 11.97 | 28 | 52 | 81 |
| Drew Hutchison | -6.32 | 45.40 | 8.74 | 20 | 114 | 131 |
| Jacob deGrom | -5.92 | 65.04 | 12.41 | 56 | 53 | 50 |
| Joan Adon | -5.86 | 42.12 | 13.62 | 26 | 159 | 117 |
| Taylor Hearn | -5.82 | 44.33 | 12.65 | 24 | 148 | 118 |
| Mitch White | -5.24 | 45.82 | 12.29 | 22 | 139 | 102 |
| Michael Grove | -5.19 | 44.35 | 12.88 | 20 | 145 | 116 |
Skenes’ high placement here (or low placement, considering that NOLA is not exactly a stat you want a lot of) speaks not only to the brevity of his career to date, but to how metronomic he’s been. It’s not especially uncommon for a young starter to come up with bonkers stuff, but the thing that makes Skenes special is he performs every time out.
Just for fun, let’s end by restricting the sample even further, to a minimum of 40 starts and a maximum ERA- of 95. So not just the most consistent starters, but the most consistent good starters:
| Name | NOLA | Mean GS | GS SD | Starts | ERA- | FIP- |
|---|---|---|---|---|---|---|
| Jacob deGrom | -5.92 | 65.04 | 12.41 | 56 | 53 | 50 |
| Reynaldo López | -3.98 | 54.45 | 12.59 | 44 | 71 | 93 |
| Shane McClanahan | -3.65 | 57.43 | 12.38 | 74 | 76 | 83 |
| Javier Assad | -3.56 | 51.64 | 11.52 | 47 | 85 | 116 |
| Jeffrey Springs | -3.33 | 55.60 | 12.76 | 45 | 75 | 88 |
| Brandon Woodruff | -3.24 | 60.62 | 13.83 | 81 | 66 | 74 |
| Drew Rasmussen | -3.20 | 56.00 | 13.38 | 59 | 70 | 80 |
| Tony Gonsolin | -2.83 | 55.88 | 13.14 | 69 | 76 | 94 |
| Max Fried | -2.69 | 58.48 | 14.56 | 122 | 64 | 75 |
| Ryan Pepiot | -2.64 | 54.09 | 11.65 | 46 | 93 | 109 |
If you can remember back to the early 2020s, you probably won’t be surprised to see deGrom blow the field away here. Kodai Senga would’ve placed second if I’d set the cutoff at 39 starts instead of 40. As a member of the Javier Assad Fan Club, I’m pleased, if a little surprised, to see his name on this list, even if his triple-digit FIP- suggests he might not stay there for long.
The most interesting name here is Fried, at least to me. I’d always thought of him and Nola as very closely related. They were NL East rivals for a long time, both strong no. 2 starters overshadowed by a flashier ace (Wheeler in Nola’s case, Spencer Strider in Fried’s), both finesse-and-command starters with deep repertoires and a big curveball. They’re about the same age, with a similar body type and similar laconic demeanor on the mound. They’ve even both faced questions about the presence of the proverbial That Dog In Him, despite plenty of postseason experience. They were also both the no. 7 pick in the draft, if you want to do the full Kennedy-had-a-secretary-named-Lincoln.
And yet Nola is one of the most volatile top-end starters in the game, while Fried is among the least volatile. Nola has higher highs; he has 42 career starts with a game score of 75 or better and 16 with a game score of 80 or better. Fried has just 18 career starts with a game score of 75 or better and eight with a game score in the 80s. But Fried has just two game scores under 20 on his ledger, to seven for Nola. Fried’s career low game score is 15; Nola’s gone under that three times, including two starts in single digits.
(Avoiding disaster is also a key for Pepiot, who in 46 career starts has never posted a game score over 78, but also — somehow; I barely believe this even with the numbers in front of me — has never gone under 33.)
Both pitchers signed similar free agent contracts in the past two offseasons: Fried for eight years at $27.25 million per; Nola for seven years, with an AAV of $24.57. Even considering the possibility that Nola took a hometown discount, or that there was inflation between the 2023 offseason and the 2024 offseason, that does indicate that Fried’s consistency is more valuable on the open market than a pitcher with higher peaks and lower troughs.
Ironically, valuing volume and consistency over sparks is exactly the argument I’ve been making to Phillies fans who have, at one time or another, preferred the so-chill-he’s-barely-alive Ranger Suárez to Nola. (There was even a short-lived Spencer Turnbull-over-Nola coalition last season.)
In other words, I need to calm down. I remain sure that Nola will fix his ankle or his fastball or whatever’s ailing him, and return to the level he’s pitched at since 2017. You can’t convince me he’s bad. But if you want to make the argument that he’s annoying, that he’s frustrating to watch, not only is that your inalienable right as a baseball fan, there’s now empirical evidence to support you.
Michael is a writer at FanGraphs. Previously, he was a staff writer at The Ringer and D1Baseball, and his work has appeared at Grantland, Baseball Prospectus, The Atlantic, ESPN.com, and various ill-remembered Phillies blogs. Follow him on Twitter, if you must, @MichaelBaumann.
This is really awesome, Michael. Would it make sense to somehow measure the variance on an in-season basis? I know it’s limiting our sample size to 33 starts at the maximum, but as you noted, most of the higher variance guys are just dudes who got old. That’s not exactly the same thing. Perhaps rolling 40- or 50-start bands? Just spit-balling here.