It Is Time for Mike Trout To Be Less Patient
Folks, it brings me no pleasure to report that Mike Trout is broken.

Okay, I’m kidding. He’s still great at baseball. He owns a 138 wRC+ with 10 homers and a .309 ISO that is right in line with where he’s sat the last few seasons. Trout’s power output, specifically since the birth of his first child on July 30, has been the subject of many comments about his new “Dad Strength.” But when you hear people describe what it’s like to become a parent, you usually don’t encounter them saying they can suddenly knock the snot out of a baseball. They describe gaining other virtues, such as patience. In baseball, one can display patience by drawing walks. If we truly wished to go to the silly trouble of speculating on what a milestone in one’s personal life could do for their on-field abilities, the idea of a hitter being more relaxed in the batter’s box after he has been made wise and humble by fatherhood seems like a natural step to take.
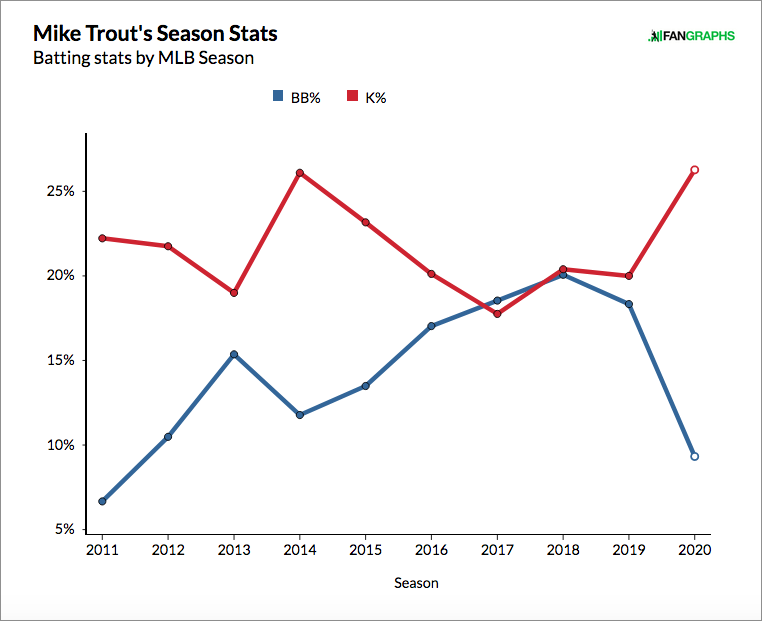
That brings us to the above graph. It’s weird, right? Of all the flukey small-sample stuff that can show up in the first few weeks of a season, you’d expect walk and strikeout numbers to begin sorting themselves out by the time a player accumulates 126 plate appearances. The Angels are halfway through their 2020 season and Trout is walking half as often as he did just one year ago while striking out more than he has since 2014. For someone who has a reputation for getting better every year, that’s a surprising development. Changes like these can be the result of a breakdown in plate vision and bat control, but fortunately for Trout, that doesn’t seem to be the case.

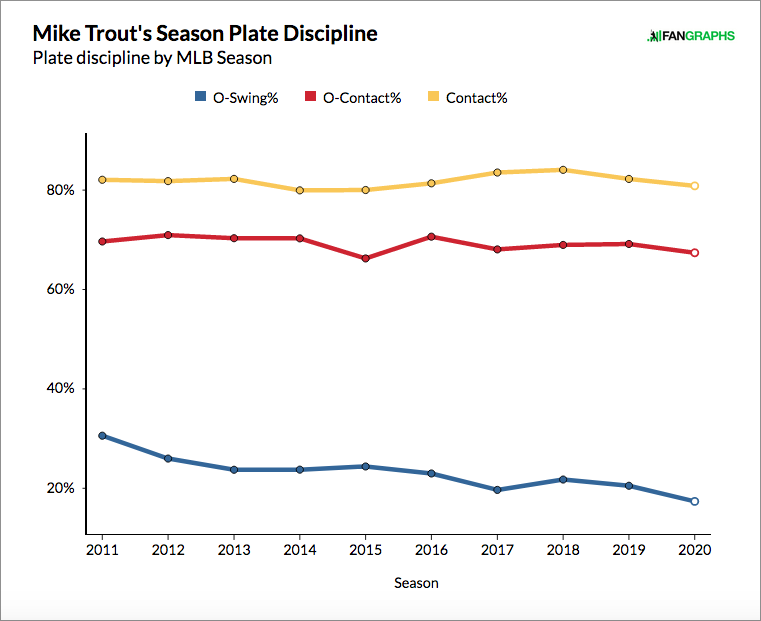
Trout’s chase rate? Lower than ever. His contact rate? Just a point under his career average. Trout has the same swing behavior he always has, which means he should be getting similar results. Since that’s obviously not the case, the next logical step is to examine pitcher behavior.

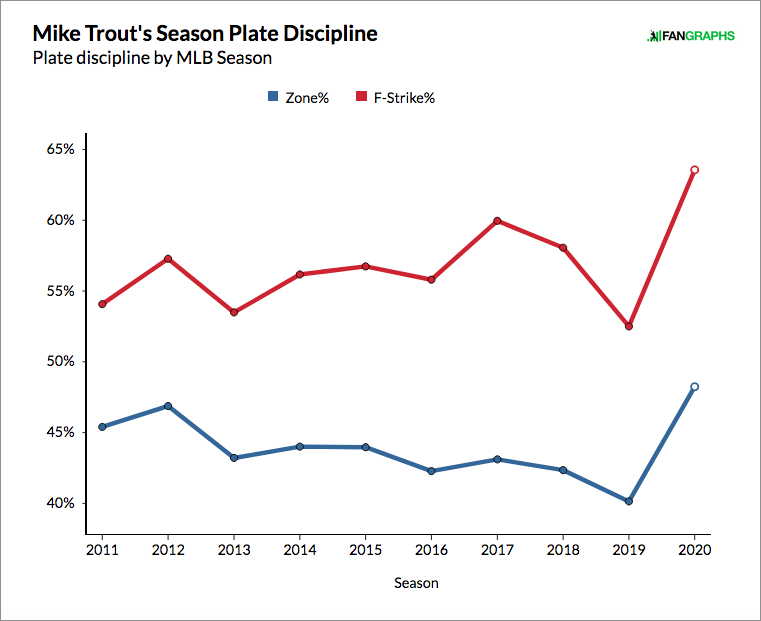
I’d say we have something here. In 2020, Trout is seeing more pitches in the strike zone than any other qualified hitter in baseball. This comes after years of him fitting squarely in the back half of baseball in terms of zone rate, seeing more or less the same number of strikes every year. In fact, the jump he’s seen in zone rate is the largest of any player to log 50 plate appearances this season (all numbers here are through Monday).
| Name | 2019 Zone% | 2020 Zone% | Difference |
|---|---|---|---|
| Mike Trout | 40.1% | 48.2% | 8.1% |
| Jarrod Dyson | 43.1% | 51.0% | 7.9% |
| Dexter Fowler | 39.7% | 47.3% | 7.5% |
| Enrique Hernández | 40.0% | 47.3% | 7.3% |
| José Iglesias | 40.6% | 47.5% | 6.9% |
| Corey Seager | 41.9% | 47.8% | 6.0% |
| Shohei Ohtani | 39.6% | 45.0% | 5.4% |
| David Dahl | 40.1% | 45.2% | 5.1% |
| Amed Rosario | 40.3% | 45.4% | 5.1% |
| Eduardo Escobar | 38.6% | 43.3% | 4.7% |
That’s a rather broad assortment of hitters. Behind Trout are slap-hitters like Dyson and real thumpers like Seager, guys in stacked lineups and weak offenses. It’s notable, however, how some of the other players here have adjusted their respective approaches in response to the aggressiveness of the pitchers they’re facing. Seager, for example, has raised his swing rate by nearly eight points and is having the best offensive season of his career. Each of the three players ranked directly behind Trout have also raised their swing rates. Trout’s swing rate, meanwhile, has actually gone down.
That’s how pitchers get away with pouring in strikes — Trout takes a lot of them. His in-zone swing rate this season is just 57.5%, the 12th-lowest in baseball. He’s particularly passive early in counts — since the start of 2019, only five hitters have swung on a lower percentage of first pitches.
| Name | FP Swings | PAs | FP Swing% |
|---|---|---|---|
| David Fletcher | 69 | 795 | 8.7% |
| Eric Sogard | 70 | 523 | 13.4% |
| Xander Bogaerts | 112 | 806 | 13.9% |
| Brett Gardner | 88 | 616 | 14.3% |
| Albert Pujols | 94 | 625 | 15.0% |
| Mike Trout | 110 | 718 | 15.3% |
| Joe Panik | 84 | 537 | 15.6% |
| Austin Meadows | 107 | 671 | 16.0% |
| Jose Ramirez | 112 | 673 | 16.6% |
| Alex Bregman | 132 | 797 | 16.6% |
This approach has worked for Trout in the past, but as evidenced by the first-pitch strike jump indicated earlier, pitchers may be using it against him now. After all, it isn’t as if Trout has always taken the first pitch simply because they weren’t good offerings. The last time I wrote about Trout, I covered the interesting way in which he stood out on Baseball Savant’s new Swing/Take leaderboard, which examines how many runs a hitter or pitcher credited or debited his team by taking or swinging at a pitch in what Statcast outlines as the heart, shadow, chase, and waste zones in and around home plate. Trout’s production on pitches in the “shadow” of the plate led his peers by a wide margin, while he was the 14th-most productive hitter on “chase” pitches and 19th-most productive on “waste” pitches. On pitches over the heart of the plate, however, Trout was worth -3 runs — 375th in baseball — largely due to the fact that his swing rate against those pitches was just 66%, seven points lower than league average.
If hitters are going to let you steal strikes down the heart of the plate, pitchers are going to pounce on that opportunity — even if the guy at the plate is the best player in baseball.
| Name | Heart Pitches | Total Pitches | Heart% |
|---|---|---|---|
| Garrett Hampson | 119 | 350 | 34.0% |
| Jake Cronenworth | 108 | 331 | 32.6% |
| Ender Inciarte | 99 | 312 | 31.7% |
| Mike Trout | 160 | 512 | 31.3% |
| J.T. Realmuto | 109 | 352 | 31.0% |
| J.P. Crawford | 155 | 501 | 30.9% |
| Danny Mendick | 95 | 314 | 30.3% |
| David Fletcher | 168 | 655 | 30.3% |
| Charlie Blackmon | 134 | 443 | 30.2% |
| Shogo Akiyama | 99 | 329 | 30.1% |
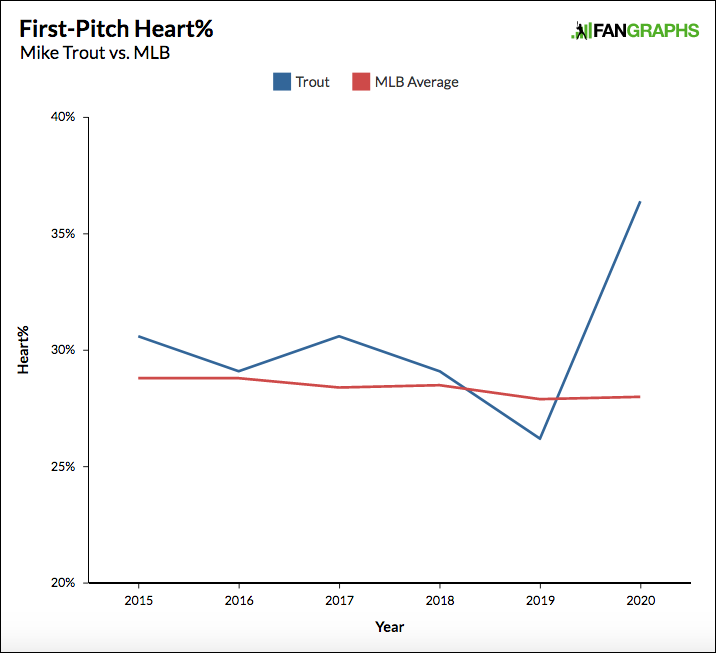
A year ago, just 24.3% of the pitches Trout saw were in the heart of the plate. This season, that number has climbed by seven points. On the first pitch of any given plate appearance, Trout is now seeing a far greater percentage of obvious strikes than the average hitter.

In a vacuum, Trout’s 2020 season isn’t necessarily all that strange. Joining him on the above table of players seeing the highest percentage of pitches over the heart of the plate were good hitters like J.T. Realmuto and Charlie Blackmon. The top 10 hitters in zone rate this season include Seager and Mookie Betts. Trout isn’t getting pitched to all that differently than a few of the game’s other top-tier hitters, in part because many of the game’s best hitters are roughly as patient at the plate as he is, which means pitchers need to come into the zone more often to keep the at-bat from getting away from them.
What’s so striking about Trout’s season is the sudden, dramatic difference in the way pitchers are attacking him. It isn’t as though he was a hotshot rookie last year who’s experiencing the league adjusting to him for the first time. He’s been the best player in baseball for nearly a decade, and throughout that time, he’s shown a very consistent approach — always possessing one of the lowest swing rates in the game, particularly on pitches inside the strike zone.
This is who Trout has always been, yet pitchers had never really changed the number of strikes they’ve thrown him. Now that’s changed, and the early returns indicate there’s little reason for pitchers to turn back until Trout forces them to. He should have no problem doing that given the stability he’s maintained with his eye for the zone as well as the pop in his bat. It’s just going to require a greater willingness to seek out early mistakes in the middle of the plate.
Trout’s ability to produce elite walk rates in the past without also accumulating a lot of strikeouts is part of what has pushed his overall production above every other power hitter in the game. Those plate discipline numbers have been turned on their head this year, and as counter-intuitive as it sounds, patience isn’t the solution to that problem — it’s the cause of it. Before this season, the fear of Trout’s bat was enough to nudge pitchers out of the zone. That fear has subsided. It might be time for him to remind everyone what made them so afraid to begin with.
Tony is a contributor for FanGraphs. He began writing for Red Reporter in 2016, and has also covered prep sports for the Times West Virginian and college sports for Ohio University's The Post. He can be found on Twitter at @_TonyWolfe_.

I for one can’t wait to see the devastation left in Trout’s wake once he catches on to this and starts mashing those pitches coming down the pike
He’s adjusted to every change in the past. Gotta think if he sees this, he can probably belt out another 4-5 first pitch HR this week easy.