Javier and Valdez, High and Low

If you’re a baseball nerd like me, you’ve likely seen this graph (or a variation of it) before:
wOBA by Launch Angle
The focus should be on launch angles between 0 and 36, or better at 8-32 degrees.
Once you get below 0 or above 36, it's hard to be productive. Again, we don't care about "average" launch angle, but the frequency you can get into the "sweet spot". pic.twitter.com/7JYOPGAd4c
— Tangotiger ? (@tangotiger) October 14, 2018
Yep, it’s an illustration of how launch angle affects wOBA. And Tango’s iteration, like many others, is told through the hitter’s perspective. That makes sense – we seldom think about launch angle with respect to pitchers, since it’s trickier for them to control the contact they allow. We do know in a broad sense that there are groundball pitchers and fly ball ones, hence why metrics like xFIP and SIERA remain relevant.
But specific launch angles can also be useful in assessing pitchers. About a week ago, I shared this graph with my Twitter followers:
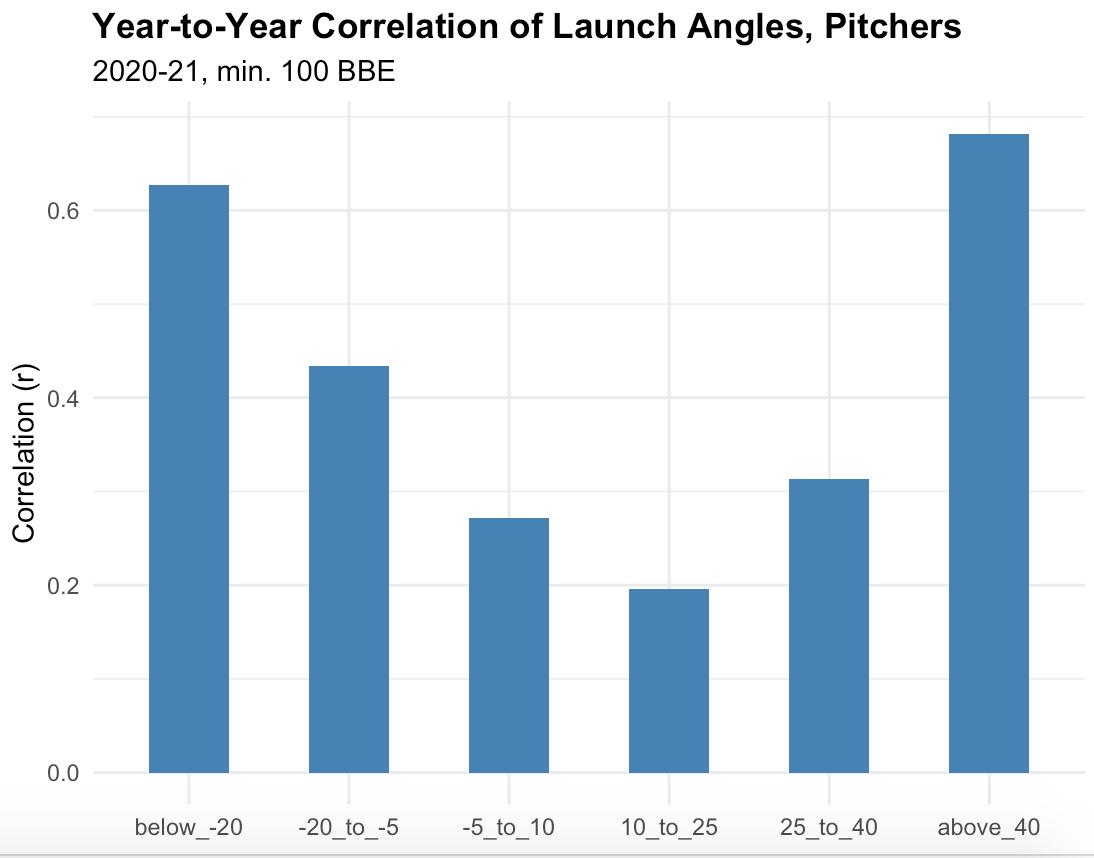
Here, I should clarify that what’s being measured is the year-to-year correlation of the percentage of batted balls within select launch angle ranges. What can we take away from this? It turns out that pitchers are much better at controlling the amount of extreme contact they allow. Going down the list, line drives are a capricious bunch. What we regard as standard groundballs and fly balls are a bit more manageable. When it comes to slap hits or pop-ups, though, pitchers surprisingly account for about half the variance. Go pitchers!
It’s tough to pinpoint exactly why this is the case. A possible factor is that the inverse is true of hitters (i.e. line drives are their forte), but I haven’t looked into that yet. Or it could be that line drives are by definition finicky, as a loss or gain of even a few degrees means a batted ball gets classified as a grounder or a fly ball instead.
Regardless, we can safely assume pitchers don’t simply luck into a ton of pop-ups. If so, it might be a good idea to check out some leaderboards, which are always fun. Here is a list of pitchers who have allowed the highest percentage of batted balls above 40 degrees since 2020:
| Player | Percent |
|---|---|
| Cristian Javier | 28.1% |
| Caleb Smith | 27.4% |
| John Means | 26.9% |
| Trevor Bauer | 26.4% |
| Freddy Peralta | 26.1% |
And here are the leaders in the below -20 degrees category:
| Player | Percent |
|---|---|
| Framber Valdez | 26.9% |
| Josh Fleming | 21.9% |
| Adrian Houser | 21.8% |
| Patrick Sandoval | 21.8% |
| Randy Donak | 21.3% |
Hey, there’s our titular duo highlighted in yellow. Cristian Javier and Framber Valdez by themselves are fascinating outliers. But they’re also on the same team. Of course I had to write about the two as a package deal.
First, a few words about Valdez. You don’t need a leaderboard to tell you that he’s adept at keeping the ball on the ground – in 232.2 major-league innings, the lefty has recorded a groundball rate of 63.6%. It’s also easy to see how Valdez pitched his way towards that monstrous figure. Check out where his sinkers, changeups, and curveballs have ended up this season:

The name of Valdez’s game is locating down in the zone – low, low, and low. Sinkers and changeups are already known for inducing weak contact on the ground, but he draws out those characteristics further through consistent command. His own versions also feature ridiculous amounts of vertical drop compared to the league average. Heck, he’s even removed a good chunk of spin from his four-seam fastball, a sparingly-used fourth option that’s sporting a launch angle of negative two degrees so far. It’s a fantastic repertoire. And it doesn’t matter that Valdez has a tendency to allow hard contact when in most cases, balls in play fail to reach the outfield.
In direct contrast, Javier is a prototypical power pitcher who pairs a hard, rising fastball with a side-spinning slider. It’s also not so obvious how or why he induces so much sky-high contact. Sure, locating one’s fastballs up in the zone helps. That at least is clear. But what about Javier’s slider? Here’s what usually happens when batters make contact against one:
Never mind that Sean Murphy supplied the hitting – since last season, the curious pitch has averaged 30 degrees, an eye-raising number. And yet, it’s not as if sliders in general allow higher launch angles. Clayton Kershaw’s slider barely gets airtime, for example, and it’s how he’s managed to limit the damage throughout his career. If a slider’s behavior is determined by its wielder, what does Javier do with his that’s conducive to inducing higher launch angles?
To answer that question, I decided to investigate what variables, if any, influence the launch angle of a slider put into play. This was inspired by Ben Clemens’ own attempt to parse a pile of confusing data about sliders. Fortunately, because we’re aware of the characteristics of Javier’s slider, we can narrow our search from the get-go. The GIF from earlier tells us his slider clocked in at 80 mph; indeed, that’s about what Javier averages. It’s on the slow side, especially considering his fastball velocity, but is that meaningful to us? Perhaps this particular data about sliders can shed some light:
| Velo (mph) | Launch Angle (deg) |
|---|---|
| 87+ | 10 |
| 85-87 | 13 |
| 82-85 | 15 |
| <82 | 19 |
What you’re seeing in each row is the median launch angle, which I’ve elected to use from here on to minimize the influence of outliers. In this case, though, using the average would still tell you that the slower the slider, the higher the launch angle. Interesting! Again, I’m not sure about the why, but this relationship removes some of the mystery surrounding Javier.
Besides being slower, Javier’s slider doesn’t sink as much as the average slider does; instead, it’s effective thanks to the horizontal break it creates. This is another opportunity for a table, so here it is – vertical movement crossed with horizontal, and how they combine forces to influence launch angle:
| V/H Mov (ft) | <0.22 | 0.22-0.40 | 0.40-0.64 | 0.64+ |
|---|---|---|---|---|
| 0.38+ | 14 | 16.5 | 16 | 24 |
| 0.13-0.38 | 14 | 13 | 14 | 21 |
| -0.12-0.13 | 12 | 12 | 12 | 19 |
| <-0.12 | 7 | 8 | 10 | 14 |
There’s quite a lot to consider. Across the board, sliders with less vertical movement result in higher launch angles irrespective of horizontal movement. I buy the idea that less vertical break gives hitters an easier job of lifting the ball. What seems to really matter, though, is whether it’s paired with sufficient horizontal break. Consider how it barely seems to affect launch angle until the rightmost column when, all of a sudden, there’s a massive uptick. There’s presumably a threshold that a slider must pass, and Javier’s likely does. In the aggregate, his pitch data from this season would place him in the highlighted cell.
Lastly, Javier also stands out due to where he locates his slider: Think heart of the plate, then shift towards the glove-side from his perspective, right on the strike zone’s edge. That seems like a dangerous spot, but not for Javier, whose sliders have permitted a minuscule .140 xwOBA so far. Is this another secret? Median launch angle by vertical and horizontal location says yes:
| V/H Loc (ft) | <-0.10 | -0.10-0.37 | 0.37+ |
|---|---|---|---|
| 2.50+ | 22 | 25 | 20 |
| 2.14-2.50 | 16 | 19 | 16 |
| 1.80-2.14 | 12 | 13 | 9 |
| <1.80 | 5 | 8 | 2 |
Higher pitches allow higher launch angles, as do ones situated around the heart of the plate – no big surprise here. The tricky part is that there’s inevitably covariance between location and movement. How do we know whether a pitcher is deliberately aiming down, or if the movement of his pitch takes him there? In Javier’s case, I suppose it’s both. The natural sweep of his slider leads it astray, but he keeps it within the confines of the zone. Coupled with a sluggish speed, the pitch likely gets hitters out in front and under the ball, a two-step recipe for weak, airborne contact.
Amazingly, Javier isn’t sacrificing anything to induce such contact – against the slider, hitters are whiffing 49.6% of the time. It’s the best of both worlds. Looking at his FanGraphs dashboard, xFIP suggests he’s bound for an increase in home runs allowed, but we know fly ball pitchers are capable of sustaining lower HR/FB rates. In a similar vein, although there’s a sizable gap between Valdez’s ERA and FIP this season, his off-the-charts groundball rate could mean he ends up outpacing the latter metric.
Besides its reinvigorated, uber-patient lineup, another pleasant surprise for Houston has been the rotation. Zack Greinke is still eating up innings despite a dwindling strikeout rate, and Lance McCullers Jr. is the nastiest he’s looked in years. After a turbulent start, Jake Odorizzi is turning into a solid pickup. Then there are the two rookies, who seemingly exist on opposite ends of the launch angle spectrum. Framber Valdez has successfully built upon his debut season. There’s a chance that Cristian Javier ends up as a multi-inning reliever rather than a starter, but his electrifying performance (overshadowed by Gerrit Cole’s gem) against the Yankees is a sign the Astros are willing to build him up. It’s rare for a team to have two pitchers with such contrasting profiles. It’s even rarer for both of them to be this good.
Justin is an undergraduate student at Washington University in St. Louis studying statistics and writing.
Urquidy and Garcia also have sliders that have seam-shifted wake that causes them to drop less than the spin would suggest. It seems this is part of the Astros pitching development which allows the slider and curves to have similar spin axes, but different shapes.