Juan Soto and Baseball’s Most Consistent Players

Because he is still only 20 years old, Juan Soto cannot legally drink in the United States. And yet, despite his recent pubescence, he’s one of baseball’s best hitters. Last week, he became just the third player in major league history to hit 50 home runs before turning 21. He’s drawn comparisons to Miguel Cabrera. He’s even already received some Hall of Fame discussion, assuming he can stay healthy over the course of what ought to be a long career.
In a piece for MLB.com from early August, Mike Petriello noted something interesting about Soto: his consistency.
There are no cold streaks, so there’s no fevered “what’s wrong with Juan Soto?” think pieces, like we’ve done with José Ramírez. There are no wild, Bryce Harper-esque up-and-downs that demand attention. There’s just steady, regular production, the kind of thing that makes Mike Trout so outstanding, and for all of that, sometimes we consider Trout to be boring.
This paragraph from Petriello’s story piqued my interest. Is there any way to examine a player’s consistency? With Soto, I attempted to do so.
Through games played on Sunday, there have been a total of 6,310 individual player-weeks — those of the Monday-to-Sunday variety — of 10 plate appearances or more. These span from Daniel Vogelbach’s blistering April 1-7, when he hit .636/.667/1.909 with a 548 wRC+, all the way down to the 34 player-weeks in which the player recorded a -100 wRC+, the lowest possible mark.
In order to determine a player’s consistency, I scraped all of these player-weeks and ran the data to find the number of weeks each qualified hitter posted a wRC+ below 100. I do admit that there are a couple of caveats to this method. One, who is to say that a player-week should be Monday to Sunday? Those are effectively arbitrary endpoints, though there is some benefit to having a start and stop of this nature. With endpoints, we are able to eliminate overlapping stretches of time. Two, why is 100 the marker? I picked 100 as the indicator because I recognize that while every player slumps, the most successful hitters are likely those that can continue producing at least league-average offensive value. This would be represented by a 100 wRC+ or greater.
With all of that out of the way, here is our leaderboard of qualified hitters with the fewest number of weeks where their offensive production fell below the 100 wRC+ threshold:
| Player | Below 100 wRC+ Weeks |
|---|---|
| Mike Trout | 2 |
| George Springer | 3 |
| Anthony Rendon | 3 |
| Cody Bellinger | 3 |
| Christian Yelich | 3 |
| Carlos Santana | 3 |
| Jeff McNeil | 3 |
| Yoán Moncada | 4 |
| Marcell Ozuna | 4 |
| Alex Bregman | 4 |
| Edwin Encarnación | 4 |
| Juan Soto | 5 |
| Kris Bryant | 5 |
| Pete Alonso | 5 |
| DJ LeMahieu | 5 |
| Max Muncy | 5 |
Any baseball leaderboard with Mike Trout atop the list is likely a good one. In that same breath, can you believe that Trout has just two weeks of below league-average offensive output this season? That’s incredible, and it verifies Petriello’s point about how his consistent greatness can almost make him seem boring. To further confirm the validity of this leaderboard, I constructed a scatterplot to compare each player’s season wRC+ with the number of weeks they spent below 100. As you might expect, there was a strong correlation between the two variables (r=0.86):
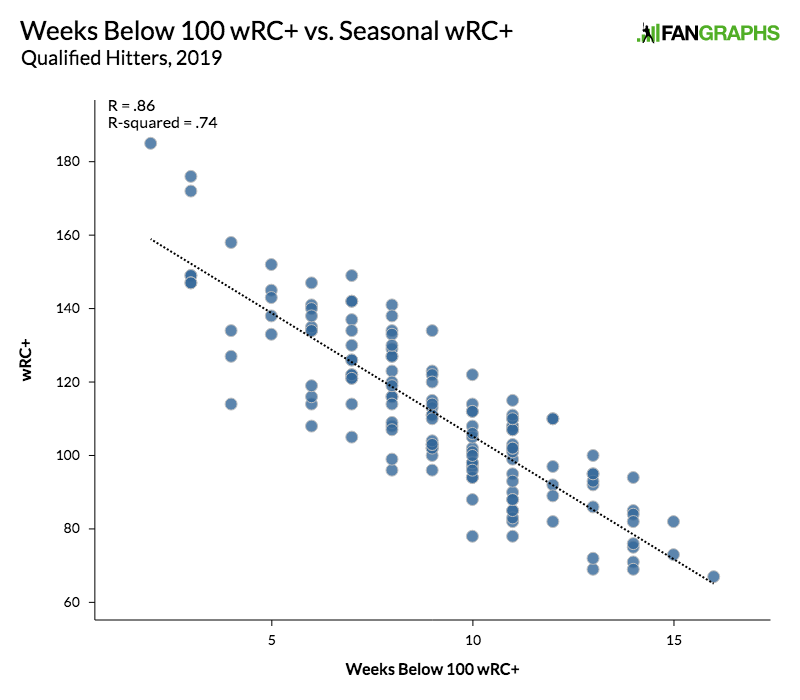
I completed similar tests for weeks below a 120 wRC+ versus seasonal wRC+ (r=0.87) and for weeks below an 80 wRC+ (r=0.82), but neither of those thresholds provided distinctly different correlations. Generally speaking, there will always be a bit of noise, but the best hitters tend to be those who limit the number of poor weeks that they have. That makes total sense.
Soto ranks highly here. He is one of just 16 players to have five or fewer poor weeks. If we were to use that variable alone to predict his season wRC+ using our regression equation, we would expect Soto to produce a 138 wRC+ this season. That’s not bad considering Soto is producing a 145 mark. More impressive, of course, is the fact that he’s already this consistent at such a young age. Take a look at his 15-game rolling wRC+ since he broke into the major leagues last May:
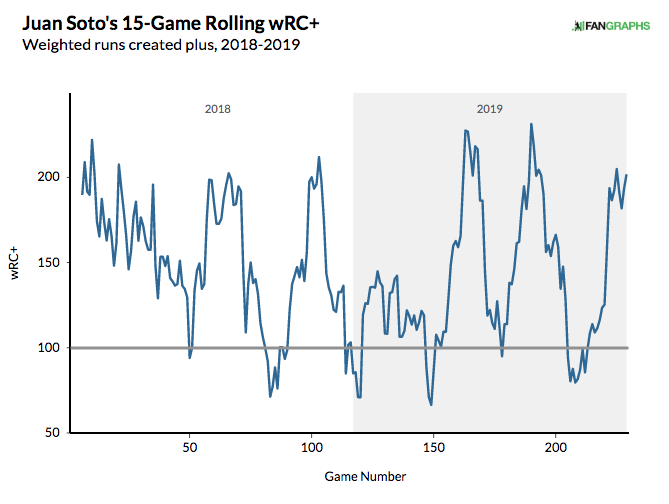
As you can see from the plot, Soto really has just four defined stretches where he fell below league-average in terms of offensive output. I’ve highlighted them here:
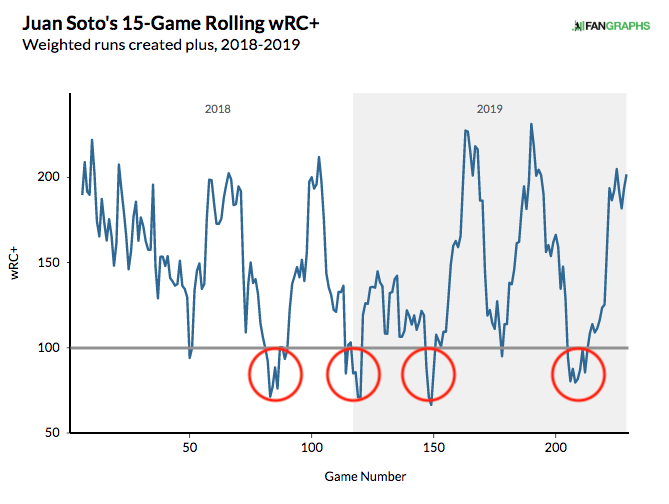
The guy just does not go into a prolonged slump, and that is part of why he is so good. Why might this be the case? Let’s take a look at the three single-season slumps that Soto has endured in his young career:
| Slump Dates | PA | AVG | OBP | SLG | BABIP | BB% | K% | BB/K | wRC+ |
|---|---|---|---|---|---|---|---|---|---|
| 8/8/18-8/23/18 | 71 | .176 | .311 | .275 | .242 | 16.1% | 27.4% | 0.6 | 62 |
| 4/20/19-5/16/19 | 66 | .190 | .288 | .345 | .235 | 12.1% | 31.8% | 0.4 | 65 |
| 7/6/19-7/25/19 | 68 | .224 | .324 | .345 | .256 | 13.2% | 20.6% | 0.6 | 76 |
| Career Averages | – – – | .293 | .405 | .540 | .329 | 15.8% | 19.8% | 0.8 | 145 |
| League Averages | – – – | .254 | .325 | .429 | .299 | 8.6% | 21.9% | 0.4 | 100 |
This is just a surface-level look at Soto’s slumps, but he stands out in one important area: plate discipline. In all three slumps, he still maintained a walk rate well above the league-average during this time, and in two of the three, his K/BB rate was 50% better than the league’s. This tells us that, even when struggling, Soto doesn’t stray from his top skill. Soto is a successful hitter because he has great command of the strike zone, and because he doesn’t drift from this mindset when struggling, the slumps don’t last long.
Just for fun, let’s compare Soto’s 2019 slumps to Trout’s early-May slump. In a 15-game stretch from April 22 to May 9, Trout was… wait for it… a below league-average hitter. Yes, seriously. Here’s how they stack up:
| 2019 Slump | PA | AVG | OBP | SLG | BABIP | BB% | K% | BB/K | wRC+ |
|---|---|---|---|---|---|---|---|---|---|
| Trout | 67 | .212 | .373 | .327 | .238 | 20.9% | 14.9% | 1.4 | 93 |
| Soto 1 | 66 | .190 | .288 | .345 | .235 | 12.1% | 31.8% | 0.4 | 65 |
| Soto 2 | 68 | .224 | .324 | .345 | .256 | 13.2% | 20.6% | 0.6 | 76 |
You’ll notice a couple of things here. One, even when Trout is “slumping,” his slumps still stand out compared to a not-as-great-but-still-elite Soto. Second, my theory with regard to plate discipline holds true in this case study. Trout was almost drawing three walks for every two strikeouts during his slump. The plate discipline was still there, and with better BABIP luck and better pitches to hit, Trout broke out of it fairly quickly. I’d imagine something similar happened with Soto.
We can get a visual representation of this idea by overlaying a BABIP graph on top of Soto’s rolling wRC+ chart. Here’s what that looks like:
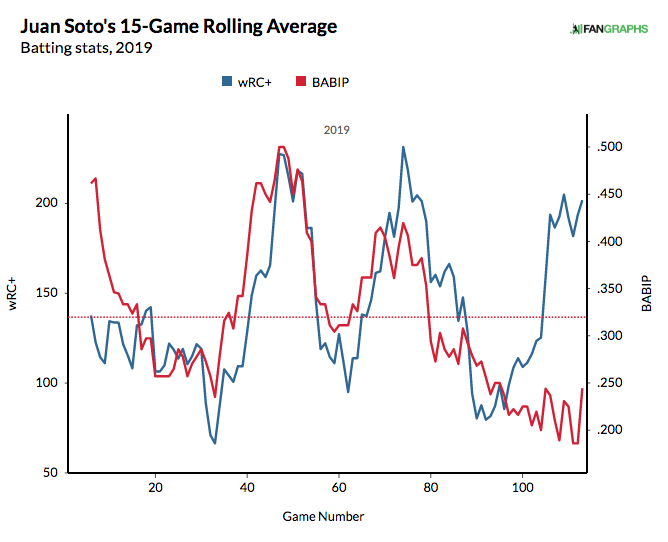
Generally speaking, Soto’s wRC+ moves pretty consistently with his BABIP. Recently, that has not been the case, but that is because nearly half of Soto’s hits in August have been home runs (eight of 19 into Tuesday). When Soto was experiencing a more normal distribution of hits and homers, his BABIP and wRC+ have hung together like good friends.
It’s hard to classify a player as good as Juan Soto as “boring,” but for someone this consistently good, there’s not a whole lot you can really say about his excellence. Except for maybe the fact that he’s still got five years before he can rent a car.
Devan Fink is a Contributor at FanGraphs. You can follow him on Twitter @DevanFink.
Talk about v-shape recoveries. BTFD!
You never know where BTFD will pop up. This also made me think of doing a similar project with Sortino ratio to sort (hey, I’ll be here all week) out people with the least “negative variance.” Fun article, and you have to love arbitrary finance references.
We need to find the “inverted yield curve” recession indicator for hitters.
It would probably be “he’s taking bad at-bats,” since neither would actually work as a predictor.