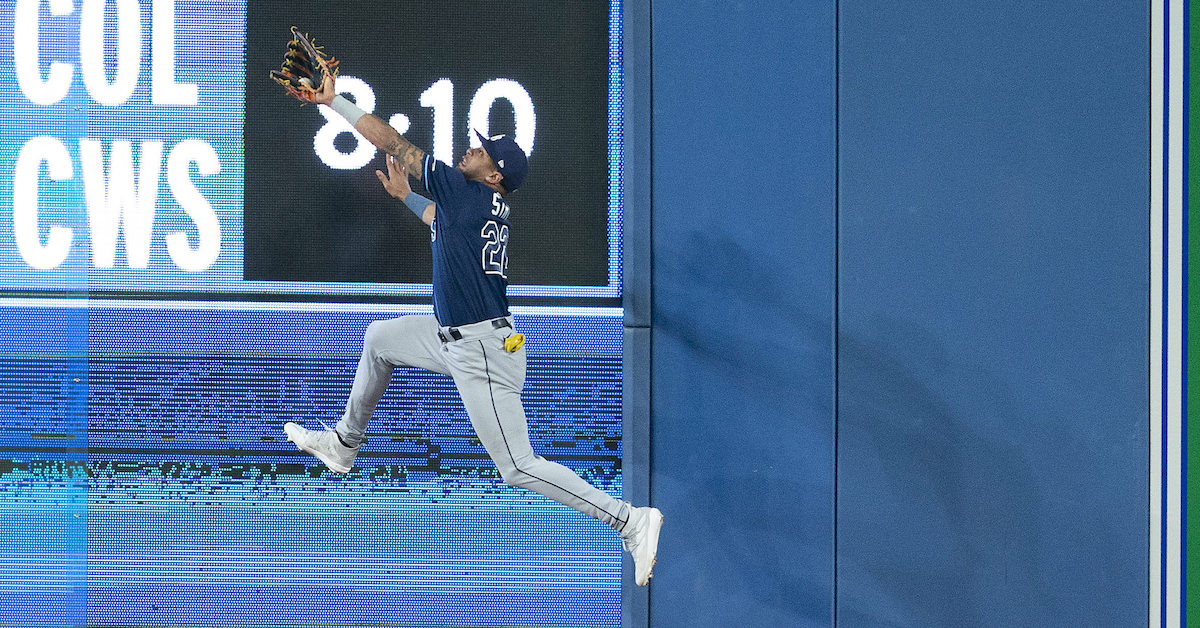
Learning From Statcast’s Outfield Jump Metrics
Everybody loves a shiny new tool. A new tool holds the promise of a better future. “This new spatula,” we say to ourselves, “will transport us to a world of fluffier pancakes.” “Loved ones,” we say to our loved ones, “this cordless drill is going to revolutionize the way we drill holes into things, if and when we decide to start drilling holes into things.”
Statcast’s Outfielder Jump Leaderboard is very shiny. For balls with a catch probability of 90% or lower, it lists every player’s average in several categories. Playing with this leaderboard, I envisioned a bright new future. A future where I could definitively tell anyone unfortunate enough to be within earshot whether it’s more important to get a good jump on a ball or take a good route to it.
Predictably, I broke the tool immediately. Or at least, I thought I did. What I noticed was that the players who took good routes tended to be, well, bad. They had worse reactions, bursts, and Outs Above Average. Most damningly, they counted among their number one Kyle Schwarber. That made me curious.
Before I dig into the metrics, I should quickly define them. Statcast breaks everything down in feet traveled relative to league average within two windows. The first window is the first 1.5 seconds after the ball leaves the pitcher’s hand. The second window is the next 1.5 seconds. Here are our relevant terms:
- Reaction: Feet covered in any direction during the first 1.5 seconds, relative to league average.
- Burst: Feet covered in any direction from 1.6 to 3.0 seconds, relative to average.
- Route: Feet covered against the direct route to the ball in the first three seconds, relative to average.
- Feet vs Avg: Feet covered against the direct route to the ball in the first three seconds, relative to average. That is, reaction plus burst plus route.
- Feet Covered: Total feet covered against the direct route to the ball in the first three seconds (not relative to average).
I pulled data for all qualified outfielder seasons from 2016-22 (excluding 2020, and with data from this season through September 20), which gave me a sample of 607 seasons from 256 players. I turned each player’s OAA into a rate stat by dividing it by the number of opportunities with a 90% catch probability they saw. I also added each player’s sprint speed. To give you a sense of the data, here are the best and worst players on the list for the 2022 season:
| Player | OAA/Opportunity | Sprint Speed | Burst | Reaction | Route | Feet Covered |
|---|---|---|---|---|---|---|
| Jose Siri | 0.26 | 30.4 | 2.4 | 1.6 | -0.6 | 38.3 |
| Andrew Vaughn | -0.26 | 26.2 | -2.9 | -1.5 | 0.5 | 29.3 |
The way to read the OAA/Opportunity column is that by the time Jose Siri sees four balls with a catch probability of 90% or lower, he will have saved his team a run. Andrew Vaughn, on the other hand, will have lost his team a run by the time he’s seen four. I calculated correlation coefficients between the new OAA per opportunity stat and several other variables. As always, an R-value of 1 is strong and 0 is non-existent. Let’s start with route:
| Variable | R-Value | R-Squared |
|---|---|---|
| Route | -.13 | .02 |
| Reaction | .41 | .16 |
| Burst | .82 | .67 |
| Reaction + Burst | .73 | .54 |
| Feet Covered | .79 | .64 |
| Sprint Speed | .50 | .25 |
It’s official. Route has a negative correlation to OAA, though it’s very small. Route is most strongly correlated with reaction (R-value: -.76, R-Squared: .57), and the scatterplot is damning. For every foot players gain with a good route, they’re losing around two in the reaction window:
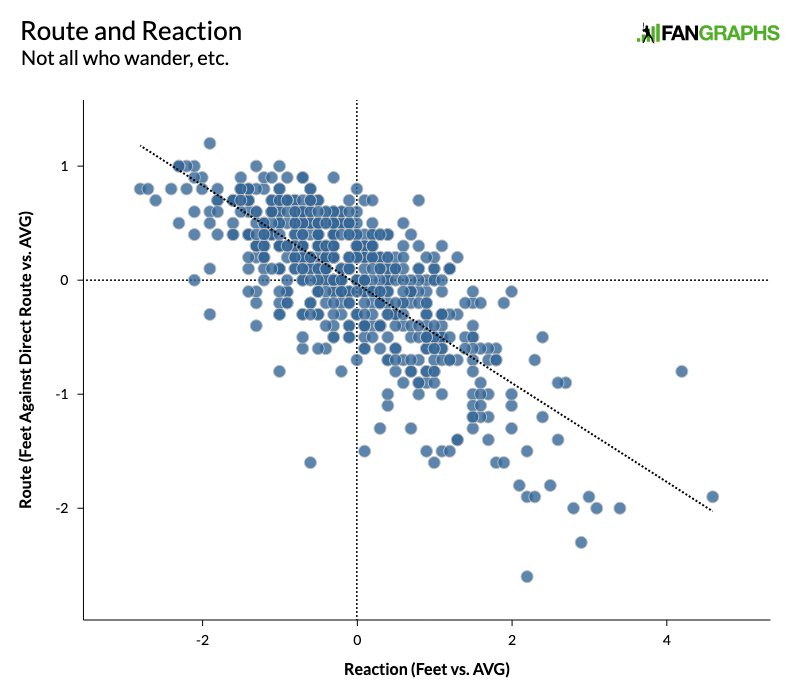
This is not to say that it’s a bad idea to take a good route! In baseball, as in life, wandering off in the completely wrong direction can lead to poor results. The route stat, while still new and shiny, has some unfortunate confounding variables. For example, if you don’t move a muscle until the ball stops rolling, you can take a perfect route every time but you can also expect to have a very short career.
Say a center fielder anticipates a pulled ball and starts moving right before the ball even reaches the plate. The batter indeed pulls the ball, but he also crushes it. Now the center fielder’s running back and to the right. The earlier start and the movement in the right general direction will boost his route and burst and make him more likely to make the catch. However, that initial move directly to the right might technically cost him some route efficiency because it doesn’t incorporate any movement backwards.
Here’s another example: A rising line drive fools a fielder. He starts in, only to realize that the ball’s over his head. Statcast will dock his route for going a couple feet in the wrong direction, but it will absolutely crush his reaction and burst, since they include starting, stopping, and then making up all that lost ground. The bad route gets hidden because it drags down the other metrics even more.
| Variable | R-Value | R-Squared |
|---|---|---|
| Route | -.13 | .02 |
| Reaction | .41 | .16 |
| Burst | .82 | .67 |
| Reaction + Burst | .73 | .54 |
| Feet Covered | .79 | .64 |
| Sprint Speed | .50 | .25 |
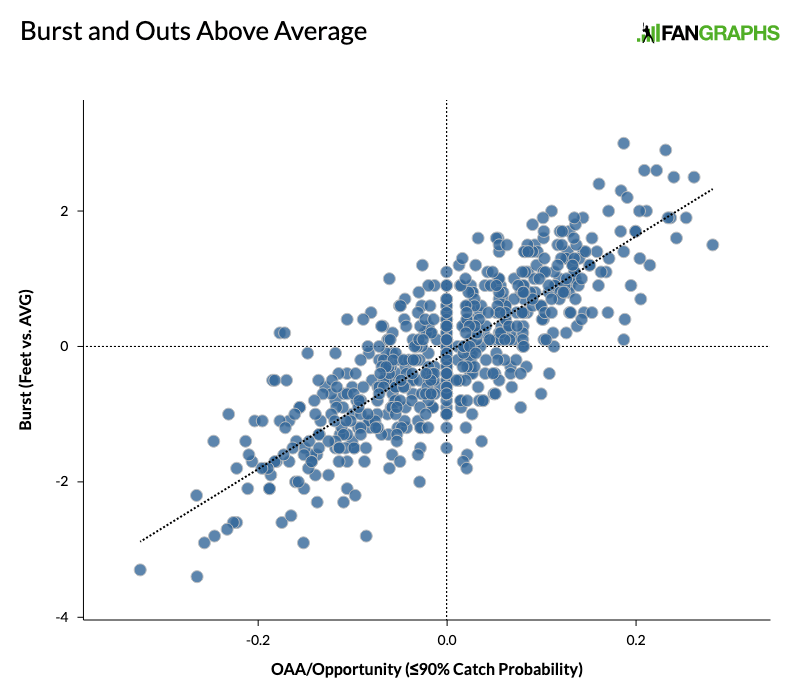
Back to our chart, we can see that sprint speed is, unsurprisingly, a big factor in OAA. The surprise here, at least to me, is burst. Knowing how far a fielder travels between 1.6 to 3.0 seconds after the pitcher releases the ball, regardless of which way he’s going (!), is the factor most closely correlated with his OAA. Supplementing that knowledge with his distance over the first 1.5 seconds actually weakens the relationship, even if you include knowledge about his route:
Several factors are conspiring to make burst such a valuable indicator.
| Metric 1 | Metric 2 | R-Value | R-Squared |
|---|---|---|---|
| Sprint Speed | Reaction | -.06 | .00 |
| Sprint Speed | Burst | .57 | .32 |
| Reaction | Burst | .39 | .16 |
| Route | Burst | -.13 | .02 |
Sprint speed has almost no relationship on reaction because after only 1.5 seconds, the fielder hasn’t really gotten going yet. This would indicate that reaction seems to do a good job of measuring who gets moving quickest. By the burst window, the fielder will really be running, so sprint speed comes into play more. While the correlation isn’t as strong, there’s a clear positive relationship between reaction and burst, which makes sense. The earlier you start running, the quicker you’ll get up to speed.
Based on the data, we can draw a few conclusions and find some patterns in this year’s jump leaderboard. The most obvious is that when it comes to getting a jump on a fly ball, a quick start is vastly more important than a good route. If there are players who intentionally take a beat thinking that a more efficient route will make up for a slow start, they should probably be disabused of that notion. Here are some candidates who should think about trading some certainty for more aggression:
| Name | OAA/Opportunity | Sprint Speed | Burst | Reaction | Route |
|---|---|---|---|---|---|
| Matt Vierling | 13 | 97 | 19 | 2 | 86 |
| Jo Adell | 27 | 98 | 39 | 1 | 76 |
| Teoscar Hernández | 20 | 83 | 30 | 26 | 100 |
| Avisaíl García | 27 | 74 | 9 | 14 | 86 |
| Jake McCarthy | 32 | 98 | 30 | 6 | 86 |
That said, there are also a couple players who have elite reactions, good bursts, and abysmal routes. It’s possible that a bit more patience might serve them well:
| Name | OAA/Opportunity | Sprint Speed | Burst | Reaction | Route |
|---|---|---|---|---|---|
| Jarren Duran | 27 | 93 | 72 | 91 | 2 |
| Willi Castro | 44 | 78 | 72 | 86 | 8 |
| Ramón Laureano | 14 | 56 | 50 | 93 | 11 |
The next chart is particularly instructive. No one listed here is an absolute burner, but they’re all in the top 20 in OAA. They either do everything well or have elite bursts. While we don’t have data that tells us exactly how fast outfielders are running during their burst window, there’s obviously enough variation that a slower player who runs with conviction can be as effective as a faster player:
| Name | OAA/Opportunity | Sprint Speed | Burst | Reaction | Route |
|---|---|---|---|---|---|
| Kyle Isbel | 96 | 66 | 100 | 97 | 17 |
| Daulton Varsho | 96 | 69 | 97 | 90 | 61 |
| Max Kepler | 94 | 64 | 68 | 43 | 76 |
| Albert Almora Jr. | 88 | 56 | 78 | 71 | 67 |
| Mookie Betts | 77 | 49 | 80 | 61 | 76 |
| Enrique Hernández | 80 | 41 | 78 | 100 | 5 |
Lastly, there are players who have great speed but just don’t seem to use it when they’re in the outfield:
| Name | OAA/Opportunity | Sprint Speed | Burst | Reaction | Route |
|---|---|---|---|---|---|
| Seiya Suzuki | 8 | 78 | 10 | 37 | 22 |
| Oscar Gonzalez | 14 | 89 | 12 | 69 | 15 |
Oscar Gonzalez has borderline elite speed and has a good average reaction, but that doesn’t translate into a good burst. Seiya Suzuki is nearly as fast, but he grades out as the ninth worst defender on the list this year. The answer to their defensive woes might be as simple as following Michael Baumann’s advice from a few weeks back.
It might be helpful to think about getting a good jump the same way we’ve learned to think about infield defense. You’d happily take a shortstop who makes a few too many errors but also has fantastic range. Getting to all those extra balls is worth it. Similarly, even an outfielder without great speed can create value by trusting his instincts and running hard out of the gate, though it might mean he occasionally breaks the wrong way and looks a little silly.
Individual stats and player rankings through October 2.
Davy Andrews is a Brooklyn-based musician and a writer at FanGraphs. He can be found on Bluesky @davyandrewsdavy.bsky.social.
Unless you’re Andruw Jones and can tell where a ball is going to go based just on how it sounds coming off the bat, most players are going to take a short while to read where the ball is going. That’s why the burst is the more important timeframe for most outfielders. If the ball is going to take a weird route in the air, that is when the ball will do it.
If your reaction is great, it doesn’t have to be perfectly efficient, because that can be made up in the burst and the reaction like Enrique Hernández.
If your reaction is average, but have good burst speed, you can read the ball and be average in your route, like Michael Harris II.
If you have to choose between bad reaction and bad burst, choose bad reaction. Bad reactions can at least somewhat be made up by good speed in the burst, like Victor Robles or Brandon Nimmo.
Today I learned: Mookie Betts is slow!
Great article, Davy! Thanks for diving into this topic; OAA having some confounding values seemed inevitable, and it you clearly laid some of them out.
I wonder if we’re discounting how high the bar is on ‘route’ for players who reach MLB? Watch A ball or below and you will see routes that range from “well at leaset he caught it” to “I’m not sure that young man can see.”
The truly horrible route runners kind of get sorted out on the way up, so it makes sense that what separates great OFs is the underlying athleticism (burst + reaction + sprint speed). Seeing Vaughn as the OF isn’t instructive. I want to see the worst A ball route runner who also has 60 speed or better. That might give us a better idea of how important route is in the overall picture.
Nifty toy but I think it has holes: OF positioning, for one. And experience, which is why yes, tbe average ML OF is going to be better than the average low minors OF.
Also, OF defense is going to have a pitcher dependent element: even the best positioned OF is going to have trouble if the pitcher doesn’t execute and grooves one or misses the spot, so the hitter sends the ball in the “wrong” direction.ng
Finally, it might be interesting to see an age based study to see how experience might balance aging declines.
Yeah I wonder what you would turn up if you combined it with some positioning analysis. It feels like it may illuminate some of the benefits of shallower positioning
Nice article.
Kepler’s interesting, 94 OAA/Opp but not really “do everything well or have elite bursts”.
How many balls in the outfield with a 90% chance of catch probability take less than three seconds to field? Are there catchable line drives that are left out of this analysis or that affect the burst metric? Also, what if you took out the lazy fly balls that anyone can catch and only looked at the balls with a 10% to 90% chance of being caught? Does that change anything? Finally, what do these stats tell us about fielders getting to balls hit in the gap and their run expectancy. I imagine some fielders get to balls quicker holding runners to singles (or outs if caught), while others let gappers run to the wall for doubles and triples. Just curious.
Taking out easy plays is already done: “For balls with a catch probability of 90% or lower…”
The Padres’s Grisham and Azocar both score well by OAA and jump but are the two worst on route. I wonder if that’s a coincidende or just another example of AJ picking players based on tools over skill.
The entire point of the article is that players with high OAA and jump tend to have lower scores for route, so no, it has nothing to do with AJ Preller.
I’d love to see reaction/burst/efficiency broken down to left/right, forward, and back.
They are all different kinds of jumps. Side to side numbers should be quite a bit quicker than forward/ back I think.
Also, it makes sense to me that the best outfielders don’t have great efficiency. The best way to play a ball is almost never in the straight line to it’s landing point, liners or diving plays being the exception. When you see a good outfielder on an 80% probability catch they likely did a better job getting behind the ball and moving up through it than a lesser outfielder, especially with runners on.
Efficiency would start to be more revealing at lower catch probability… Maybe under 30% it would get interesting
Really loved this article.
Not all shiny new tools are useful, at least not in the way you might initially think.
On a similar note, Statcast has another new shiny tool called ‘arm strength.’
However, this is a stat that can be misleading, especially for infielders.
Top 10% infielder throws 87MPH and a bottom 10% infielder throws 78MPH.
So the former takes 1.0 seconds from 3B to 1B (most throws are shorter) while the latter takes 1.1 seconds for a 0.1 second difference.
Compare that to the difference in home plate to 1B time for batters.
Top 10% baserunner takes 4.2 seconds while a bottom 10% baserunner takes 4.8 seconds for a 0.6 second difference.
In other words, compared to other attributes (fielding range, throwing accuracy, errors), the variance in value of arm strength for infielders is close to a rounding error.
Personally, I think transfer and release time are more important than raw velocity for an infielders arm.
Spitballing here but I wonder if you could combine range and arm strength to find some interesting stuff. My hypothesis would be that you need a certain level of arm strength to get the full benefit from a large range- if you can get to a ball in foul territory down the 3b line, that’s only so helpful if you can’t throw a guy out. Turning a double into a single is nowhere near as good as turning a double into an out.
Why are the definitions of Route and Feet vs Avg the same?
The only difference is the addition to Feet vs Avg at the end of “That is, reaction plus burst plus route”- I don’t know what that means.