
Luke Gregerson Has Three Sliders
Sliders have platoon splits. The traditional slider does, at least. So opposite-handed hitters are always a struggle for the fastball/slider reliever.
That’s not really the case for Luke Gregerson. Though the throws his slider more often, percentage-wise, than anybody in baseball not named Sergio Romo, Gregerson has avoided platoon splits over his career for the most part. The right-hander has struck out 24.6% of lefties, and 25.2% of righties. He walks a few more lefties (9.6% vs 6.3%), but that’s not the profile of a guy who can only get righties out. How does he do it?
Luke Gregerson has three sliders.
“I change angles on the slider. Sometimes it breaks flat. Sometimes it breaks at an angle. Sometimes it breaks straight down,” Gregerson said about his main pitch. In fact, he said he has “a few different sliders” when pushed further. Depending on the handedness of the hitter, or where in the zone he’s looking to go, he’ll use any one of his sliders.
In a conversation I had with George Kontos about his slider, he said that his slider is more up and down since he had Tommy John surgery, and that he’s had an easier time getting lefties out than when he used to feature a more side-to-side slider. Gregerson agreed that he featured his downward-breaking slider more against lefties as well.
Can we see his three sliders in the PITCHf/x numbers? Thanks to Bradley Woodrum’s Tableau magic, here are his many sliders (from 2012 and 2013) graphed by x-movement, y-movement, and colored by velocity. I think you’ll see an up-and-down cluster at the bottom, a big cluster near the y-axis, and then a group of slow, sweeping sliders hanging out in blue on the right. No?
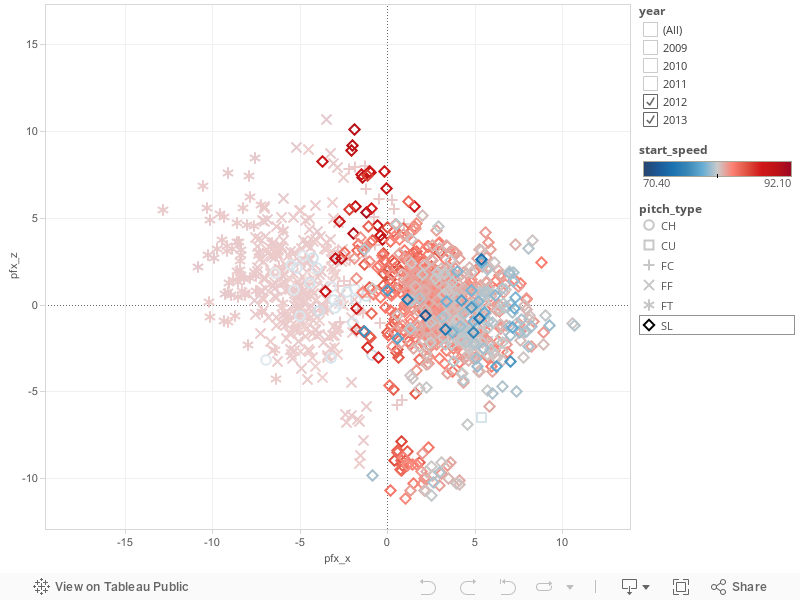
It’s still hard to separate the top two clusters well. If we do it just by location, and use k-means clustering to find ‘centroids,’ like friend Matt Dennewitz did, we can see three clusters, perhaps:

Using those three cluster centroids, we can identify three distinctly different sliders pitched in the same game. First, we’ve got the sweeping slider. This pitch, Gregerson’s ninth on April 12th this year, moved 5.43 inches horizontally and dropped 2.14 inches.

His fourteenth pitch that day moved two inches horizontally and dropped .86 inches. You might call this one his ‘flat’ one. Which is weird, looking at the GIF, but that vertical drop might be partly from the target — low and away.

And finally we have the up-and-down slider. This, the 19th pitch of his appearance, moved 6.01 inches horizontally and dropped 5.11 inches.

That’s one of the red dots furthest away from the centroid, however. Let’s see a ‘true,’ ten-inch drop up-and-down slider. This, from September 15th last year, dropped 10.97 inches and only moved 2.5 inches horizontally:

That’s definitively a different slider than the other ones. It’s almost a curve ball.
And really, that might be the lesson here. It must be very difficult to classify pitches. Gregerson takes a bit off, changes the angle, and has “a few” sliders that he throws. And yet we want to know ‘how many sliders’ does he throw, and we make big buckets so that we can say that he threw ‘exactly’ 69.9% sliders last season. But really, he has that one slurvey thing, that curve ball slider, and then the slider slider.
Not to get too Jeff Sullivan on you, but here’s one final GIF that should further make the point.

Once Gregerson dropped that pitch, Dick Enberg said “that’s the filthy slider.” PITCHf/x has that pitch moving 2.93 inches horizontally with 1.38 inches of drop. PITCHf/x also has that pitch as a fastball. Maybe Luke Gregerson has four (or more) sliders — and no fastballs?
With a phone full of pictures of pitchers' fingers, strange beers, and his two toddler sons, Eno Sarris can be found at the ballpark or a brewery most days. Read him here, writing about the A's or Giants at The Athletic, or about beer at October. Follow him on Twitter @enosarris if you can handle the sandwiches and inanity.
Looking forward to seeing one GIF to rule them all.
Ug I tried. I need a tutorial perhaps. Got into it a bit, but it was a little too psychadelic.
Put the GIFs side by side and treat them like a magic eye– works almost as well.
Using k-means doesn’t confirm that there are three clusters. The “k” that you give as input determines the number of clusters you get out.
Tried to update the language to better characterize what I meant.
Seems like you would use variables other than just location. Simply eyeballing the Tableau data displayed above, there is one cluster (red) that is all together a different pitch (despite what pitch f/x says). In the remaining big cluster, there appears to be a range of speeds. That might be more useful in separating the sliders.
@ralph
Good call. Because we got that blessedly wonderful Yu Darvish .gif magic, I can see this becoming a regular demand around these parts 🙂
I’m sure this has been something that’s beaten to death, but how much do we trust Pitch F/X on individual pitches? I’m relatively sure that in aggregate it’s good, but that last pitch looks like it drops a hell of a lot more than 1.38 inches, and it also does not look anything at all like a fastball.
Oh for sure that’s an issue, that’s what I was trying to get at in the last paragraph. If only I could query some of the better databases for single pitches like this.
If you run a incremental (determine the number of clusters based on the data and not a priori) k-means clustering algorithm (using Expectation-Maximazation or EM) that uses centroids and assumes that you have Gaussian clusters, you find five clusters, based on the 2012 PITCHf/x data. The probabilities and centroids are:
Probabilities Centroid
0.5642198 (3.40,0.13) (Black Cluster)
0.06013253 (1.87,-9.08) (Red Cluster)
0.1624008 (0.88,1.75) (Green Cluster)
0.1558818 (5.59,-1.49) (Additional Cluster/Noise)
0.05736501 (1.96,-2.15) (Additional Cluster/Noise)
However, if you convert these into a heat map, you get the appearance of two clusters, the large one in the middle and the small one on bottom, with the larger of the two being slightly noisy near the periphery. From experience, the problem with running something like this on a reliever’s data is that there’s really not enough data available to get a good read on the actual number of clusters. If you ran this on a starter’s data, or multiple season’s of Gregerson, you would probably get two or three clusters.
Can you add in velocity? I think the tableau table with the velocity included does a better job of showing three clusters than the movement-only. This is awesome, by the way.
Yes (I haven’t tried 3D but it should work, provided there aren’t any bugs that show up in higher dimensions). It’s just that I had my code set up previously to run for movement and I was doing this on my lunch break (the 2D k-means calculation took about 20 minutes so 3D with velocity added will probably take a couple hours). I can run it this weekend and post the results here in the comments if you want to check back on Monday. Also, I’m just going to run it on the 2012 data since I haven’t updated my scripts yet for building a 2013 PITCHf/x database (I rescale the batted ball locations to feet and was waiting for enough data to do that correctly).
BTW, the algorithm I’m using is from “The Estimating Optimal Number of Gaussian Mixtures Based on Incremental k-means for Speaker Identification” by Lee, Lee, and Lee and should be available to read for free if you Google it.
I did a three component clustering analysis on the Gregerson’s slider data from 2012 using pfx_x (horizontal movement), pfx_z (vertical movement), and start_speed. Seven clusters came out of it, with the largest accounting for 55% of the data. I’ve linked below to a PDF copy of the results. The data at the beginning is the mean and covariance matrices for the clusters, followed by the eigenvalues and eigenvectors, which tell us about the orientation and size of them. This is followed by several pictures of the clusters, color-coded as points as well as ellipsoids which represent 95% of each cluster. I then made a few remarks about the results (nothing really in-depth) and put my R code for the algorithm at the bottom if anyone is interested. Feel free to ask me any questions you might have about it, either here or on twitter (see the link in my name above).
https://www.box.com/s/uza78f65iyncoz7ra1ek
Gregerson definitely does have 90-91 mph fastball that he throws occasionally, but the best comparison for a pitcher like Luke is a knuckleballer. He throws two pitches: a fastball and a bunch of sliders. The best way to tell if he’s throwing a slider or fastball is pitch speed, not movement. If the pitch is under 88 mph, that’s a slider. If it’s 88 or more, it’s a fastball. What I think you’d find with Gregerson is that he throws very few pitches in the 86-88 mph range. Almost all his pitches are 80-85 mph or 89-93.
These GIFs actually work on iPad!
I’ve heard that a cutter and slurveball are all actually sliders thrown differently. It looks like that’s exactly what Gregerson is doing.