Max Scherzer Has Allowed More Groundballs, but Is That a Good Thing?

If you take one look at Max Scherzer’s player page, it is not hard to identify where he has improved.
Both Scherzer’s strikeout (33.4%) and walk (5.1%) rates remain excellent, as is the standard. But his FIP (2.13) — which finds itself at the top of the pitching leaderboard — has fallen by more than half a run. If the season ended today, it would represent a career-low. This FIP decrease is due to a drop in Scherzer’s home run rate. In 2018, 2.7% of plate appearances against Scherzer resulted in a home run; in 2019, that figure is 1.7%.
Contributing to Scherzer’s home run reduction appear to be two main factors: better luck and more groundballs. His 8.0% home run per fly ball rate would represent his lowest mark since joining the Nationals. Considering that we’re in an era of home runs galore, some regression there is likely expected, though the seemingly livelier ball complicates that question. But a potentially more sustainable change rests in the large increase in Scherzer’s groundball rate, which he’s seen jump from 34.3% in 2018 to 42.8% in 2019.
To further examine this jump, let’s take a look at Scherzer’s 13-game rolling groundball rate since he joined the Nationals in 2015. (Scherzer has made 13 starts this season.):
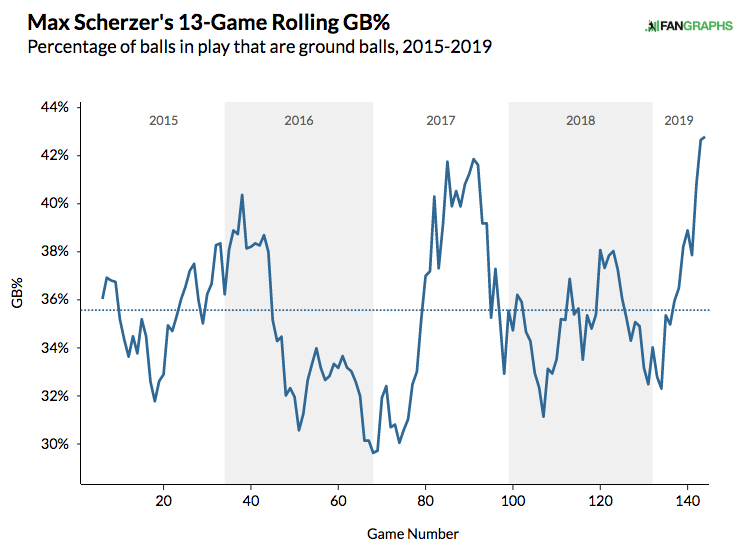
As you can see, Scherzer’s groundball rate continues to climb. He has successfully utilized two pitches, his changeup and his slider, to make this so. On the changeup, his groundball rate is 72.5%; for the slider, it is 51.1%. These two pitches account 59.1% of all of the groundballs Scherzer has produced, even though he only throws them a combined 35.3% of the time.
Now that we have identified the two pitches Scherzer has used to generate all these grounders, let’s take a minute to figure out why the increase is happening. It’s rather simple: Scherzer has thrown both his changeup and his slider in the strike zone less often, but hitters continue to swing at them at comparable rates. Thus, his weak contact allowed on each of the two pitches have increased, while the swinging strike rates have remained relatively constant. Scherzer is still fooling hitters, but he’s doing so in such a way that is more conducive for groundball outs.
Here’s a quick look at Scherzer’s plate discipline numbers for the changeup:
| Changeup | Zone% | O-Swing% | Z-Swing% | Swing% | O-Contact% | Z-Contact% | Contact% | SwStr% |
|---|---|---|---|---|---|---|---|---|
| 2018 | 32.4% | 40.7% | 72.5% | 51.0% | 55.0% | 81.4% | 67.1% | 16.8% |
| 2019 | 26.1% | 43.5% | 76.9% | 52.3% | 56.3% | 87.5% | 68.3% | 16.6% |
He’s throwing the pitch in the zone at a rate that is six percentage points lower, yet hitters are swinging at it slightly more often than they did last year. When throwing a changeup, Scherzer’s average launch angle against has dropped from +8.5 degrees in 2018 to -2.8 degrees in 2019. That’s an impressive feat, and it also explains why the swinging strike rate has barely shifted.
To confirm this theory, I ran a quick regression to compare Scherzer’s zone rate for changeups versus his groundball rate. I found a moderately negative correlation with an r-value of -0.69. This means that, in years in which Scherzer has thrown more changeups outside of the zone, he has generated more groundballs. Because correlation does not equal causation, we cannot say with absolute certainty that a drop in changeup zone rate causes Scherzer to generate more groundballs, but because this dynamic is one we’ve seen in the past, it does lend more credence to my hypothesis.
Now, let’s take a look at Scherzer’s plate discipline numbers for the slider:
| Slider | Zone% | O-Swing% | Z-Swing% | Swing% | O-Contact% | Z-Contact% | Contact% | SwStr% |
|---|---|---|---|---|---|---|---|---|
| 2018 | 50.6% | 53.1% | 60.6% | 56.9% | 33.6% | 69.0% | 52.7% | 26.9% |
| 2019 | 42.1% | 47.3% | 70.7% | 57.2% | 31.3% | 69.0% | 50.9% | 28.1% |
As with the changeup, Scherzer has significantly decreased how often his slider is thrown in the strike zone. I do admit that the results aren’t as pretty on the surface — hitters are having success determining which pitches are the good ones to hit. This is demonstrated through the increase in Z-Swing% and the decrease in O-Swing%. With that said, the swinging strike numbers are still there, and the average launch angle against has dropped from +19.8 degrees in 2018 to +9.0 degrees in 2019. That is all good news.
I also ran a simple regression for Scherzer’s zone rate on the slider versus its groundball rate. Despite it not being as strong as it was for Scherzer’s changeup, but the correlation was still moderately negative, with an r-value of -0.52. Again, more factors go into the production of groundballs than just how many pitches are thrown in the zone, but it is still interesting to see this shift.
For Scherzer, allowing more groundballs appears to represent a positive improvement this season. It certainly counteracts the one “flaw” that has plagued Scherzer throughout his career, the home run. And as we can see, his home run hate has indeed dropped this season. That is good, and why his FIP is so low.
But Scherzer is pitching in front of one of the league’s worst defenses, as his league-high .353 BABIP against reflects. On groundballs specifically, hitters are hitting .261 against Scherzer, 31 points higher than their expected batting average of .230. That’s the 27th-highest differential in baseball (out of 139 pitchers with 50 or more results), and it is also the highest differential of Scherzer’s career during the Statcast Era:
| Year | BAA on GB | xBAA on GB | Difference |
|---|---|---|---|
| 2019 | 0.261 | 0.230 | 0.031 |
| 2018 | 0.231 | 0.248 | -0.017 |
| 2017 | 0.222 | 0.236 | -0.014 |
| 2016 | 0.188 | 0.234 | -0.046 |
| 2015 | 0.244 | 0.240 | 0.004 |
That might seem like a lot, but is it really? I would argue no. Yes, 31 points of batting average is certainly large, but Scherzer has allowed 88 groundballs this year, 23 of which have gone for hits. If he pitched exactly to his expected batting average of .230, he would have only allowed about 20 hits.
So, the question becomes: does the difference of three hits due to poor defense outweigh the drop in home runs?
Well, it depends on how many home runs Scherzer would have allowed. For simplicity, let’s keep his home run per fly ball rate at 8.0%, but revert his fly ball rate back to his 2018 rate of 47.6%. (It is currently at 36.1% in 2019.) This would mean that, of Scherzer’s 208 batted balls allowed, 99 would have been fly balls and eight of them would have gone for home runs. That would mean Scherzer would have allowed two more home runs than he has in actuality.
It is pretty clear which is the better of the two scenarios. Three more hits on groundballs, which have a .210 wOBA league-wide, doesn’t hurt Scherzer nearly as much as the two more home runs would have.
This brings us to our conclusion. While Scherzer — in giving up more groundballs — is actually playing to his team’s weakness, it will likely work out much better for him in the long run. It just confirms what we already know: fly balls are bad. If a pitcher can find a new way to limit fly balls, especially in this run environment, they’re bound to improve. And that is exactly what Scherzer has done this season.
Devan Fink is a Contributor at FanGraphs. You can follow him on Twitter @DevanFink.
This is an over simplification. It’s not three non-homer hits vs. two homers. Scherzer’s rate of infield flyballs has significantly dropped and his babip against is currently about 100 points higher than his average over the last four years. His barrel% at Statcast is almost two percentage points higher than his career avg, his avg exit velocity is 2mph higher than his career avg, his XBA, XSLG, and XWOBA are all higher, and his statcast hard hit rate is about 8 percentage points higher than his career avg