Memorial Day as a Natural Checkpoint

At some point during the baseball season, it’s no longer “early.” I think you know exactly what I’m talking about. When an unexpected team starts out hot — a la the Mariners, who started 2019 on a 13-2 tear — the response of most rational baseball fans is that “it’s early.” For Seattle, the idea that it was far too early to evaluate the true talent level of the team was absolutely correct. From April 12 on, the Mariners are 10-26 and have sunk to last place in the AL West. Natural regression happened.
Because of the randomness and variation that often does occur during small samples within the marathon baseball season, it’s an old adage to avoid checking the league standings until Memorial Day. Clearly the idea behind this theory is that around Memorial Day, every team has played at least a quarter of their season. With that in mind, the results we have witnessed thus far become significantly more meaningful, and it’s no longer “early.”
I decided to set out and check this theory. Just how accurate are the standings on Memorial Day? Is there hope for a team like the Nationals, who have struggled thus far but still remain a talented squad on paper, to come back? Let’s break down the general trend while also talking about some of the biggest outliers (in both directions) in recent memory.
My process for this study was fairly simple. I collected every team’s record on Memorial Day from 2010 to 2018 and compared it to their record at the end of the season. This gave me a sample size of 270 baseball seasons, all of which occurred in relatively recent memory. I plotted the results in a scatterplot, and here it is:
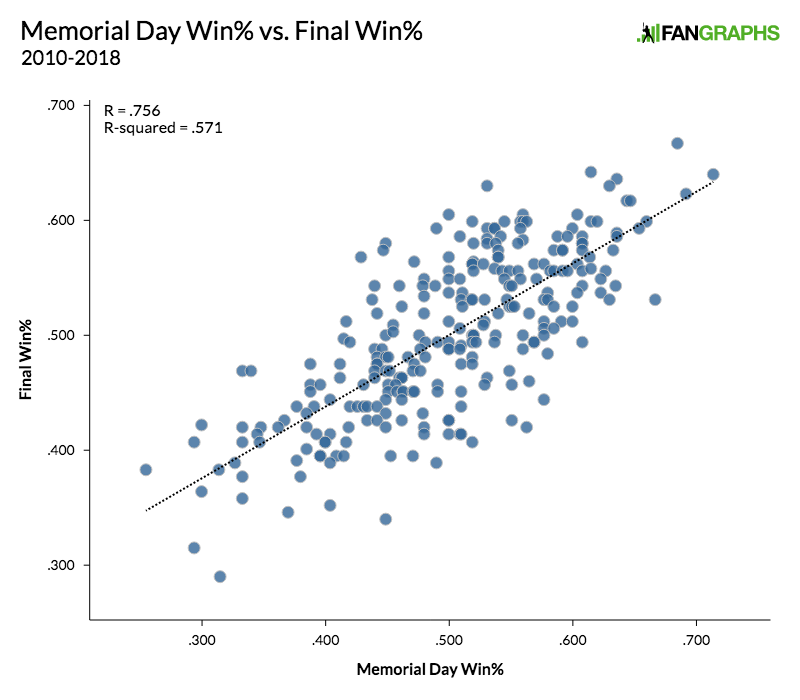
There’s a pretty strong linear correlation here, evidenced by our r-value of 0.756. The r-squared value tells us that the regression equation for Memorial Day winning percentage accounts for 57.1% of the variability in the end-of-season winning percentage. This means that 42.9% of the variability is still unaccounted for, so while Memorial Day certainly tells us something about a team’s end-of-season record, there’s still so much that can change between now and October. This conclusion is what I’d expect.
Even still, here is the regression equation that has been established from the data:
Expected Final Win Percentage = 0.623 * (Memorial Day Win Percentage) + 0.189.
That’s not a surefire projection equation by any means, but it does a decent job at predicting a team’s final record. While I understand that it’s not quite Memorial Day as of this publishing, if we were to use this equation to predict the Nationals’ end-of-season record, for example, we would calculate it in this way:
0.623 * (.396) + 0.189 = .436
A .436 win percentage would result in an approximate 71-91 record.
On the other end of the spectrum, let’s use the Twins, who currently lead baseball with a .667 win percentage:
0.623 * (.667) + 0.189 = .604
A .604 win percentage would result in an approximate 98-64 record.
Neither the Twins nor the Nationals can punch their tickets to a playoff spot or a high draft pick quite yet, however. As I mentioned above, this equation is far from perfect. There’s still over 40% of the variability that it could not account for, meaning that there were plenty of teams who still varied, in both directions, from their expected final winning percentage.
We can make a residual plot in order to demonstrate potential outliers in our dataset. What this will do is plot a team’s winning percentage on Memorial Day versus their residual, which is equal to their Final – Expected end-of-season winning percentage. In basic terms, teams who outperformed compared to their expectation are above zero, and teams who underperformed are below zero:
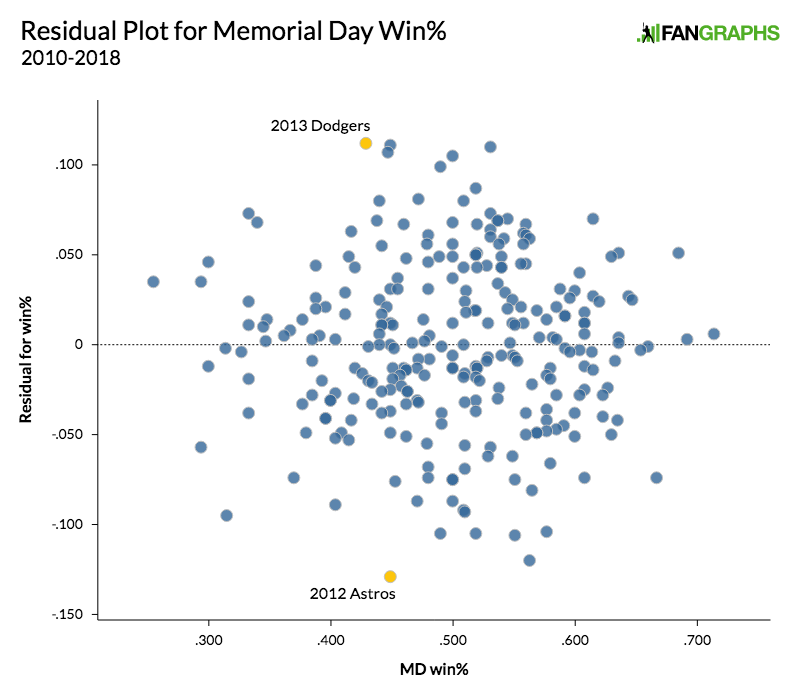
As you can see, most of the data is centered around zero, which is what we would want. However, there are some pretty significant outliers, including the two I’ve indicated with the yellow points: the 2013 Dodgers and the 2012 Astros.
The 2013 Dodgers struggled at the beginning of the season. On May 27, the team defeated their crosstown American League counterpart, the Angels, in an 8-7 thriller. In the bottom of the seventh, Jerry Hairston singled off of Robert Coello to give the Dodgers the lead for good. They improved their record to 21-28, good for a .429 winning percentage on Memorial Day. Our regression equation would expect the Dodgers to finish at .456, or just about 74 wins. A scorching second half (45-23) led the Dodgers to a 92-70 record and a .568 win percentage, 112 points higher than the expectation.
That should give Nationals fans at least some hope, though a 112-point improvement on their current expectation would only result in 89 wins. I’m not sure that will be enough to win a playoff spot in the National League, but it would certainly give them a shot. Still, it’s worth remembering that this is probably the absolute best the Nationals could do, which is a little alarming, to say the least. If the Nationals want to even reach 81 wins, they’d still need to outpace their projection by 64 points of winning percentage, something only 23 of the 270 teams (about 8%) were able to do. That’s just to reach .500, mind you. Things don’t look great in D.C.
On the flip side, consider the 2012 Astros. On May 28, the Astros had a doubleheader and lost both games at Coors Field in Colorado, extending their losing streak to four games. They would go on to lose four more games before picking up a win back in Houston, but their fate was already set in stone. On Memorial Day, the Astros finished the day with a .449 winning percentage, but they finished the season with a putrid .340 win percentage (55-107), 129 points lower than their expectation of .469.
It would be unfair to compare the 2019 Twins to the 2012 Astros. The 2012 Astros were not trying their best to win, and the results were clear. Still, let’s use them as a worst-case scenario. Consider that everything goes poorly for the Twins, and they somehow manage to underperform their projected win percentage by 129 points. That would result in a .475 winning percentage, or just 77 wins.
That’s not a horrible low-end, worst-case scenario for them. But let’s say that they play to a .556 win percentage, which would result in a 90-win season. That would mean they underperform their expectation by 48 points, something only 42 of our 270 teams (about 16%) have managed to do. For fun, let’s lower that further to an 87-win season, a mark that could realistically still secure a playoff spot in the American League. This would mean that the Twins play to a .537 full-season win percentage, or 67 points lower than the expectation. Only 23 teams (about 9%) have done that. With that in mind, it seems pretty safe to say that the Twins should be in playoff contention by the end of the year.
All in all, if you don’t want to check the standings until Memorial Day, I get it. Stabilization is a process that occurs with every additional game that is played. Obviously, the more information we have about a team, the better. But nothing is set in stone until all 162 games have been completed. Right now, your favorite team might be the best in the league, or they could be cellar-dwelling. However, I remind you that there is still plenty of time for the course to be reversed. Even if the odds look low, teams have done it before, and teams will certainly do it again.
Devan Fink is a Contributor at FanGraphs. You can follow him on Twitter @DevanFink.
This reminds me of Jeff Sullivan’s “How Best to Predict the Second Half” article, where Pythagorean outperformed actual record and the projections outperformed both. Generally all three of them line up pretty well, although the fact that actual record is the worst predictor bodes poorly for the Pirates and better for the Reds.
It’s worth noting that in season projections are better and have a bit more movement now. Go to Bellinger, Yelich or Alex Gordon’s player pages and turn on projections. You can compare preseason full year to the ROS projection. ZiPs for example now projects Bellinger for a 155 wRC+ for the rest of the year, it had him at 138 preseason.
Not a lot of teams will consistently move in one direction in those but a few might, especially the twins.