
Michael Conforto’s Barreled Balls Weren’t Ideal
I did a presentation in Arizona this weekend for First Pitch Arizona, an event at the Arizona Fall League hosted by BaseballHQ. The presentation served as an introduction to spin rates and exit velocity and so on. I examined the new stat from our friends at Statcast — Barrels — and how Michael Conforto does well by that stat, which attempts to combine exit velocity and launch angles to credit players who make dangerous contact. On the way out, someone asked me, basically: “So if he’s good at barreling the ball, what happened last year? What went wrong on those barrels?” There’s an easy answer and a hard answer.
The easy answer is that even players who are good at barreling the ball don’t barrel it all that often. Conforto is in the top 75 when it comes to barreling, and he barreled only about 11% of his batted balls this year. The elite guys this year — Gary Sanchez, Khris Davis, Nelson Cruz, Chris Carter and Mark Trumbo — barreled the ball around 18% of the time when they put the ball in play. Even among that group, there’s another 80% of batted balls unaccounted for.
That mirrors the difference in home-run rate, sort of. The top two in homers — you might recognize Trumbo and Davis — have a 7% home-run rate, about double that of the 75th guy, Andrew McCutchen (3.5%). But in the gaps between them, you still find interesting players. Conforto, for example, would have been 84th in home-run rate had he qualified, a little worse than (but still comparable to) his barreling rate.
He’s been unlucky, maybe. Barreled balls produced a .822 batting average and a 2.386 slugging percentage as a group, while Conforto hit .714 with a 2.143 slugging percentage on his barrels, which was third worst among players with 20 barrels in play.
| Rank | Player | Slugging Percentage | Bases / Barrels |
|---|---|---|---|
| 136 | Joe Mauer | 2.100 | 42 / 20 |
| 135 | Tyler Flowers | 2.136 | 47 / 22 |
| 134 | Michael Conforto | 2.143 | 45 / 21 |
| 133 | Victor Martinez | 2.147 | 73 / 34 |
| 132 | Kole Calhoun | 2.160 | 54 / 25 |
| 131 | Howie Kendrick | 2.227 | 49 / 22 |
| 130 | Matt Carpenter | 2.256 | 88 / 39 |
| 129 | Buster Posey | 2.300 | 69 / 30 |
| 127 | Nick Markakis | 2.333 | 49 / 21 |
| 128 | Adam Jones | 2.333 | 84 / 36 |
It’s sort of amazing to consider that a man with a slugging percentage over 2.000 might have been unlucky on that group of balls in play, but then you consider that the leader here, Jedd Gyorko, averaged 3.7 bases per barreled ball in play. Basically a homer per barrel. Conforto, meanwhile, was putting up doubles.
You could say that not all barrels are created equal and be done with it. Gyorko averaged a 27.7-degree launch angle and 103.8 mph. Conforto, by comparison, was a bit more line-drivey, with a 25.5-degree average angle and 104.9 mph exit velocity. Still, for the difference between the guy with the most bases per barrel in play and the guy with the third least, it doesn’t seem like a big deal.
Maybe a look at a few of Conforto’s barreled outs will tell us more.
Here he is with an oppo drive against Corey Kluber early in the season.
Again, abother oppo drive, but this time off Felipe Lopez at home.
Uh oh. Oppo again. This time off Stephen Strasburg.
Here’s the pulled ball, a frozen rope off of Jose Fernandez RIP.
That last one seems like just a good defensive play. Probably not much to be learned there.
The other ones raise at least a couple questions, though. Like: does horizontal spray angle mean anything? And: are opposite-field barrels less great than pulled barrels, even with equal launch angles and velocity? It turns out… maybe!
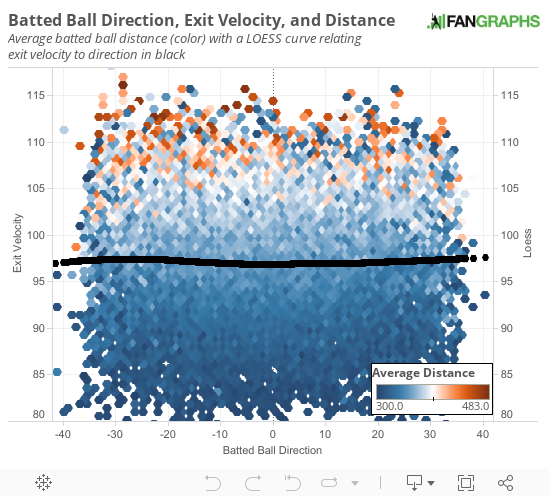
With the help of Sean Dolinar, who ran a LOESS curve on 2015’s batted-ball statistics to see if exit velocity was higher in the corners than down the middle, it looks like we can say that batters make (slightly) harder contact in the pull angles than they do up the middle. If we combine that with a visual that relates exit velocity and spray angle to batted-ball distance, a bit of a picture emerges: the ball goes further, and harder, down the lines. (Zero is straight through to center field.)
Another, much tougher thing to see on those balls is the batted-ball spin. We know from Alan Nathan that batted-ball spin can have some impact on the ball, so Dolinar and I tried a multiple linear regression to relate air density, launch angle, exit velocity, batted-ball direction, and batted-ball spin to actual distance. The results looked significant (p value <2.2e-16) and showed improvement when batted ball spin and direction were included (.484 r-squared). Here’s the equation:
Batted Ball Distance = 511.1 – 65.7(Air Density) – 15.8(Launch Angle) + .002(Exit Speed ^2) – .103(Direction) + .167(Spin)
Basically, an extra 100 rpm of spin on the batted ball is worth about a degree of launch angle. An approach that started with physics, like those that Nathan espouses, are probably better than a statistics-only approach because they model the actual ball in flight and use science to build the model. My main takeaway from this is that spin and direction add important information if our goal is to predict batted-ball distance.
Barrels are awesome, but there are a few factors that may influence the outcomes of even those best of batted balls. The direction in which the hitter sprays the ball and the spin he imparts on the ball: those things may be important.
The problem is that these factors may not be under the control of the hitter. Batted-ball spin is a question of millimeters on the ball, and the direction of the ball is profoundly influenced by the location of the pitch.
So, in the end, barreling the ball is great. If Conforto continues to barrel the ball as he has, he should have better outcomes on those in the future. Some barrels may be slightly better than others, but having a process that leads to barrels is always a good thing for a power hitter.
With a phone full of pictures of pitchers' fingers, strange beers, and his two toddler sons, Eno Sarris can be found at the ballpark or a brewery most days. Read him here, writing about the A's or Giants at The Athletic, or about beer at October. Follow him on Twitter @enosarris if you can handle the sandwiches and inanity.
I will never look at the word “barrel” the same way again.
Perhaps I missed it, but the “same ball” (as in same exit speed and vertical angle and distance) would have a better result down the line than to center (because of the distance to the wall), right? But how much difference does that make? As in if he hits a 100mph ball that goes 375 feet to center every time, he might get a couple lucky, wind-aided home runs, but that same hit down the line is a home run every time.
Is there a way to track and use this data to see if that was an issue for some players? Is that the point you were trying to make with the last graph?
The equation suggests that yes, direction and spin matter to the distance. I’m unsure about beating my chest about some sort of finding because someone like Nathan would understand the physics better, but it may have to do with slicing and angles. Maybe the balls with slice down the line end up foul and not in play?
Per figure 4 in Nathan’s article here: http://www.fangraphs.com/blogs/spinning-out-of-control/ , well struck opposite field hits tend to slice (ie more sidespin) more than pulled balls (at least between 20° and -20° initial trajectory, it looks like there are very few well hit balls that are more “oppo” than 20°)
I messed around with Nathan’s calculator and compared balls with 26° launch angles and 103mph exit speeds.
Dead center, no sidespin, 4600rpm backspin = 422 feet
Pull, initial horizontal angle = 17°, 4490rpm backspin, 981 rpm sidespin = 419 feet
Oppo, initial horizontal angle = -17°, 3250rpm backspin, 3250 rpm sidespin = 395 feet
Don’t ask me how I came up with the spin rates (trial and error + a lot of reading Nathan’s papers), I think there’s a good chance they are realistic though.
As I said before, there are very few well hit balls with an initial direction above 20° (ie well oppo) in figure 4 in the article I cited above. So either Statcast can’t capture those for some reason, or they just don’t happen often at all (which makes intuitive sense to me). So if you’re hitting balls hard “oppo”, they are likely more center-oppo than line-oppo, which is the bigger part of the ballpark and thus harder to hit HRs (as phoenix2042 hypothesized).
So having an oppo oriented swing/approach looks like a double whammy – it’s tough to hit something hard down the oppo line, and hard hit oppo balls won’t go as far as an equally hard hit pulled ball.
Great, an article about a guy who got 2.26 fewer hits than average over 21 balls in play!
That was the entry point! Then we discovered that batted ball direction and spin are important. Which, if you ask me, is super interesting.