
MLB Payroll Probably Isn’t Going Back Up in 2019
In 2018, for the first time in more than a decade, player salaries went down from the previous year. At one point, there was some thought that this offseason’s free agent class might reverse the course charted last offseason. For years, we’ve been hearing about the monster class of free agents that would sign this winter. Here’s Jeff Passan back near the beginning of the 2017 season:
For those who have yet to hear about the free-agent class of 2018-19, here’s a sampling: Bryce Harper, Manny Machado, Clayton Kershaw, Josh Donaldson, Daniel Murphy, Dallas Keuchel, Charlie Blackmon, Andrew Miller, Zach Britton, Craig Kimbrel. There are dozens more. Teams will guarantee $3 billion to players that winter. The number could exceed $4 billion.
Two years later, that free agent class isn’t quite as good as we expected. When we put up our Top-50 free agents, along with crowdsourced contract expectations, the expected outlay to 66 potential free agents didn’t come close the $3 billion assumed; the crowd predicted a number that was just about half of $4 billion that was thought possible about 20 months ago. Our readers provided estimates for 66 players, including Joe Mauer and Adrian Beltre, who have since retired. Of the remaining 64 players, 36 have signed contracts so far. Here’s how the contract totals compare to the crowdsourced average.
| Name | Signing Team | Proj WAR | Crowd Average | Contract Total | Difference |
|---|---|---|---|---|---|
| Patrick Corbin | WSN | 3.5 | 102.3 M | 140 M | 37.7 M |
| Nathan Eovaldi | BOS | 2.7 | 44.5 M | 68 M | 23.5 M |
| Andrew McCutchen | PHI | 2.9 | 43.1 M | 50 M | 6.9 M |
| Zach Britton | NYY | 1.1 | 31.8 M | 39 M | 7.2 M |
| J.A. Happ | NYY | 2.8 | 32.6 M | 34 M | 1.4 M |
| Michael Brantley | HOU | 2.4 | 42.2 M | 32 M | -10.2 M |
| Charlie Morton | TBR | 2.8 | 32 M | 30 M | -2 M |
| Jeurys Familia | NYM | 1.0 | 33 M | 30 M | -3 M |
| Lance Lynn | TEX | 1.6 | 27.3 M | 30 M | 2.7 M |
| Andrew Miller | STL | 1.3 | 26 M | 25 M | -1 M |
| Joe Kelly | LAD | 1.0 | 16.1 M | 25 M | 8.9 M |
| DJ LeMahieu | NYY | 2.0 | 41 M | 24 M | -17 M |
| Daniel Murphy | COL | 1.9 | 29.6 M | 24 M | -5.6 M |
| Josh Donaldson | ATL | 4.2 | 57.8 M | 23 M | -34.8 M |
| David Robertson | PHI | 1.4 | 26.3 M | 23 M | -3.3 M |
| Jed Lowrie | NYM | 2.1 | 26.8 M | 20 M | -6.8 M |
| Wilson Ramos | NYM | 2.2 | 35.6 M | 19 M | -16.6 M |
| Anibal Sanchez | WSN | 1.7 | 11.8 M | 19 M | 7.2 M |
| Yasmani Grandal | MIL | 3.2 | 51.6 M | 18.3 M | -33.3 M |
| Kelvin Herrera | CHW | 0.4 | 24.8 M | 18 M | -6.8 M |
| Hyun-Jin Ryu | LAD | 2.0 | 35.6 M | 17.9 M | -17.7 M |
| Garrett Richards | SDP | 0.0 | 17.4 M | 15 M | -2.4 M |
| Joakim Soria | OAK | 0.9 | 14.8 M | 15 M | 0.2 M |
| Nelson Cruz | MIN | 3.2 | 28.2 M | 14.3 M | -13.9 M |
| Matt Harvey | LAA | 1.0 | 14.7 M | 11 M | -3.7 M |
| Kurt Suzuki | WSN | 1.3 | 10.1 M | 10 M | -0.1 M |
| Brian Dozier | WSN | 2.2 | 31.9 M | 9 M | -22.9 M |
| Trevor Cahill | LAA | 1.3 | 14.5 M | 9 M | -5.5 M |
| CC Sabathia | NYY | 1.2 | 10.7 M | 8 M | -2.7 M |
| Ian Kinsler | SDP | 1.7 | 11.8 M | 8 M | -3.8 M |
| Jesse Chavez | TEX | 0.6 | 7.5 M | 8 M | 0.5 M |
| Trevor Rosenthal | WSN | 1.2 | 9.9 M | 7 M | -2.9 M |
| Steve Pearce | BOS | 1.2 | 10.5 M | 6.3 M | -4.2 M |
| Jonathan Lucroy | LAA | 1.9 | 10.4 M | 3.4 M | -7 M |
| Lonnie Chisenhall | PIT | 0.9 | 10.4 M | 2.8 M | -7.6 M |
| Brian McCann | ATL | 1.0 | 10.1 M | 2 M | -8.1 M |
| TOTAL | $984.7 M | $838 M | -$146.7 M |
So far, free agents have signed for roughly 15% less combined than predicted. It’s interesting to note that the discount is being taken almost entirely in the length of the contracts, as both the predicted and actual AAV are around $12 million. Now that many players have reached agreements to avoided arbitration and a good number of players have signed free agent deals, we can take a look at where teams’ Opening Day payrolls stand at this point in the offseason. There are obviously a few huge contracts to go, with five of the top six contract projections still unsigned, so these numbers are nowhere near final. As of this writing, here’s what Opening Day payrolls look like for every team.
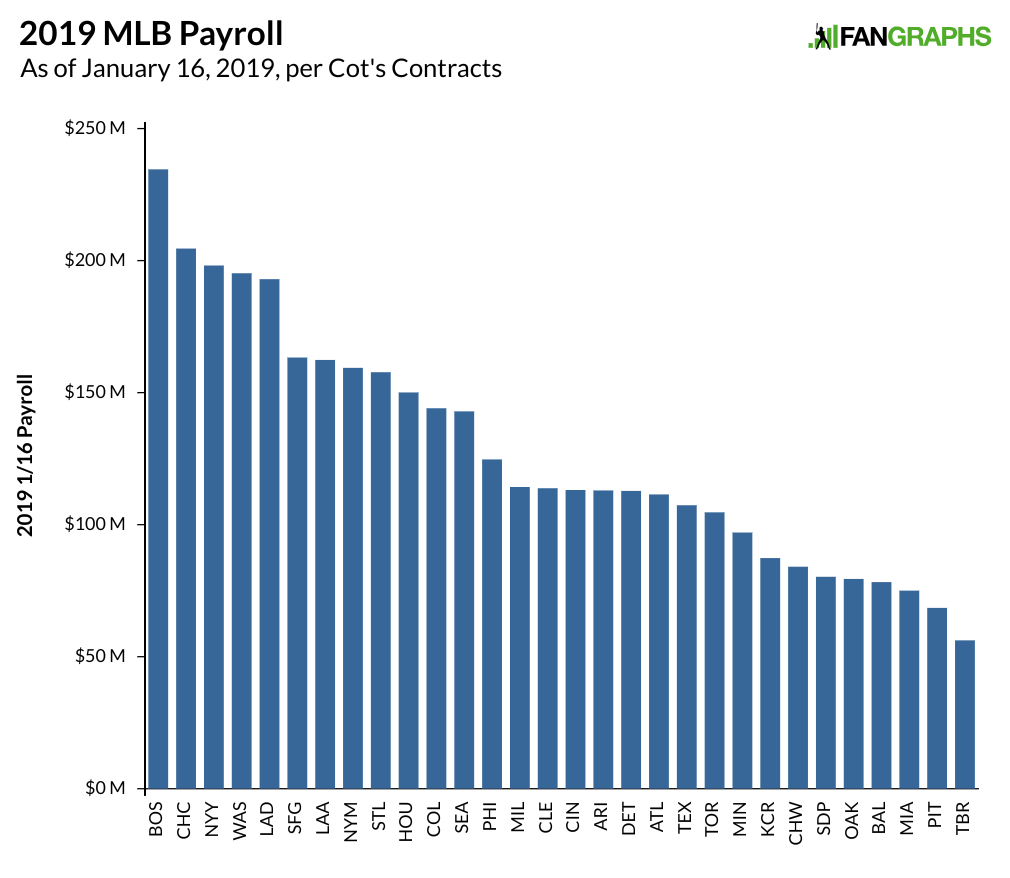
The Red Sox are well out in front of everybody, just like they were last season. The Cubs payroll is up compared to where it was. It might be somewhat difficult, if not impossible, to tell how every team’s payroll has moved based on the graph above. For reference, here’s a graph showing each team’s change in payroll from Opening Day last season.
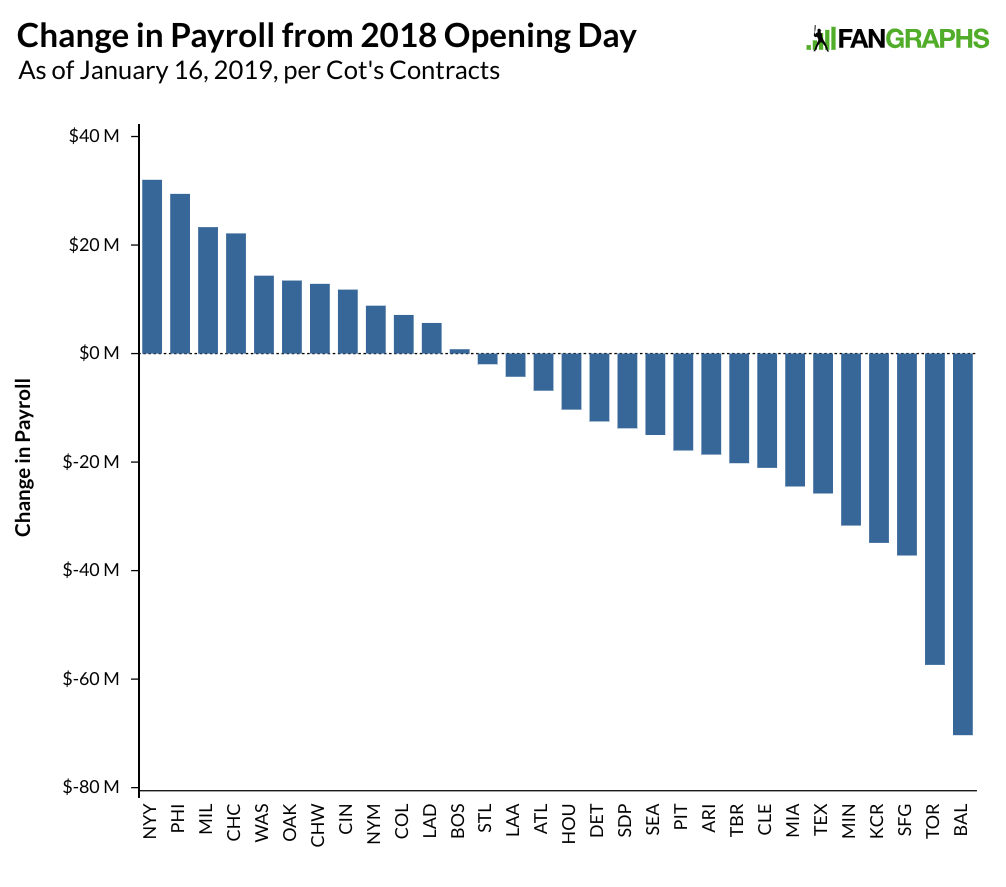
Some of this will change in the coming months, though a lot of those teams at the bottom aren’t really expected to move the needle much. Last year’s Opening Day payroll average came in at around $136 million. Keep in mind, these numbers don’t include benefits or players on the 40-man roster. Last year, the end-of-season payroll average including those numbers went up to around $152 million. Right now, the average 2019 Opening Day payroll comes in at close to $128 million. In total, the difference between last year’s combined Opening Day payrolls and payrolls right now is $243 million. If we take a look at how much spending is left to be done, we might be able to approximate payroll for next season.
Here are the remaining crowdsourced free agents, their projected total salaries and the average annual value of each deal.
| Name | Proj WAR | Crowd Avg Years | Crowd Avg Total ($M) | Crowd AAV ($M) |
|---|---|---|---|---|
| Bryce Harper | 4.9 | 9.1 | $300.0 | $33.0 |
| Manny Machado | 5 | 8.6 | $272.9 | $31.7 |
| Dallas Keuchel | 3.3 | 4.2 | $81.0 | $19.4 |
| Craig Kimbrel | 2.1 | 3.9 | $62.2 | $16.1 |
| A.J. Pollock | 3.1 | 3.7 | $58.8 | $16.0 |
| Mike Moustakas | 2.8 | 2.8 | $34.3 | $12.2 |
| Adam Ottavino | 0.8 | 2.6 | $27.0 | $10.3 |
| Marwin Gonzalez | 1.8 | 2.9 | $29.5 | $10.1 |
| Jose Iglesias | 1.7 | 2.8 | $25.6 | $9.1 |
| Gio Gonzalez | 0.8 | 2.3 | $26.4 | $11.6 |
| Nick Markakis | 1.1 | 1.9 | $19.9 | $10.8 |
| Adam Jones | 1.2 | 1.9 | $18.7 | $9.9 |
| Asdrubal Cabrera | 2 | 2.1 | $20.4 | $9.6 |
| Cody Allen | 0.5 | 2.3 | $20.5 | $9.0 |
| Wade Miley | 1.1 | 1.9 | $15.9 | $8.5 |
| Josh Harrison | 1.2 | 1.9 | $14.5 | $7.5 |
| Freddy Galvis | 0.3 | 2.1 | $15.1 | $7.2 |
| Brad Brach | 0.1 | 2.0 | $15.0 | $7.5 |
| Justin Wilson | 0.1 | 2.1 | $12.2 | $6.0 |
| Martin Maldonado | 1 | 1.8 | $10.7 | $5.9 |
| Carlos Gonzalez | 1.3 | 1.5 | $10.9 | $7.3 |
| Ryan Madson | 0.1 | 1.2 | $6.9 | $5.8 |
| Clay Buchholz | 1 | 1.4 | $9.3 | $6.6 |
| Jeremy Hellickson | 0.4 | 1.5 | $9.2 | $6.2 |
| Greg Holland | 0 | 1.3 | $7.4 | $5.8 |
| Tony Sipp | 0 | 1.2 | $5.9 | $4.8 |
| Shawn Kelley | 0 | 1.2 | $5.4 | $4.5 |
| Zach Duke | 0 | 1.2 | $4.7 | $3.9 |
| TOTAL | 73.3 | $1140.3 M | $296.1 M |
If the crowd is correct and $296 million in salaries are added to the 2019 season, we’ll be looking at around a $50 million increase over last season. That probably won’t happen, though. Last season when I did this same exercise, I was overly generous in my estimates, giving the players the crowdsourced money, and adding in another $60 million for all the other players for whom we did collect estimates. By the time Opening Day rolled around, I was more than $100 million off, and instead of a potential 1% increase in payroll, teams moved down 1% from the previous year.
If the rest of this offseason is anything like the remainder of last offseason, we are going to be looking at flat Opening Day payrolls. Even more troublesome for the players is that while Opening Day payroll was down about one percent from 2017 to 2018, when the end of season numbers were calculated, that figure was closer to 2.5%. While not definitive yet, there seems to be a pretty good possibility that major league payrolls will go down for the second consecutive season.
Craig Edwards can be found on twitter @craigjedwards.
this doesn’t account for inflation either
which is ummm higher? than reported
Firstly, baseball revenues probably operate in jumps that are not directly related to overall measures of inflation. Labor expenditures will be influenced mostly by those shifts in revenue. But if you are thinking about it from the point of view of the players, do you think the CPI is the best measure of inflation for people making at least $550,000 per year? And secondly, why is it higher than reported?
We now used chained CPI, which assumes that consumers will jump to comparable goods when prices of favored goods rise, and furthermore that there’s essentially zero loss of utility in having to switch away from favored goods. I imagine at major league player salaries, substitution won’t happen much, meaning that the players (and all wealthier folks) experience higher inflation than official CPI figures.
Most importantly, team revenues have risen substantially each of the past two years, while player salaries are falling. And this is on top of a several year trend of corrosion of the percentage of league revenues going to the players.
We are on a crash course for a major strike before the next CBA is signed.