Pitching Is Winning Baseball’s Latest Tug of War
If you want to paint with an extremely broad brush, you can think of the last twenty years of analytical advances in baseball as waves, alternately benefiting hitters and pitchers. First came the Moneyball years, when sabermetric advances brought offense into the game. It wasn’t just that teams started playing more beefy guys who could hit for power and take a walk. They also encouraged their existing players to be more patient — that’s how you got the iconic four-hour Yankees-Red Sox games of the mid-2000s, in which both teams seemed to make a personal challenge out of who could take more pitches. This coincided with the beginning of the end of the sacrifice bunt, yet another boost to offense.
If it first seemed like every analytical advance increased offense, however, the tables quickly turned. First the Rays realized that newly offense-minded front offices were undervaluing defense. Then they turned to infield shifts. Before long, the Pirates were using data to optimize pitch selection and every team was hunting high and low for pitch framing. If the early 2000s were all about using math to find better ways to hit, 2008 to 2014 was about using data to strangle offense from every angle.
Things have started moving more quickly since then. Batters reacted by trying to lift the ball more, helped out by a livelier baseball. Pitchers tried throwing higher in the zone to counter that, and at the same time teams started working with pitchers to tailor arsenals to their innate spin rates and pitch shapes. It’s not stopping here — batters are going to work to counter pitchers’ new arsenals, and defenses are going to work to find new and better shifts.
For all this back and forth though, I think that the long game favors pitching. The reason is that, to my mind, batting is a game of picking on weaknesses. Teams don’t get their offense against the aces and the tough part of the bullpen, or in lefty-lefty matchups. They pick on tiring pitchers, righties pitching to lefties, or relievers pitching their third game in three days. It’s always been this way — offense spikes in expansion years when the pitching pool gets diluted, and the times-through-the-order penalty has always existed.
If that’s where offense has always been generated, however, then batters are in trouble. Pitching staffs across baseball are shoring up weak points like never before, and there’s not much offenses can do about it aside from just hit better. It’s still April, but it’s almost a guarantee that two pitching trends are going to reach all-time extremes this year. You’ve probably heard of the first one: starters will face batting orders for a third or fourth time less than ever before. The second one is more subtle, but it’s affecting offense just the same. So far in 2019, batters have faced opposite-handed pitching only 51% of the time, a record low.
Let’s handle the times through the order trend first. The effect isn’t novel — I learned about it from The Book, but the general concept has existed much longer than that. Ted Williams talked about it in The Science of Hitting, and it’s not some deep secret. The more looks a batter gets at a pitcher, the better he sees the pitches. It’s not clear whether pitcher fatigue adds to the penalty, but either way it’s not a small effect. In 2018, starting pitchers allowed a .304 wOBA the first time through the order and a .336 wOBA the third time through. That 32-point wOBA swing is about the same as the difference between the 2018 Yankees offense and the 2018 Royals offense. It’s a big deal, in other words.
While baseball analysts have long known about this penalty, teams have ramped up their efforts to avoid it markedly in recent years. The 2018 Rays re-introduced the idea of an opener who would prevent batters from seeing any pitcher three times, and they weren’t alone in using it. While the Rays faced a league-low percentage of batters the third time through, other analytical (and starting-pitching light) teams like the Brewers and A’s weren’t far behind. Quick methodological note: I’m folding in the fourth time through the order in this section for ease of calculation. Fourth-time-through plate appearances are rare, but they do exist.
If you want to know how quickly this trend is catching on, consider this: 16% of all pitches Rays starters threw last year were thrown by someone facing the order a third time. That was miles lower than the overall league average of 23% — the Rays, after all, are pioneers. It’s still April, so outliers are more prominent at this time of year, but that 16% mark would be only the fifth-lowest in baseball this year. The Rays are down to 15.3% third-time-through pitches, but the Angels, Padres, and Orioles have all leapfrogged Tampa Bay.
It’s striking to see the league switch so uniformly towards this trend, because it was a known and ignored penalty for a long time. From 2008 to 2014, the percentage of third-time-through batters starters faced stayed more or less stagnant around 29%. From there, though, the bottom has fallen out:
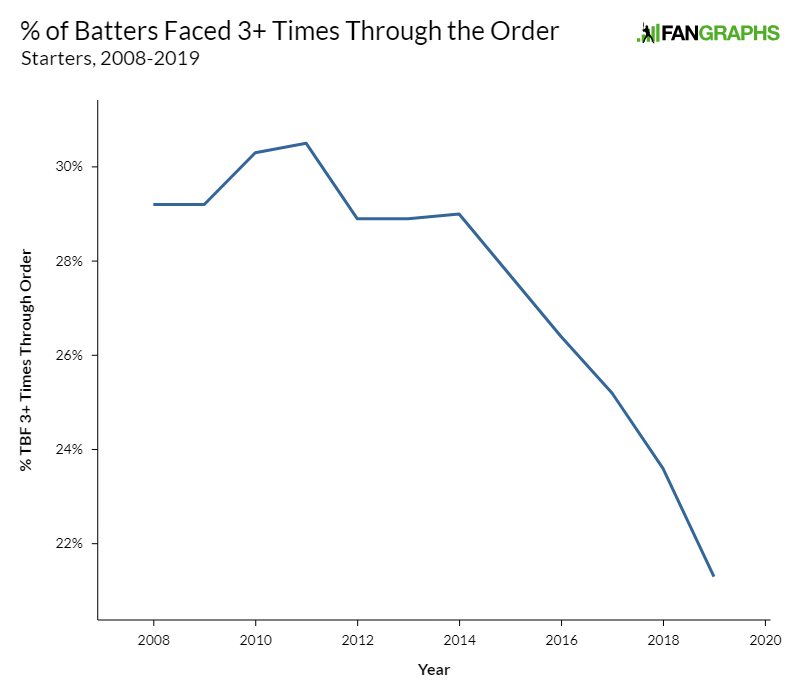
If this year’s start holds true for the full season, it will mark the fifth straight year that this ratio has fallen by 1% or more. That’s a stark change after seven years of flatline. However, even as pitchers face less batters, they continue to perform poorly when facing them for a third or fourth time. Take a look at the FIP gap between the first time through and the third time through. It has remained the same (or even widened a bit) in the past 10 years:
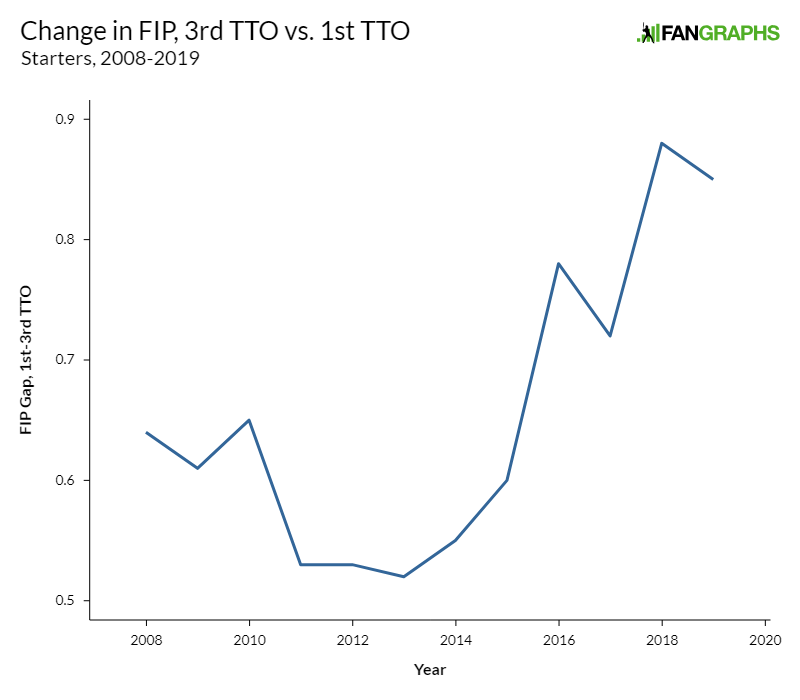
What does this mean? Well, think of a league-average pitching staff in 2018. They allowed a .304 wOBA the first time through, .316 the second time through, and .336 after that. At 2008 ratios, that works out to a .318 overall wOBA. Just by changing their third-time-through mix to 2019 levels, they could lower that number to .315, without their talent level changing at all. That might not sound like a huge change, but it adds up.
If you watch baseball, it’s impossible to miss this change teams have made in how they treat pitchers. Virtually every announcing crew starts bringing up pitch counts and relievers towards the end of a pitcher’s second time through the order. It’s a compelling narrative: the laboring hero, struggling to fight off just a few more enemies. Everyone focuses on it — it’s the throughline of the game, and the recent change has made certain that old-school announcers grumble about shorter outings almost every night.
The continual decline of the platoon advantage isn’t like that. There’s no overarching narrative, no main actor to key off of. Over the course of the game, some batters are exceedingly lucky and get to face opposite-handed pitchers. Some are exceedingly unfortunate and have to face same-handed pitchers. The effect matters a ton. From 2008-19, right-handed batters have enjoyed a 17-point wOBA boost when getting to face a lefty instead of a righty. Lefties have done even better — their wOBA differential between having the advantage and not was 31 points.
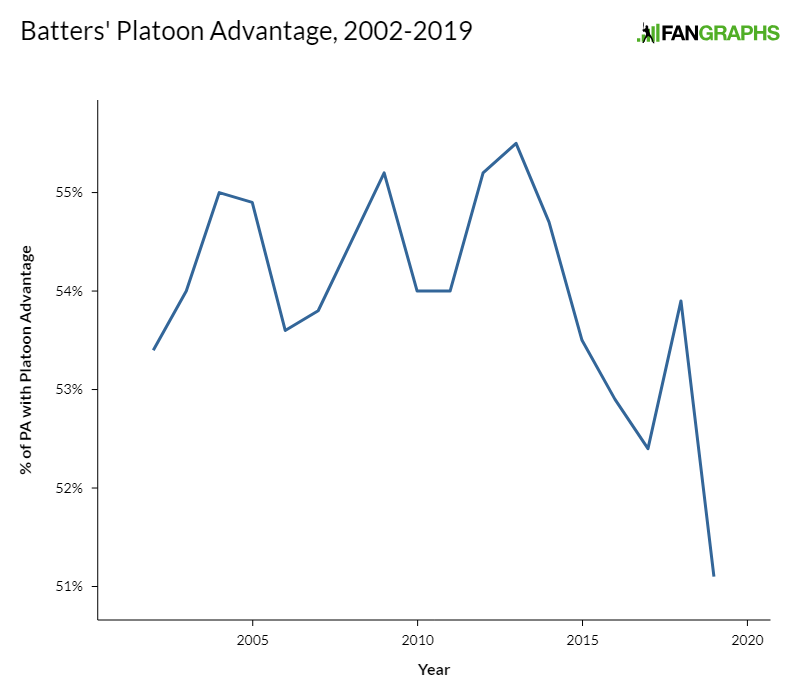
While hitting with the platoon advantage is a huge edge, how often it has happened has changed throughout different eras. In the early 1990s, more than 60% of batters enjoyed a platoon advantage. Smart teams got that number even higher by mixing and matching lineups depending on the handedness of the opposing starter.
Fast-forward to today, and 60% sounds far-fetched. In 2018, batters enjoyed the platoon advantage 53.8% of the time. That was low, but not the lowest on record — 2017 had been a record low at 52.4%. This year, however, we’ve hit a new extreme, with only 51% of batters have the platoon edge:
This change is inextricably linked with the fact that starters are throwing fewer innings. When a starting pitcher is in the game, the batting team is doing the platoon determination. They set their lineup, and the pitcher faces them all. If you’re the Dodgers, you might run out a five-lefty lineup against a right-handed pitcher and a six-righty lineup against a southpaw. It’s all up to the hitting team, and a deep team with multiple options can have the platoon advantage quite often if they want it.
When it comes to relievers, however, the shoe is on the other foot. The lineup is fixed, and pitchers need only navigate bite-size chunks of it. Have a three-lefty segment coming up? Bring in the specialist. Three righties out of the next four batters? Go with your power right-handed arm. Given that relievers are throwing an all-time high percentage of innings, the pitching team is in the matchup determination driver’s seat more often than ever. The platoon advantage is a victim of circumstance, in other words, and it’s not likely to recover to its early-2010s levels, much less the unthinkable 60% of the early 1990s.
What does this mean for hitters? We can do some quick analysis. Think of every hitter not as having one true-talent wOBA, but two: one against same-handed pitchers and one against opposite. To resolve that into a single number, you weight the two by how many plate appearances they get.
Take righties, for example. The average right-handed hitter (using 2008-19 statistics) was a .310 wOBA hitter against righties and a .327 hitter against lefties. At the recent high in righty platoon advantage, 2012, they had the edge 37% of the time. This would work out to a .316 wOBA overall. They don’t get the platoon advantage 37% of the time anymore, though — they get it only 30.8% of the time. That costs them a point of wOBA, and their true talent hasn’t changed at all.
Now, these numbers might not seem large. Teams are stealing three points of wOBA here, one or two there. None of it seems drastic — it’s picking up pennies in front of a steamroller, essentially. Consider this, though. 2014 was the nadir of offense in the 21st century. Only 19,761 runs were scored, the lowest total since 1995. The ball wasn’t yet juiced, and the sinkers were flowing like wine. League-wide wOBA that year was .310.
By 2017, nothing felt the same. Home runs were leaping out of parks like salmon. 22,582 runs scored, a massive increase. Offense was back! League-wide wOBA that year? A whopping .321. 2014 and 2017 feel like different eras. One was phenomenally low-scoring, one was defined by fifteen guys you’d never heard of each hitting 20 dingers. That whole paradigm-shifting gap was 11 points of league-wide wOBA. These little advantages add up.
Analytics are changing baseball, and they’re not going to stop anytime soon. For the most part, a tug-of-war analogy works well. Offenses figure things out, and pitching staffs counter that, endlessly in a loop. That’s not what’s going on here, though. Offenses don’t yet have a counter to not exposing a pitcher his third time through a lineup. They can’t counter having to face same-handed pitchers more. All they can do is slog through and try to keep hitting, even as they’re put at more of a disadvantage.
It’s not strategy; it’s math. It’s not going to stop, either. Analytical front offices are everywhere now, and they’re getting more power over decisions on the field. These aren’t hard decisions; They’re nearly automatic. Pitching staffs can adjust strategy to prevent runs essentially for free, and the only thing stopping them from doing it more is convincing pitchers and coaches that it makes sense. You should expect more of this pattern in the months and years to come. The optimizers are here, and they’re sanding out the weaknesses and rough spots of pitching.
Ben is a writer at FanGraphs. He can be found on Bluesky @benclemens.
Won’t this change next year when the minimum batter rule goes into effect? Those lefty on righty matchups are going to come back when you know that you can stagger your lineup knowing that everyone has to face at least 3 batters.
It’ll be interesting to see how much the reliever landscape will change, especially during free agency.