Predicting Secondary Market Prices for ALDS/NLDS Tickets

So far this October, we have been treated to some great playoff games. Most of us watched these games at home in our living room, or perhaps at the local sports bar. A select few of us have had the chance to watch the games live at the stadium. Due to the high demand for playoff tickets, most teams conducted some type of lottery to determine who gets to purchase tickets at face value. Those who aren’t lucky enough to win the lottery can still get into the stadium by purchasing tickets on the second-hand market.
Perhaps unsurprisingly, there is a lot of variation in the second-hand cost of playoff tickets between the different teams. There are many factors that go into this variation, including regular season ticket cost and how recently the team has gone to the playoffs, among other things. For example, the Cubs have had the highest playoff tickets prices this year, which is due to the fact that they have a passionate fan base, and that they haven’t been to the playoffs since 2008.
I wanted to see if it would be possible to create a model that predicts the cost of ALDS/NLDS ticket prices based on other factors.
One key of creating this model is to get the actual second-hand playoff and regular season ticket cost of each playoff team. This information often isn’t readily available to the public; however, it’s impossible to create a model without the actual playoff ticket cost. It’s also very difficult to create a model without the regular season ticket cost, as it accounts for many different factors, including fan interest, local population, and stadium capacity.
I was able to find the relevant information on the TiqIQ blog. By wading through the blog posts, I was able to dig up twenty-six ALDS/NLDS data points between 2012 and 2015. What I found, specifically, were the average prices of the home games of each playoff team. This is just enough data to be able to create a viable model. I suppose it would have been interesting to predict ALCS/NLCS and World Series ticket prices, too, but unfortunately there wasn’t enough data available for this.
I first wondered how good a job we could do by predicting ALDS/NLDS prices based only off of regular season prices. Here is a scatterplot of the ALDS/NLDS prices vs. the regular season prices:

There is a somewhat consistent relationship between these two prices, with only one extreme outlier in the upper right corner (which happens to be the 2015 Cubs). Performing a linear regression computation yields the following formula:
Predicted ALDS/NLDS price = 4.13 * (Actual regular season price) – 1.24
In simple English, this formula states that the predicted ALDS/NLDS price is slightly over four times the actual regular season price.
The predicted ALDS/NLDS prices have an error of 39.9%, on average. The R-squared coefficient for this model is 0.339. For those who are unfamiliar with statistics terminology, the R-squared coefficient in a linear regression model is a number between zero and one that describes how well the regression line fits the data. An R-squared coefficient of 0.339 indicates that the model is a somewhat reasonable fit of the data (especially considering the fact that we only had twenty-six data points to work with), and with the average error of 39.9%, we conclude that we can predict prices to some degree.
I wanted to see if I could do better using more information than just the regular season price. After experimenting with many different variables, my final linear regression model consisted of the following seven:
- Regular season ticket price; and
- Regular season win percentage in September and October; and
- Number of playoff appearances in the last five years; and
- Number of home playoff games in the last five years; and
- Number of playoff appearances between six and ten years ago; and
- Number of home playoff games between six and ten years ago; and
- Years since last World Series championship.
The regular season win percentage in September and October is a measure of “hotness” entering the playoffs. I believe that fans are willing to pay more money for tickets to a hot team, since there is a higher level of interest and excitement for the team, which drives up prices. Conversely, fans won’t want to pay as much for a cold team heading into the playoffs.
The number of playoff appearances and number of home playoff games defines the number of years and number of times in the recent past that a fan had an opportunity to see his/her local team in the playoffs. A team that hasn’t been to the playoffs, and hasn’t hosted a home playoff game in a long time (such as the 2015 Cubs and 2015 Blue Jays) will have higher ticket prices, while a team that has been to the playoffs many times in recent years (such as the 2015 Cardinals) won’t command such a high premium. Similarly, the number of years since a club’s last World Series championship is likely to be directly related to how much fans are willing to pay (i.e. Cubs fans will pay a lot to see their team chase their first championship in over a hundred years).
After performing the number crunching, the new model yields an R-squared coefficient of 0.723, and is able to predict ticket prices with an average error of 30.9%. So the R-squared coefficient is greatly increased compared to before, and the error in predicted ticket prices is also quite a bit lower than before.
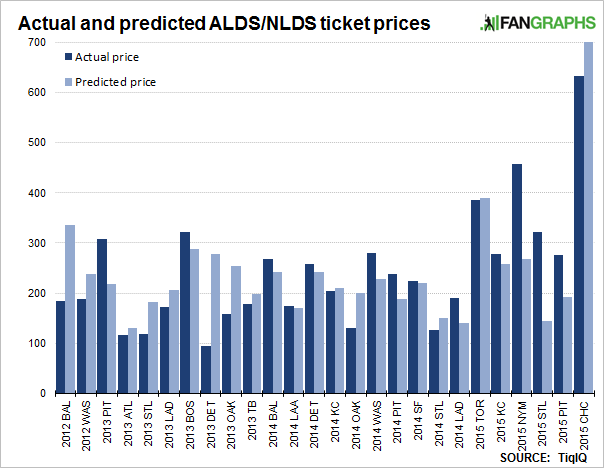
No model will predict all data points perfectly; for example, this model seems to do a particularly bad job at predicting the 2013 Tigers. There is probably some additional factor you can add to the model which will improve the prediction for the 2013 Tigers, but it almost certainly will come at a cost of making the prediction of another data point worse, or perhaps even make the average error of all data points worse.
[Note: Edited to account for an error in data analysis code]
Roger works as a software engineer by day, writes for The Hardball Times and FanGraphs by night, and has also worked for a Major League club.
You could probably have a more success by including a couple interaction effects and using less recent playoff success effects. Also, do you have data for individual games? The game number of the series would be impactful and going game-by-game may make the model more useful.