
Regression Has Come for Hyun-Jin Ryu
When Hyun-Jin Ryu takes the hill tonight against the Rockies in Los Angeles, he’ll be looking to reverse the fortunes he’s faced over his last three outings.
Ryu started the year hot. In his first 22 outings this season, Ryu’s 1.45 ERA led baseball by a healthy margin. No one could beat him; Ryu allowed two or fewer earned runs in 21 of his first 22 starts, and his ERA would have been even lower (read: 1.04) if it weren’t for one disastrous outing at Coors Field on June 28.
Despite this sparkling start to his 2019 campaign, Ryu found himself in the midst of a two-man race for the National League Cy Young Award. At the time, Ryu’s ERA — while certainly outstanding in a vacuum — appeared quite dependent on defense and luck. On the morning of August 12, after he completed seven innings of shutout ball against the Diamondbacks, Ryu’s ERA sat at the aforementioned 1.45 figure (34 ERA-). His FIP of 2.86 (65 FIP-) was still excellent, but it remained a far cry from the dominance we had witnessed on the scoreboard. In fact, at the time, Ryu’s ERA-FIP differential of -1.40 runs was the second-lowest in baseball. An ERA that low just wasn’t possible to sustain.
This was the story the entire season. Many thought Ryu’s ERA would ultimately regress, but April turned into May, and May turned into June, and eventually we were sitting in August and Ryu’s ERA was still that low. I began to consider a world in which Ryu finished with a sub-1.75 ERA; peripherals aside, that’s a guy who has to win the Cy Young award, right? Runs are runs, and an ERA that low deserves all the merit the baseball writers have to offer. It’s why Blake Snell won the 2018 AL Cy Young over Justin Verlander, though, like Ryu, Snell’s ERA-FIP differential was the second-lowest in the majors.
Alas, Ryu’s ERA did not stick. Regression has come rather suddenly. Here are the results from Ryu’s four August starts, and his seasonal ERA and FIP after each:
| Date | Opp | IP | TBF | H | R | ER | HR | BB | K | ERA | FIP | ERA-FIP |
|---|---|---|---|---|---|---|---|---|---|---|---|---|
| 8/11 | vs. ARI | 7 | 27 | 5 | 0 | 0 | 0 | 1 | 4 | 1.45 | 2.86 | -1.41 |
| 8/17 | @ ATL | 5.2 | 24 | 6 | 4 | 4 | 2 | 1 | 5 | 1.64 | 3.00 | -1.36 |
| 8/23 | vs. NYY | 4.1 | 24 | 9 | 7 | 7 | 3 | 1 | 7 | 2.00 | 3.19 | -1.19 |
| 8/29 | @ ARI | 4.2 | 26 | 10 | 7 | 7 | 0 | 1 | 4 | 2.35 | 3.18 | -0.83 |
You’ll notice that the gap between Ryu’s ERA and FIP has closed considerably. As I mentioned, this gap was the second-lowest in baseball on August 12. Into games on September 3, Ryu’s ERA-FIP differential is “merely” the seventh-lowest.
What has raised some questions is just how quickly Ryu has regressed. Some believed that Ryu’s high innings total — he’s thrown 157.1 frames so far this season, the third-most of his career — could be playing a factor. After his last outing against Arizona, Dodgers manager Dave Roberts insisted that Ryu isn’t slowing down due to workload, telling Bill Plunkett of the Orange County Register, “I don’t think it’s a fatigue thing. Just how he looks and talking to him, he’s very strong. I don’t see that there’s a dropoff in stuff. I think the dropoff is just a little bit of that command.”
Upon first glance, Roberts appears to be correct. Using Statcast’s Attack Zones, we can compare Ryu’s pitch percentage in the different parts of the strike zone before and during this stretch of regression. Here is what I found:
| Attack Zone | %, First 22 Starts | %, Last 3 Starts |
|---|---|---|
| Heart | 23.3% | 24.6% |
| Shadow | 44.7% | 40.1% |
| Chase | 25.1% | 26.1% |
| Waste | 6.8% | 9.2% |
The most significant changes here are in the “Shadow” and “Waste” regions of the strike zone. Over his last three starts, Ryu has thrown more pitches in the “Waste” region than in his first 22, perhaps an indictment that his control (rather than command, as Roberts suggests) is slightly off. This also could be the result of random statistical variation; it is worth noting that Ryu hasn’t walked a ton of hitters in his last three starts (3.9% BB rate) and thrown just about the same percentage of pitches behind in the count (24.3%) during this “regression period” as he did prior (23.9%). So while the underlying numbers suggest that Ryu might be dealing with some slight control problems, that does not really appear to be the case.
He might just have faced some rotten luck, something that is destined to happen over the length of a baseball season. Ryu has allowed a .408 BABIP over his last three starts, and when using Statcast’s expected batting average metric, we find that Ryu has only allowed an “expected” 20.5 hits over his last three starts, versus an actual 25. That might not make up all of the difference, but there is certainly something to be said about luck as it relates to Ryu’s regression.
Is there something more, though? Ryu is undoubtedly getting hit harder now (.362 xwOBA against) than he was before (.273). Random variance in quality of contact is always possible, but let’s think more about what he told Plunkett himself.
“I think the hitters’ approach, in general, has caught up to how I used to pitch,” Ryu said through his interpreter. “So I think there’s a need for a change from my end to get ahead in the game again. That’s one change that has to come.”
Ryu seems to think that the hitters have caught on to some of his pitching tendencies, whatever those may be. To potentially identify where hitters are looking, let’s see where Ryu has allowed his hard contact over his last three starts:
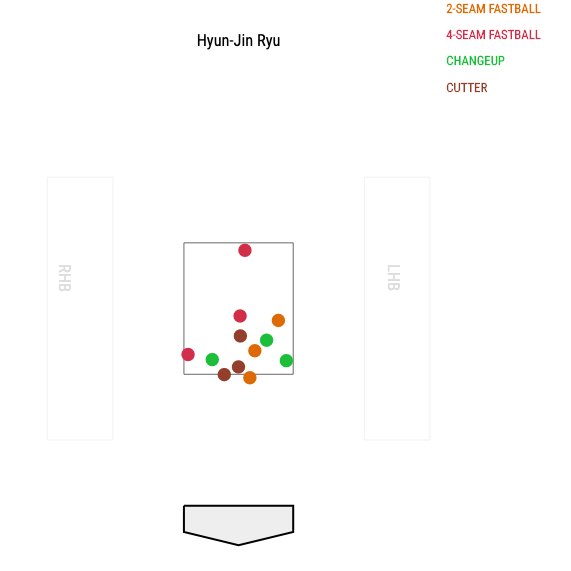
And now, here’s where Ryu has allowed his hard contact this season:
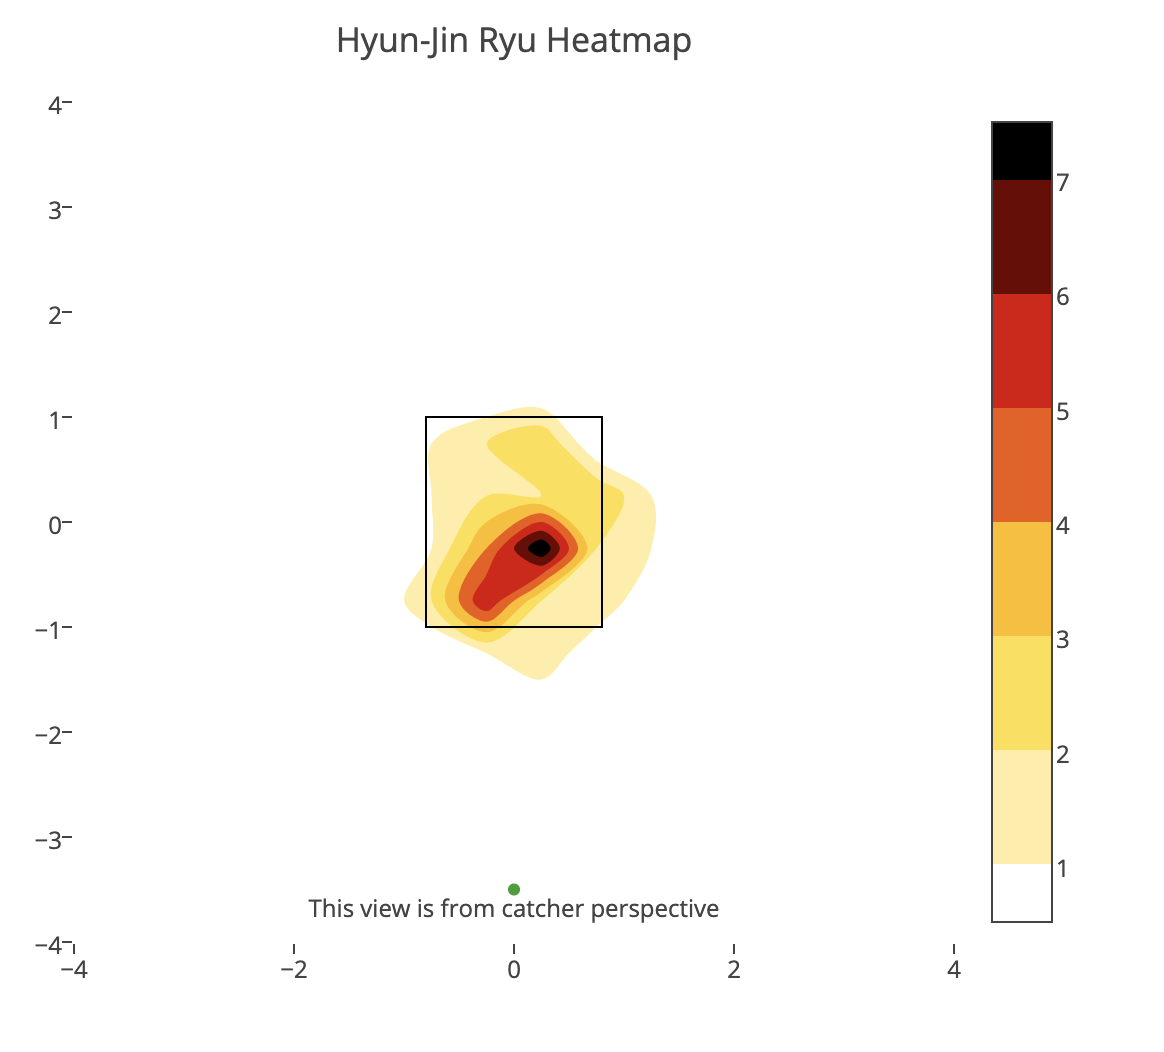
There’s one lesson here, and one lesson only: Don’t throw fastballs down. On fastballs that are both a) in the zone and b) below the belt, hitters have posted a .350 xwOBA against Ryu this year. On fastballs in the middle of the zone, hitters have just a .331 xwOBA. On fastballs up, they’re posting a .279 xwOBA. All season, the key for Ryu has been to elevate his fastball, even in spite of his low spin. But now, he’s let more fastballs bleed into that danger zone. Only about 15% of Ryu’s fastballs were in the bottom-third of the zone over his first 22 starts; in his last three starts, that has jumped to 22%. That could still be statistical noise, but it also could easily tie back into what Roberts was saying with regard to his command. It’s simple, really. Ryu’s command might be a touch off, leading to more fastballs in the bottom-third of the zone, leading to worse quality of contact.
Ultimately, this is not what you want on the two-seamer:
Neither is this on the cut-fastball:
In total, a lot might be happening with Hyun-Jin Ryu. Regression is a layered cake; no one ingredient is always responsible for a steep dropoff in performance. For the Dodgers’ ace, luck, slightly worse command, and potentially a more effective approach from the opposition might all be at play here. As Ryu takes the hill tonight in Los Angeles, he’ll be looking to fix whatever issues are within his control, while hoping that the odds are ever in his favor.
Devan Fink is a Contributor at FanGraphs. You can follow him on Twitter @DevanFink.
How many consecutive shutout innings would he need to throw before he gets his ERA back under 2.00?
looks like he’d need 27 scoreless innings(to get up to 184.1 innings).
Hey Devan I like how often you preface a statement with “this could be statstical noise”. Sometimes I find it unintuitive which differences authors intend to highlight as potential tends (e.g. might be noise) versus when authors want us to see a difference and think “okay that ain’t noise”. Keep it up
The thing is that Ryu hasn’t just had his ERA move closer to his FIP: he’s also pitched much worse by peripherals (i.e., FIP), as we can see in that August chart where his season FIP keeps creeping up with each start.
Ryu posted a 5.20 FIP in August (in 21.2 innings). His August ERA was even worse than that (7.48).
I’m not a fan of the emphasis on the word “regress” in this headline and post, which in a statistical sense would imply that Ryu has kept rolling along with about the same 2.86 FIP that he had prior to August but an August ERA more in line with that FIP. That would slowly move his seasonal ERA up closer to his seasonal FIP, though it would still leave a sizable gap between ERA and FIP. As I wrote above, that’s not what has happened.
I think people tend to use the word regress to mean two things that aren’t the same. One is that they regress to their peripherals, i.e. ERA closer to FIP or Batting Average closer to normal BABIP luck. But the other is simply that they regress to being a better/worse player in general.
In Ryu’s case this is more saying he’s not actually by far the best pitcher in the entire MLB that he looked like for much of this year.
That’s fair.
What’s confusing is that the term “regression” is used directly above a chart showing the difference between Ryu’s ERA and FIP, which implies the statistical sense of the word. It generally seems like this post goes back and forth between the two meanings of the word without clarifying which is being used.
There’s also this sentence immediately after that chart – “you’ll notice that the gap between Ryu’s ERA and FIP has closed considerably.” – which sounds like it relies on the gambler’s fallacy misstatement of statistical regression. We don’t expect the gap to “close considerably” in a short time. We expect that go-forward ERA will be close to go-forward FIP. That would narrow the gap slowly since Ryu had already banked 100+ innings of performance with his ERA much lower than his FIP.
“His FIP of 2.86 (65 FIP-) was still excellent, but it remained a far cry from the dominance we had witnessed on the scoreboard.”
Yeah, but that 2.86 FIP doesn’t take into account some following facts about Ryu at all (and that’s why he has always outperformed his FIP, except for ’14; there are many variables at play here, so outperforming FIP literally every year is nearly impossible).
1) He’s great at limiting contact authority; 5th lowest average exit velocity allowed among 181 pitchers with at least 1000 BBE in the Statcast era.
2) He completely shuts down the running game, boasting the lowest rate of SB allowed per IP among pitchers to debut in the last 50 years; he’s also pretty good at minimizing WP and HB.
3) He has the third-highest career LOB% in modern baseball history among 1398 starters with at least 700 IP.
Do you know who’s directly above Ryu on the exit velocity list? Kyle Hendricks.
Below are those two pitchers’ MLB ranks in some career stats (of 82 active starting pitchers with 700+ career IP).
Ryu: 33rd in K%, 9th in BB%, 21st in K-BB%, 13th in HR/9, 10th in FIP, 3rd in ERA
Hen: 43rd in K%, 10th in BB%, 25th in K-BB%, 20th in HR/9, 19th in FIP, 6th in ERA
That’s what happens when you (FIP) consider only 36 percent of plate appearance outcomes (for an average pitcher) and ignores everything else.
BTW, did you watch yesterday’s Rockies-Dodgers game? If you did, didn’t you feel that Ryu was just pushing the ball on the mound?
My point is, the headline of this piece should be “Fatigue has set in for Hyun-Jin Ryu”, which is to be expected, considering he hasn’t thrown this many innings since his rookie season in 2013 (0 IP in ’15, 4.2 IP in ’16, 126.2 IP in ’17, 82.1 IP in ’18 and 161.2 IP in ’19), even if he and Roberts deny it.
Lastly, when I last checked (about the end of August), UZR ranked the Dodgers’ infield defense 29th in baseball (Ryu is a ground-ball pitcher).
you can make the case even that the fatigue is somewhat related to last year as well- he threw 52.2 innings from August 15 on last year(and then 19 more in the playoffs) so from last August 15 to today, he’s thrown 233.1 innings. That’s in the top 10 in most innings thrown in that period.
And if you remember last year- in playoffs, he wore out as well. His last 3 starts he gave up 11 er in 12 ip with 19 hits given up.
When a pitcher of his caliber fails to complete five innings for the third straight start, you just know something is wrong with him.
First 22 starts: 51.9 GB%, 5.0 degree average launch angle
Last 4 starts: 36.9 GB%, 12.1 degree average launch angle
“Yeah, but that 2.86 FIP doesn’t take into account some following facts about Ryu at all (and that’s why he has always outperformed his FIP, except for ’14; there are many variables at play here, so outperforming FIP literally every year is nearly impossible).”
Even Jered Weaver, arguably one of the most extreme fly-ball/pop-up pitchers in baseball history, with a .273 career BABIP in 2067.1 IP, could not accomplish the feat.
ERA-FIP
’06: -1.34
’07: -0.15
’08: +0.43
’09: -0.29
’10: -0.05
’11: -0.79
’12: -0.93
’13: -0.55
’14: -0.61
’15: -0.17
’16: -0.56
’17: -0.68
If we go by FIP, he was merely an average pitcher, but if we go by ERA, he was a pretty good pitcher.
1 thing that’s been really interesting with Ryu is that he’s in all 4 of these “bad” starts started off really well. In all 4 starts, he’s given up 0’s in 1st 2 innings. But then he’s given up 4 runs in 3rd innings, 6 in 4th innings, 9 in 5th innings, and 2 in 6th innings(only 1/3 of an inning there). And his 5th inning numbers could have been worse- he’s left 5 runners and only 1 of those has scored.