Take Me Out to the Ballgame? Mapping the New MiLB Landscape
In October, Baseball America and The New York Times reported on a proposal from Major League Baseball that, if enacted, would dramatically reimagine the minor leagues. The proposal was the opening salvo of the League’s negotiations with Minor League Baseball over a new Professional Baseball Agreement (PBA), the agreement that governs the relationship between MLB and minor league teams, and includes plans to shift the timing of the amateur draft, realign parent-club affiliations, league geographies, and levels in some cases, and eliminate 42 teams. In justifying the shift, MLB pointed to a desire to improve minor league compensation and playing conditions, reduce burdensome travel, and elevate the facility standards of minor league parks. Those are worthy goals, though the fact that many of them could be accomplished within the existing minor league structure by simply spending more money suggests that this move may be one that is also motivated by cost-savings and efficiency, rather than just concern for minor leaguers on long bus rides.
Earlier this month, the Times revealed which teams are currently slated for closure under MLB’s proposal. Those teams, along with their 2019 total attendance figures are listed in the sortable table below:
| Team | Class | Parent Club | Location | League | 2019 Attendance |
|---|---|---|---|---|---|
| Auburn Doubledays | SS-A | Nationals | Auburn, NY | NYPL | 39,381 |
| Batavia Muckdogs | SS-A | Marlins | Batavia, NY | NYPL | 43,118 |
| Billings Mustangs | Rookie | Reds | Billings, MT | PIO | 96,594 |
| Binghamton Rumble Ponies | AA | Mets | Binghamton, NY | Eastern | 182,990 |
| Bluefield Blue Jays | Rookie | Jays | Bluefield, WV | Appy | 20,909 |
| Bristol Pirates | Rookie | Pirates | Bristol, VA | Appy | 18,750 |
| Burlington Bees | A | Angels | Burlington, IA | Midwest | 67,369 |
| Burlington Royals | Rookie | Royals | Burlington, NC | Appy | 40,142 |
| Chattanooga Lookouts | AA | Reds | Chattanooga, TN | Southern | 228,662 |
| Clinton LumberKings | A | Marlins | Clinton, IA | Midwest | 121,325 |
| Connecticut Tigers | SS-A | Tigers | Norwich, CT | NYPL | 66,532 |
| Danville Braves | Rookie | Braves | Danville, VA | Appy | 30,007 |
| Daytona Tortugas | Adv A | Reds | Daytona Beach, FL | Florida State | 137,570 |
| Elizabethton Twins | Rookie | Twins | Elizabethton, TN | Appy | 27,569 |
| Erie SeaWolves | AA | Tigers | Erie, PA | Eastern | 215,444 |
| Florida Fire Frogs | Adv A | Braves | Kissimmee, FL | Florida State | 19,615 |
| Frederick Keys | Adv A | Orioles | Frederick, MD | Carolina | 263,528 |
| Grand Junction Rockies | Rookie | Rockies | Grand Junction, CO | PIO | 88,476 |
| Great Falls Voyagers | Rookie | White Sox | Great Falls, MT | PIO | 43,920 |
| Greeneville Reds | Rookie | Reds | Greeneville, TN | Appy | 43,617 |
| Hagerstown Suns | A | Nationals | Hagerstown, MD | SAL | 59,682 |
| Idaho Falls Chukars | Rookie | Royals | Idaho Falls, ID | PIO | 102,859 |
| Jackson Generals | AA | D-backs | Jackson, TN | Southern | 107,131 |
| Johnson City Cardinals | Rookie | Cardinals | Johnson City, TN | Appy | 80,612 |
| Kingsport Mets | Rookie | Mets | Kingsport, TN | Appy | 29,553 |
| Lancaster JetHawks | Adv A | Rockies | Lancaster, CA | California | 161,595 |
| Lexington Legends | A | Royals | Lexington, KY | SAL | 270,221 |
| Lowell Spinners | SS-A | Red Sox | Lowell, MA | NYPL | 100,687 |
| Mahoning Valley Scrappers | SS-A | Indians | Niles, OH | NYPL | 98,833 |
| Missoula PaddleHeads | Rookie | D-backs | Missoula, MT | PIO | 57,076 |
| Ogden Raptors | Rookie | Dodgers | Ogden, UT | PIO | 146,201 |
| Orem Owlz | Rookie | Angels | Orem, UT | PIO | 45,561 |
| Princeton Rays | Rookie | Rays | Princeton, WV | Appy | 24,133 |
| Quad Cities River Bandits | A | Astros | Davenport, IA | Midwest | 150,905 |
| Rocky Mountain Vibes | Rookie | Brewers | Colorado Springs, CO | PIO | 137,294 |
| Salem-Keizer Volcanoes | SS-A | Giants | Keizer, OR | NWL | 80,833 |
| State College Spikes | SS-A | Cardinals | State College, PA | NYPL | 119,047 |
| Staten Island Yankees | SS-A | Yankees | Staten Island, NY | NYPL | 66,520 |
| Tri-City Dust Devils | SS-A | Padres | Pasco, WA | NWL | 87,021 |
| Vermont Lake Monsters | SS-A | A’s | Winooski, VT | NYPL | 83,122 |
| West Virginia Power | A | Mariners | Charleston, WV | SAL | 118,444 |
| Williamsport Crosscutters | SS-A | Phillies | Williamsport, PA | NYPL | 64,148 |
With a more specific list of affiliates in hand, we wondered how these closures would affect access to professional baseball across the country.
Baseball Prospectus‘ Rob Arthur examined that question last week using the announced attendance figures of the 42 teams in question, and concluded that four million fans would be shut out of minor league baseball, while Allison McCague published a piece there today considering the communities most affected by the closures using average and median populations for those cities and towns, as well as average distance by car to the nearest major league ballpark. Announced attendance certainly gives an idea of how many fans enjoyed their local home nine; obviously those who are already watching affiliated baseball in person are an extremely important demographic to account for when assessing access. Similarly, proximity to major league baseball for the specific communities facing closure is indicative of some degree of lost access. But the closures affect more than just the people who attended games in 2019 and the cities losing teams.
So how many Americans would see their ability to watch affiliated baseball in person disappear under MLB’s proposal? And how many would see their primary point of access shift from the relatively affordable games of the minor leagues to major league ones? To work out how the closure of these minor league teams will affect access to baseball, we went to the map. More specifically, we took the geographical center of each ZCTA (a close relative of ZIP Codes used by the Census Bureau). We calculated the distance as the crow flies from each ZCTA to each ballpark in America, both in 2019 and in MLB’s proposed new landscape. From there, we took the minimum of all of those distances for each ZCTA. That gave us the shortest distance to baseball for each geographical center. We then matched the distance with the population of each area. Linear distance isn’t perfect — it doesn’t account for roads, traffic, and natural barriers, for instance — but given the size of the dataset, it seemed like a reasonable compromise.
Take ZCTA 40502, part of Lexington, Kentucky. It had a population of 25,709 as of the 2010 Census (the most recent granular Census data available). In 2019, 40502 enjoys the presence of the A-Ball Lexington Legends, a scant 3.4 miles away. If MLB’s plan goes through, however, the Legends won’t be around much longer. Should a family from the area want to see professional baseball, they’d have to drive to Louisville to see the Triple-A Bats. Your mileage may vary in terms of whether that’s still close enough to call it local baseball. We repeated this process for each ZCTA to find the cumulative impact.
Many areas weren’t affected. Louisville residents, for example, will still be able to go see the Bats. And some areas were barely impacted: if you are one of the 215 residents of ZCTA 64676, Rothville, Missouri, your nearest minor league team would go from being 130.3 miles away to 135.7 miles away. If you’d prefer major league baseball, you’re in luck — Kansas City is merely 86 miles away as the crow flies, though interstates complicate the drive somewhat. And in some areas, you’re simply out of luck: if you live in Lowell, Vermont, the Vermont Lake Monsters are close enough for now. Next year, however, they may not exist. And if they don’t, there’s no one else within 125 miles.
Rothville, Missouri wasn’t an idle example. Minor league and major league baseball are different animals, so we calculated the data both including major league teams and without them. We also ran it a third time with independent league teams, which have another vibe altogether, but do offer an option for those in search of professional baseball. The findings reflect all six conditions: current 2019 and proposed 2020 maps for the minors only, for the minors and majors, and for all professional teams including indy leagues.
Put simply, a lot of people will lose easy access to live professional baseball. Take a look at a simple table: the number of people with no access to minor league baseball within a variety of distance ranges as of 2019:
| Miles | Millions w/no MiLB |
|---|---|
| 50 | 93.8 |
| 75 | 57.9 |
| 100 | 44.3 |
| 150 | 22.2 |
| 200 | 14.2 |
Is that a lot of people with no realistic access to minor league baseball? Only a few? That’s a matter of perspective. In either case, that’s the current environment. Roughly a third of the US population (the 2010 Census population was 308.7 million) lives more than 50 miles from that most wholesome and American of experiences, the minor league game attended by the entire family.
That’s the world as it exists today. Should MLB’s proposal to restructure the minors go through, here’s the new landscape:
| Miles | Out of Range Now (mm) | Proposed Out of Range (mm) |
|---|---|---|
| 50 | 93.8 | 107.8 |
| 75 | 57.9 | 68.8 |
| 100 | 44.3 | 52.4 |
| 150 | 22.2 | 28.8 |
| 200 | 14.2 | 20.1 |
While we have provided a variety of distances, the 50 mile demarcation seems most relevant, and the losses there are largest: 14 million people will have minor league games go from approachable to inaccessible. Adding in major league stadiums changes the numbers somewhat, but the theme remains the same:
| Miles | Out of Range Now (mm) | Proposed Out of Range (mm) |
|---|---|---|
| 50 | 57.4 | 68.2 |
| 75 | 34.6 | 41.4 |
| 100 | 21.7 | 25.8 |
| 150 | 7.7 | 9.5 |
| 200 | 3.8 | 4.7 |
Accounting for major league stadiums that might bridge the gap in coverage still leaves 11 million people affected by the change. And in many cases, major league baseball is a poor substitute for a minor league game. Between the cost of tickets and concessions, and the general ballpark environment, the two provide completely different experiences, as anyone who’s ever tried to take two young kids to a major league game can attest.
Even adding in independent teams doesn’t put much of a dent in the loss of coverage. We considered 61 teams, including the American Association, Atlantic League, Frontier League, Can-Am League, Pacific Association, Pecos League, Empire League, and United Shore League. These teams provide a measure of added access, but not enough to meaningfully change the picture:
| Miles | Out of Range Now (mm) | Proposed Out of Range (mm) |
|---|---|---|
| 50 | 51.6 | 61.8 |
| 75 | 29.8 | 35.6 |
| 100 | 17.7 | 20.8 |
| 150 | 6.0 | 7.6 |
| 200 | 2.7 | 3.7 |
Nearly half of the people who are more than 50 miles from a current minor league team are in range of a major or independent league team. But even after accounting for these extra avenues for viewing live professional baseball, more than 10 million people would be directly affected by MLB’s proposed plan. If your tolerance for driving is higher (say, 75 miles), the number of people with access to baseball increases, but the number losing service is still sizable; 11 million if you care about minor league stadiums, and 6 million if you take the broadest possible definition.
What does all of this mean? A sweeping decrease in the availability of live minor league baseball, which has a huge positive effect on communities across America. Would each of those 10-14 million people losing nearby baseball teams have attended a game? Certainly not. As Rob Arthur’s piece shows, they aren’t now. But losing access to it is still serious, and while it’s impossible to know the knock-on effects, it’s not likely to make baseball more popular in places where fans can no longer see the game played live.
Alas, this is all boring and impersonal data. Ten million is a large number, but it’s also something that defies easy comprehension. Ten million people is a statistic, not a set of communities. To make this clearer, we decided to show it on a map.
This isn’t an isolated issue, something affecting one league or state. It affects parts of 25 states, from Florida to Washington. Here are the areas that will go from having a minor league team within 50 miles to not having one should MLB’s proposed change happen:
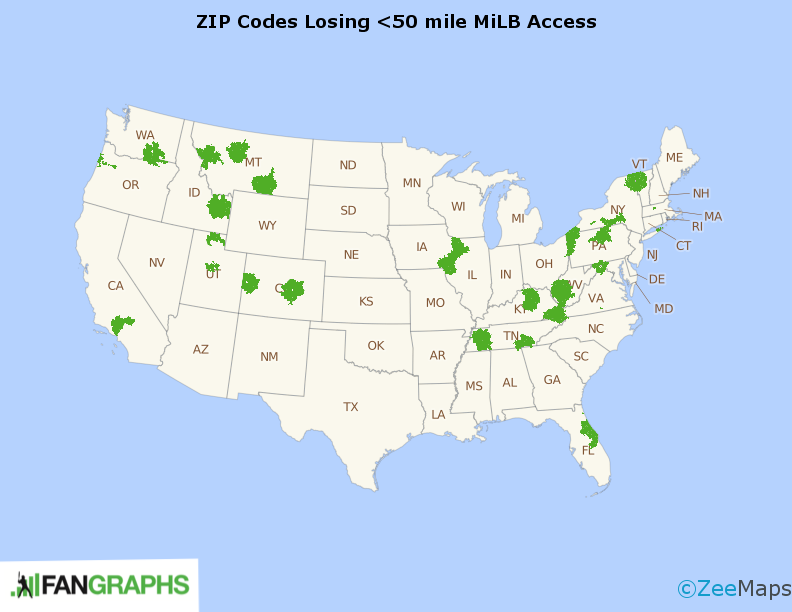
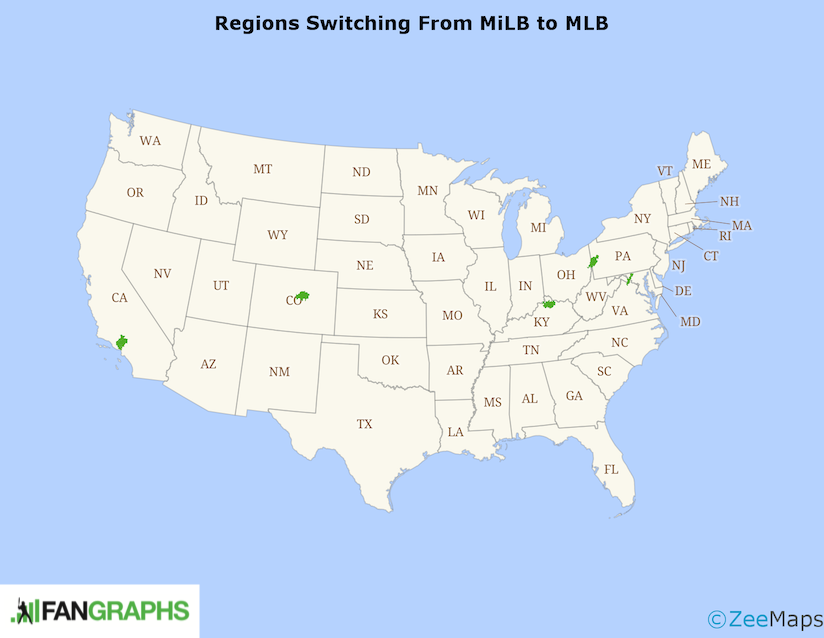
This is no small matter. Much of Appalachia will have no minor league teams to watch. The same is true for some of the Northeast and the rare parts of the Mountain West that have teams today. Some of those people will be able to replace their shuttered minor league locations with major league teams — but those locations are uncommon. Just over 3 million of the 14 million people will be able to. Those switches are in five markets: Los Angeles, Denver, Cincinnati, Pittsburgh, and Washington, DC. That looks like this:
But for many people, that change isn’t realistic. The average minor league ticket ran around $8 in 2016, and a night for a family of four cost roughly $65. It’s safe to say that that isn’t the case in the major leagues. Per Statista, the cheapest average ticket price among the major league teams now serving these areas is Cincinnati’s $45 average. The Dodgers check in above $100. On average, these fans will go from paying under $10 a ticket to $76.50.
But at least they’ll have baseball. Take a look at what will happen to Appalachia and Tennessee:
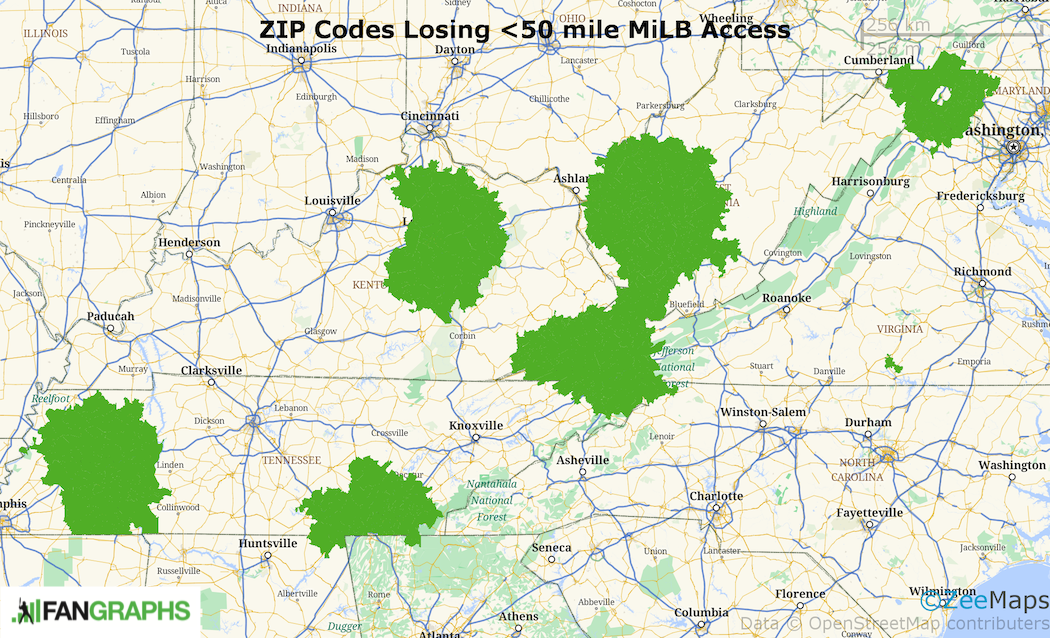
The only reason that doesn’t look worse is because much of Appalachia already has no access to baseball. With these closures, 12 of the 20 teams in the region will disappear. One of us (Ben) grew up in Appalachia, and while his local team wouldn’t be closing, many similar ones will. One note: the hole in the green blotch near Washington, DC is an artifact of the ZCTA database used to compile these maps. That region, too, will lose close access to minor league baseball.
It’s not much better out west. The map might not look as bad at first blush:
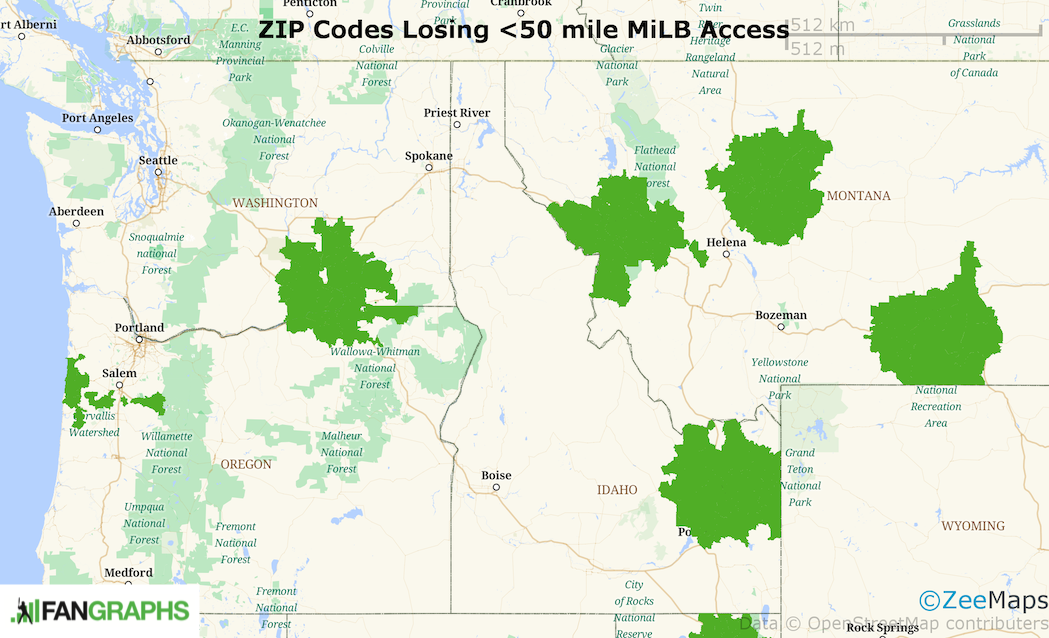
But those five big blotches are nearly the only places to get baseball in the area. All three teams in Montana would close, as would one of two teams in Idaho and one of two in inland Washington. Only fans living near Spokane or Boise would be unaffected by the closures.
Eleven million people isn’t just a number — it’s towns across America that won’t be able to use a minor league team as a community anchor. Teams we watched play as children simply won’t be there, and many of them won’t have substitutes. Forty million people attended a minor league game last year, more than half the 69 million that attended a big league game. For many people, minor league baseball is their preferred way of seeing the game live. And it just got tougher for many of those people.
Now, MLB’s proposal does include shifting some of the 42 teams on the closure list to a quasi-independent league it is calling the Dream League, which would serve as a proving ground for the large swath of players who would likely go undrafted as a result of the number of draft rounds being reduced. But the exact details of that league have yet to be sketched out. Moreover, the Dream League’s existence would do little for some of the smaller communities currently set to face closure. In his piece for Baseball America, J.J. Cooper noted that the transition from affiliated baseball to the Dream League would, “add $300,000 to $400,000 in costs to club for in salaries, worker’s compensation and staffing.”
That increase in costs makes the idea untenable for many clubs:
Because the markets for most Appalachian and Pioneer league clubs are unlikely to be able to support the increased costs of the Dream League, teams in those leagues would instead be encouraged to form summer wood bat amateur teams under the auspices and organization of MLB. By doing so, MLB could assure cities that while they may no longer have MLB-affiliated teams, they still would have baseball tied to the MLB/MiLB umbrella.
How acceptable a substitute the Dream League or a wood bat amateur team will prove to be is still an open question, but it is clear that the experience will be meaningfully different from these communities are used to now.
It’s easy to read this as hyperbole, as making a mountain out of a molehill when it comes to a lost entertainment option that affects 3% of the country. But minor league baseball is more than just the players who play it, or the fans who come through the turnstiles, regardless of how many of those fans there are. Minor league baseball is part of baseball’s enduring popularity. Taking in a minor league game remains one of baseball’s great pleasures, and with its relatively low cost and general proximity to home, it is a great way to make fans out of people who might not know how much they’ll enjoy it by presenting them with a low-stakes way to try baseball out.
This isn’t meant to be an economic analysis of the proposed changes to minor league baseball; it can’t tell you the cost in jobs of removing a minor league franchise from a small town. It isn’t meant to discuss what a smaller minor league universe means for the big league dreams and livelihoods of marginal prospects, or whether, in so confidently reducing the number of non-complex affiliates each team will have, MLB’s proposal accurately pegs the number of prospects who might truly be understood to be marginal. Those are all topics that merit a deeper dive. On the one hand, MLB is right to say that some of these teams don’t draw large crowds, and play their games in facilities that need improvement. Minor leaguers spend a lot of time on long bus rides; the fact is that the vast majority of them will never see the majors. Some optimization is likely warranted. But the fact that teams like the Yankees and the Dodgers, which are so frequently lauded for their player development expertise, have elected to field so many affiliates suggests that smart teams see value in the baseball being played in the game’s lowest pro levels. Player development isn’t linear. Some of these facilities are in a state of relative disrepair, but others, like the Rocky Mountain Vibe’s UCHealth Park, have undergone recent renovations. The minor leagues are far from perfect, but MLB’s proposal isn’t the only way to fix them.
But that isn’t our project today. Today, we consider the human cost of having no minor league team in your area. Minor league baseball hooks us while we’re young, hooks us whether or not we have access to a nearby big league club. As fun as it is to analyze major leaguers, that isn’t the sole remit of FanGraphs. We enjoy baseball in its many forms, and it’s a tragedy to see one of the most accessible ways of taking in a game be closed off from so many people.
Update: an earlier version of this post used a map which added the region surrounding the Wisconsin Timber Rattlers as losing minor league baseball. This map was incorrectly uploaded; it was used as a test of the mapping system. The correct map has been appended.
Meg is the managing editor of FanGraphs. Ben is a contributor to FanGraphs.
For reasons covered more deeply in these two threads (https://tinyurl.com/s3knejb and https://tinyurl.com/sbd43n4), MLB has a sound reason to consider realignment that includes reducing the number of affiliates. Paring back could improve the efficiency of player development, lead to improved conditions for players (competition, pay, travel, facilities), and allow MLB to better promote the game in rural areas. Unfortunately, much of the criticism level against the plan has been hyperbolic, and though this article is not, it still does not address whether 160 affiliates is in the best of interest of teams, players and even the host cities (many of whom end up putting up public money to finance stadiums only to see teams up and move anyway).
How the hell is not playing baseball in rural areas going to help promote the game in said rural areas?
As for the teams, they shoulder the costs because they’ve determined as individuals that having a whole bunch of places to stash and train lotto ticket minor leaguers is a highly profitable enterprise. They benefit from the players being under their control, they pay to keep ’em there.
What we’ve got here is a bunch of owners realizing that if they all work together to not try their hardest and not cast quite so wide a net for potential major league talent, then they can all save money and none of them have to pay the price in relative talent for their frugality. They product on the field will be slightly worse, because they miss out on a handful of major leaguers who would have gone undrafted or squeezed out after disappointing starts, but we probably won’t know the difference because everything we can count on a baseball field is relative.
In short, this is an anticompetitive cost saving measure, and unlike the other spending caps and draft pick penalties, this one comes at a real cost to human beings who don’t make millions to play baseball.
Sincerely,
a proud supporter of the Vermont Lake Monsters
Go Monsters!
What would promote the game better in Appalachia: having a handful of teams play to 500 people for 30 games or investing money in youth leagues, high school programs, and other outreach? There are plenty of ways to promote the game.
You are also ignoring all of the independent leagues, college summer leagues and Division I&II programs that bring baseball to rural communities. These are viable alternatives to short season Rookie teams.
Finally, you contradicted your argument by, on the one hand, saying MLB teams enjoy the benefit of stashing as many lottery tickets as possible, and then on the other, arguing that the teams are colluding to keep those lottery tickets out of the game. The fact is 10-20% of drafted players will play a single game in the majors. The current system is not designed to optimize player development. Realignment as part of a broader plan of reinvestment in isolated communities is a much better alternative than simply maintaining an antiquated status quo.
“Finally, you contradicted your argument by, on the one hand, saying MLB teams enjoy the benefit of stashing as many lottery tickets as possible, and then on the other, arguing that the teams are colluding to keep those lottery tickets out of the game.”
What I said is that this proposed plan is an effort to collude by reducing the number of lotto ticket prospects every team can keep in their system.
None of these teams would be slashing affiliates entirely of their own accord, the small chance of turning one of the would be cuts into a viable major leaguer is to valuable to the parent club. A franchise which chose to cut down like that would be disadvantaged relative to teams that stuck to the status quo, something teams like the aforementioned Yankees and Dodgers are clearly aware of because they’ve been actively doing the exact opposite.
The fact that very few prospects pan out and make the majors is a non sequitur until teams figure out how to identify those few when they are still young and undeveloped. They are better at it than they used to be, and further improvement is likely, but they have a long way to go before they can be truly confident that dumping a few dozen rookie leaguers isn’t going to cost them a quality major leaguer someday.
williamnyy … spoken by someone who probably never played the game at a seriously high (see: professional) level. I think people can understand the arguments in favor of efficiency and travel and conditions; however, these are baseball’s talking points in an attempt to make their point in their effort to save money. The fields in both the Appy League and the Pioneer League are perfectly fine for MiLB play. I’ve been to both and watched a player I know well play in both leagues. Furthermore; when you cut the game away from segments of the country, you are asking for unintended consequences such as losing young players who may otherwise grow up to become a star of the game. Even in rural America in the early 1900s, leagues spread out thru the midwest and attracted players, and some of those players because great finds for MLB. Additionally, negating the draft down by many rounds will end up having major unintended consequences. There are plenty of guys who are drafted late – say, round 30-40, who have no chance to actually be quality MLB players, but they are skilled and know the game and can play the game at a very high level to the degree that they challenge young prospects who are raw without being a bludgeon to their career. Those pieces in organizations and leagues are vital for real, actual prospects to play against. Losing out on those players could well hamper development of players in very meaningful ways. By all accounts, baseball is creating a generally better player on the field now in comparison to yesterday. The style of play may not be everyone’s favorite, but the players execute the current style very well. This is from being honed in MiLB against some players who are equal, some who are better, and some who are worse. Even the 24 year old SR drafted player taken in the 40th round can play a key cog in development of someone who becomes a star. Whether its something that player can teach but cant quite do routinely, himself, or whether its others seeing his deficiencies and learning to avoid them. The more players playing, the better. It provides immense learning experience and makes the game much more well rounded and competitive once the MLB level is reached. MLB is making money hand over fist. Even if there were good reasons to take these teams away, they have the money to support it … but the problem is, to the contrary, there are many better reasons to keep the teams and the players. And this is just from an immediate baseball perspective. Keeping jobs in Amerca’s game and butts in the seats and eyes on the field all over the country – in person – is vitally important to the long term health of the game.
I’m not convinced that these markets “matter” in a growing the game sense in terms of missing players they would have otherwise gotten. For one, no one is scouting these cities for players. I dunno the last time you watched high level amateur baseball, but from a “we’ll lose future players if we close this team” perspective, I’m not seeing many travel teams from small town Pennsylvania at showcases (which is where you would see kids like that play- what, you think anybody outside of like 30 college teams has a recruiting budget that means they can travel to recruit?). There’s a good article out there, somewhere, on kids traveling 3 hours to get on a team in Bradenton, Gwinnett, or Fort Worth- and there’s a chance that they’d lose THOSE kids by closing these teams down. But the stranglehold of well funded travel teams, coupled with the relative ubiquity of cable television, makes the “have team in the middle of nowhere” argument in terms of “diamonds in the rough” less compelling. The player pool is down, but that is, I think, mostly because fewer teams “matter,” earlier on in kids playing the game. Kids get an honest evaluation early on nowadays, and frankly, get told whether it’s worth coming back to play travel ball. They definitely miss some kids they could have gotten. But they get the good players better coaching earlier, and seem to be happy with the results.
As for skill development, I dunno. The value produced by lower league teams is very very small. The EV has to be negative in terms of costs v. benefits to keep them going, I think one reason people haven’t written that article here is because the costs of keeping these teams going far outweigh the benefits from a standard analysis, so you have to rely on squishier stuff like “future fans and market growth.” It’s way easier to answer the question “do these teams produce enough pros to justify the cost of their existence” than “do we shrink the audience for the game by cutting franchises in places that are far from and MLB team” or “do we need people to go to games to make money” (quite frankly the answer to that seems to be “no” in most sports).