
Talkin’ Softball (Baserunning Aggression)

I have a secret to tell you. Most writers don’t read the comments on their articles. I know, I know, but your well-thought-out rejoinders and witty jokes! It’s mostly a bandwidth issue: there are just so many words. But we pop in from time to time, and boy am I glad that I did this Monday, because I got a softball question to answer (get it?):
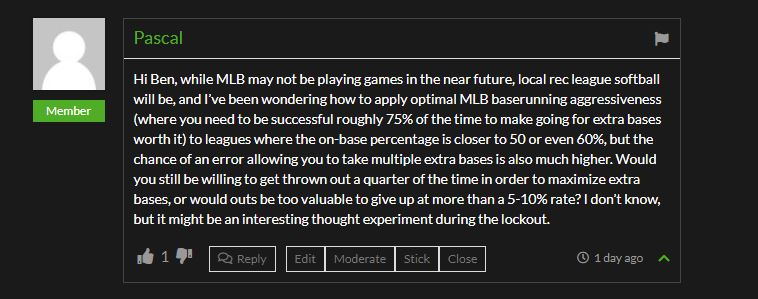
Yes! Forget CBA negotiations and lockouts and missed spring training. Forget major league baseball, too. Heck – for this article, forget baseball! Today, like the 1992 Springfield champions, we’re talking rec league softball.
The question is an apt one, and far more useful for the average slow-pitch softball player than an examination of backup sliders or novel sinkers or whatever the heck it is I’m normally writing about. It’s a simple question: how aggressive should you be on the basepaths in a world where almost no one makes outs? For the rest of this article, I’ll be applying the same math that we use for steals in the majors (that golden 75% success rate target) to decide whether to go for an extra base on a single. It could also apply to a steal, if that’s something your league does; I haven’t played in a few years, but the basepaths weren’t exactly lively when I did. For today’s article, though, we’re not going to consider the etiquette or technique, merely how to make your opportunities mathematically advantageous.
I polled an illustrious group of slow-pitch softball experts (read: some people I know who play) to come up with a rough batting line. Opinions on the exact line varied, but I’m going to stick with one that’s close to the league that Pascal specified: an on-base percentage between .500 and .600. The overall league slash line I’m going to work with is .526/.550/.947. I’m also going to assume that every batter has the same line, and every pitcher allows the same line: we’re not going to be filling out lineup cards for your local beer league team today.
Here are the individual outcomes that lead to that slash line:
| Outcome | Frequency |
|---|---|
| BB | 5% |
| 1B | 29% |
| 2B | 10% |
| 3B | 3% |
| HR | 8% |
| K | 5% |
| Other Out | 40% |
Some leagues have home run caps, but that’s mathematically tricky, so I just kept the home run rate reasonably low and assumed no caps. I plugged these into a simulator to figure out how many runs this team would score per seven innings. It’s a 16.5-run average, so it’s fair to say that our team is an offensive powerhouse. Next, we need to work out how trying to advance from first to second on a single changes the percentages.
In a setting that resembles major league baseball, we could do this with a run expectancy table. Something like this would tell you that in a run environment that resembles the majors from 2010-15, a successful steal of second with no one out adds 0.241 runs to your expected scoring. Getting caught attempting to steal second with no one out costs you 0.605 runs. Put those together, and you get a breakeven rate of 71.5% – 71.5% of the time, the baserunner will add 0.241 runs and 28.5% of the time they’ll cost their team 0.605 runs. Those two values sum to zero.
I don’t have a run expectancy matrix for the slow-pitch league I made up. There’s no data for it, because it doesn’t exist, and no one keeps slow-pitch softball game logs anyway. Instead, I took advantage of the simulator I mentioned before and started creating my own run expectancy matrix – at least the parts I care about.
First, we need to consider the different ways that an attempt to stretch an extra base (or to steal a base) can end. It can end with a runner on second and no out recorded (I’m only considering plays at second for this article). It can end with the runner being thrown out. Finally, it can end with an error – for the purposes of this article, we’re going to call it a one-base error, but depending on the fielding, that might be underselling it.
Next, we need to use the simulator to find out how many runs will score on average in each of these base/out states. Luckily, that’s easy to do – and easy to do for you at home, if you can use Python. Here’s the code I used to do it. This simulator is very simplistic. You give it a percentage chance of each outcome occurring and an initial base/out state. It rolls a die (generates a random number between 0 and 1, to be precise) and uses that to determine what happens. Each outcome moves the runners, outs, and runs around based on some rules I set out – half of singles are two-base advancements, half of groundouts with runners on first lead to double plays (which might be aggressive), and so on. When the play is over, it starts the process again with another random number.
From there, the simulator keeps count of how many runs score before the inning ends. When the random outcomes add up to three outs, that’s the inning. The simulator notes how many runs scored, resets the bases, and does it again. And again. And again. The code I provided runs one million innings, but nothing’s stopping you from adding a zero and having it run 10 million innings, or whatever your heart desires. After all of those innings are done, the program just takes an average – and now we have a run expectancy for an initial base/out state in our high-offense world.
With a runner on first and no one out, an average of 3.003 runs score per inning. With a runner on second and no one out, that number climbs to 3.331 runs – that extra base is worth 0.328 runs. With one out and no one on base (if the runner gets caught), the run expectancy drops precipitously, to 1.406 runs. Getting thrown out costs you a massive 1.597 runs. Finally, an extra base isn’t worth that much. With a runner on third and nobody out, run expectancy is 3.355 runs – getting to third on an errant throw is worth 0.352 runs relative to parking yourself at first.
If we set the chances of a throwing error at 10%, we can run a quick breakeven for attempting to take second base with no one out. If you advance successfully 72.8% of the time and also pick up an extra base on an error a further 10% of the time, the weighted change in run expectancy sums up to zero. That doesn’t tell the whole story, because you can’t know if a throwing error is coming when you take off. Of the plays that are contested, that’s equivalent to an 80.9% safe rate (72.8 out of 90). In other words, if you don’t want to give up expected runs when you round first and head for second, you should expect to beat a good throw at least 80.9% of the time.
You’re allowed to get aggressive on the basepaths even when there are outs. I also ran the run expectancies for a runner who reaches first with one and two outs:
| State/Outs | 0 | 1 | 2 |
|---|---|---|---|
| On First | 3.003 | 1.942 | 0.929 |
| On Second | 3.331 | 2.183 | 1.11 |
| Advancement + Error | 3.355 | 2.373 | 1.113 |
| Thrown Out | 1.406 | 0.59 | 0 |
One out is a slightly worse time to go for it: you need 73.7% successful advancements to add to your 10% of errors, or a breakeven 81.9% safe rate. It’s the same with two outs. All three rates are roughly the same, though: if you’re looking to push the envelope in your slow-pitch game and think that the fielding team will throw the ball away 10% of the time, you need to beat a good throw more than 80% of the time.
Thanks to our run expectancy grid, we aren’t limited to a static 10% error rate. It’s just an equation, and by plugging in a variety of error rates, you can find the breakeven rate (like before, the rate at which you think you beat a good throw that carries no change in run expectancy) for various chances of a throwing error:
| Outs/Error Rate | 0 | 1 | 2 |
|---|---|---|---|
| 5% | 82.0% | 83.5% | 82.7% |
| 10% | 80.9% | 81.9% | 81.9% |
| 15% | 79.8% | 80.1% | 80.7% |
| 20% | 78.4% | 78.1% | 79.5% |
| 25% | 76.9% | 75.6% | 78.1% |
I highlighted the best time to go for it for each error rate (in terms of the lowest required breakeven). The higher the error rate, the less sure you need to be you’ll succeed – that’s true regardless of the number of outs. But in a high error rate world, one out is the best time to stretch your singles, because an error gives your team a runner on third with less than two outs, and in a world with no strikeouts, that’s worth quite a bit.
Running wild when you’re the only one on base sounds boring. What if you tried this tactic when there was a runner on third? In this case, I assumed that the runner would come home on an error and stay put otherwise, regardless of the result at second base. Here’s that same breakeven success rate grid, calculated with runners on first and third:
| Outs/Error Rate | 0 | 1 | 2 |
|---|---|---|---|
| 5% | 82.5% | 81.9% | 86.5% |
| 10% | 81.4% | 80.2% | 84.2% |
| 15% | 80.2% | 78.5% | 81.5% |
| 20% | 78.9% | 76.4% | 78.6% |
| 25% | 77.3% | 74.1% | 75.2% |
With no outs, the breakevens go up slightly. Why mess with the chance for a big inning? With one out, though, it’s go time: you might “drive in a run” by forcing an errant throw, but there’s still hope to score even if you get thrown out. With two outs, it’s back to being a so-so proposition, because league-wide batting average is so high that the run on third is reasonably likely to score if you don’t risk a third out on the basepaths. Unless, of course, the error rate is extremely high — if that’s the case, you might want to be aggressive to give the runner on third some free scoring opportunities.
So, FanGraphs member Pascal, I hope I answered your question. What are the breakevens for taking an extra base or stealing? They’re similar to the major league baseball rule, but slightly more stringent. If we’re being honest, I doubt you can round first and tell me the difference between a 75% likelihood of reaching second safely and an 80% chance. Run when you feel like it! It’s rec league softball, after all. Do what’s fun, and the results will follow. Oh, and hit some bombs – that’s always a good way to score, no matter what run environment you’re in.
Thanks to Tess Taruskin for her research assistance and softball fact-checking.
Ben is a writer at FanGraphs. He can be found on Bluesky @benclemens.
Thanks, Ben! This answers my question quite thoroughly. I had expected that the breakeven point would be a bit higher; looks like I need to step up my aggression on the base paths a bit!
I am quite surprised at the results of this analysis. I always feel that outs are gold in softball – you never want to give one away. Partly because runs tend to come in bunches — that 16.5 run team does not get there by scoring 3, 3, 2, 3, 3, 3 runs … they get there by scoring 2, 0, 10, 1, 4, 0. You never want to run yourself out of having that 10 run inning.
Agreed that outs are king. But taking extra bases gets you out of force outs & can spiral into that big inning. I think part of the math is a bit off, in that it assumes a higher level of competence in softball defense short of B/C leagues.
Super fun article!
I play in a co-ed league with a few high-skill teams and a few medium to low skill. Outs ARE gold. But it’s much easier for the defense to make gb outs if they have the force play at second, because bobbled balls are safe at first with a fast runner but often out at second.
So in our league, the % of outs per GB goes up roughly 25-50% with a runner on first.
This is based purely off my participation in multiple leagues during softball season, but that 5% K rate seems pretty high, depending on the skill level of the league. I originally thought that the 5% BB rate was too high, but could see that being fairly accurate.
This was a great article!
Recall foul balls on 2 strike pitches are strikeouts in softball.
Yup, the vast majority of Ks I see in slow pitch are either looking (usually on a bad call, to be honest), or the foul ball with two strikes, not swinging strikes.
A couple years back, our league (which has long started with a 1-1 count) did away with the “courtesy foul” rule, where a batter could foul off one pitch with 2 strikes safely before striking out on a second foul. Strikeouts immediately spiked a bit, but batters were able to adjust by focusing on putting the ball in play early, which also reduced walks.
Greatness
This was a really fun article. It was fascinating to see this analysis as a slow-pitch softball player.
My softball team (coed, recreational) actually does keep stats going back several years, so it was interesting to compare this exercise with our team stats, which I keep as coach. Over the past two years:
Year; PA; BA/OBP/SLG; BB%; K%; R/G
2021; 613; .555/.599/.792; 12.4; 4.1; 14.4
2020; 645; .567/.580/.767; 5.9; 3.3; 12.9
Leaguewide runs/game was a little lower at about 11 for average teams; we won 65% of our games in that time. Very interesting to compare different run environments as our league is more geared to getting on base than the one estimated above. Thanks for giving me a weak excuse to pull these stats out!
Wow. That’s dedication.
I assume you are getting Hawkeye installed for the spring? I’d love to see a chart of Jimmy’s average speed to first by the number of Coors Lights in his system. He always claims it makes him faster. Time to let the lasers tell the truth!
Hey, we know how to play softball!
I coach 12u girls fastpitch both rec and B select/travel. Now I feel obligated to plug some numbers into this. Walk and K rates would be a lot higher. I need to look at some of my old scorebooks and crunch some numbers!
Do most rec softball leagues even allow walks or HBP? I know we don’t use them when our church group plays casually, in which case the only reason OBP should be different from AVG is due to sac flies, and those would actually push the OBP slightly below AVG as weird as that is.
I think most allow walks, but not HBP.
Yeah, all the leagues that I’ve played in allow walks, but there’s definitely a philosophy in certain leagues (especially church leagues) to not take walks if possible and to put the ball in play as a sportsmanship ideal. Never played or heard of a league that recognized HBP.
The point of not using walks is that you don’t have to open the can of worms of calling balls and strikes on non-swings.
A strikeout then occurs only when you swing 3 times without putting the ball in play, but you’re allowed to wait out as many pitches as you want in order to get good ones to swing at, like how the Home Run Derby worked before they changed it to the current timed system.
It’s a little different in organized church leagues – every church league I’ve played in operates under fairly normal ASA or USSSA rules, including around walks. To call balls and strikes, we use a mat. It makes the strike zone pretty easy – the ball either hits it or it doesn’t.
As I stated, the real reason walks are very low in such leagues is because of a philosophical approach from the hitters, not because the rules are that different from other slow-pitch leagues.
We have reached peak lockout!
“no one keeps slow-pitch softball game logs anyway”
I think you underestimate the nerdiness of players and managers like my grad school physics and astronomy team. We kept score every game and put the box scores and season / career statistics on a student webspace (that had to be transferred whenever someone graduated). If I can find out if it’s still living somewhere I can share the link.
In my experience, better teams have some ex-hs baseball players, and thus are usually dangerous hitters and capabale defenders. In general, it would be a mistake to be too aggressive with baserunning if the chance of error is low due to this competency. However, you may have no choice if they are a strong offense and you need to catch up.
Ideally, you’d be able to selectively be aggressive. “if the 2B is a weaker defender, always try to stretch singles into doubles.”
Often times, weaker defenders are placed at RF, 2b, or C. So, if you can hit oppo (as a righty) flyballs to their weakest defender, you can ideally get a misplay by the RF at the catch, a bad throw by RF, a bad catch by 2B, a bad catch by C…all in one play, and get a HR from a medium-EV flyball.