The 2015 Rookie Class Was the Best in 100 Years
Toward the end of July, something had become apparent in the 2015 season: it was an unquestionably great year for talented positional rookies. That was easy to see by the first half introduction of All-Star caliber players in Kris Bryant, Carlos Correa, and Joc Pederson. Many others added to the top-heavy, strong class. As it turns out, that excellence was also borne out in the data: the first half of the 2015 season had the most rookies with 1.0+ WAR and the most combined rookie WAR since 2005.
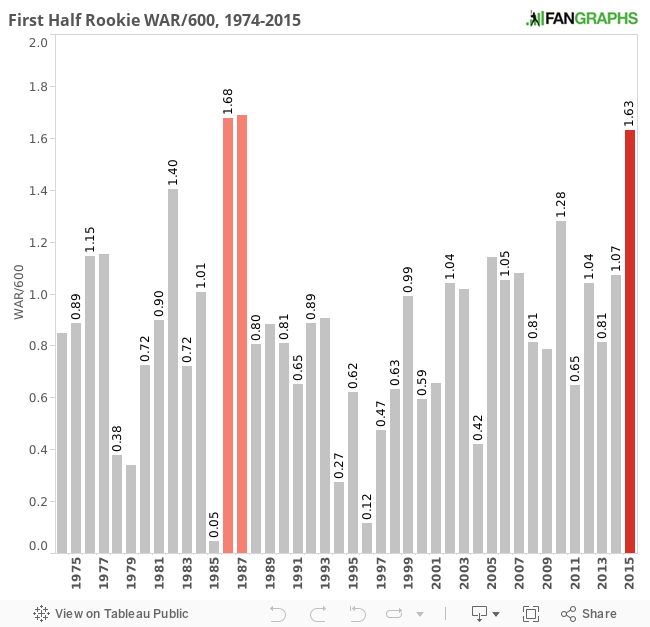
Digging a little deeper, it turned out that only two seasons in the last 40 years compared to the playing-time adjusted WAR the 2015 rookies put up in the first half. Take a look at this interactive chart that compares the first half of this past season with those from the past 40 years:
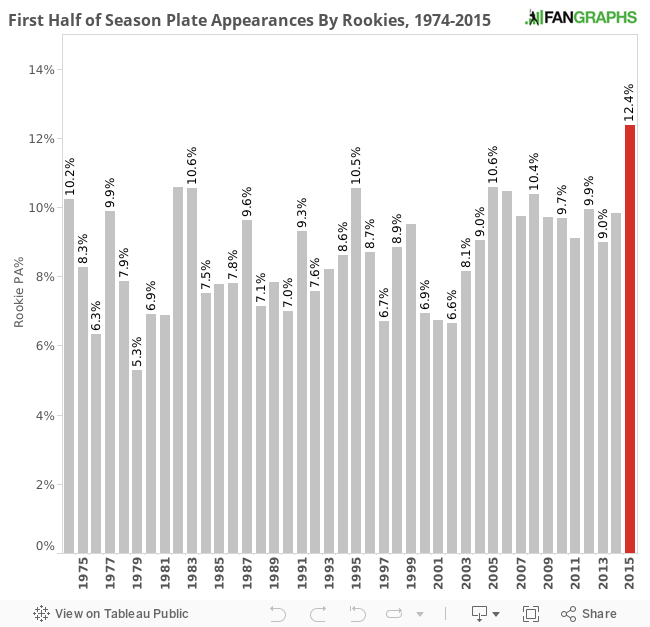
Rookies also accounted for a greater share of playing time in the first half of this season than in any first half of a season during the past 40 years. Again, an interactive chart from the original piece to illustrate that point:
After sorting through that data, now we know for certain : the first half of 2015 was historically great for first-year players. There are a lot of reasons behind that — reasons that were discussed in the comments section of the original piece and are outside the scope of this particular article. That needs — in fact, deserves — its own piece on a future day. Naturally, the question now becomes how the 2015 rookies fared for the rest of the season. And here we are. Now, with a full season in the books, we can take full-season data from years past and compare it to 2015.
The other good news? Our leaderboards only had first-half splits going back to 1974, and we obviously have full season stats going back much further than that — meaning we can look at a much large sample in this piece. Let’s start with the percent of total MLB plate appearances by rookies since the start of the live-ball era (1920) and compare it to this year. All charts in this piece are interactive, so feel free to hover over bars to see exact years/data:
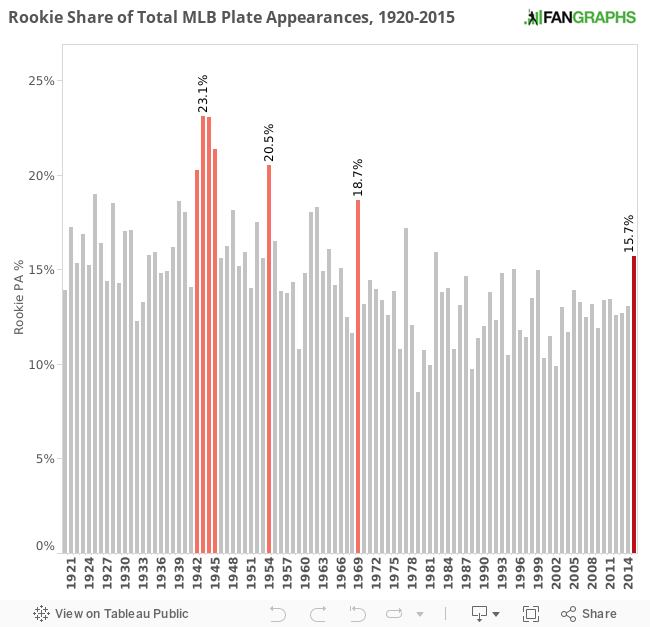
We can see that the share of rookie plate appearances for 2015 was the highest since 1982, but can’t touch the wartime levels of the mid-1940s or the 1969 expansion of the league. World War II caused a slight variation in roster sizes, which is also something we should keep in mind when looking at these figures. Nevertheless, the highest share of rookie plate appearances in the last 30-plus years is still an impressive mark for 2015, and shows just how much of an influence rookies had on the league this year.
What was that influence, production-wise? Let’s bring in our WAR values for our time period. Because plate appearances can vary so greatly between years for rookies (for instance, 1956 had only 13,195 PAs by rookies; 1999 had 28,373), I’ve adjusted the WAR each rookie class produced, modifying it to assume 600 plate appearances:
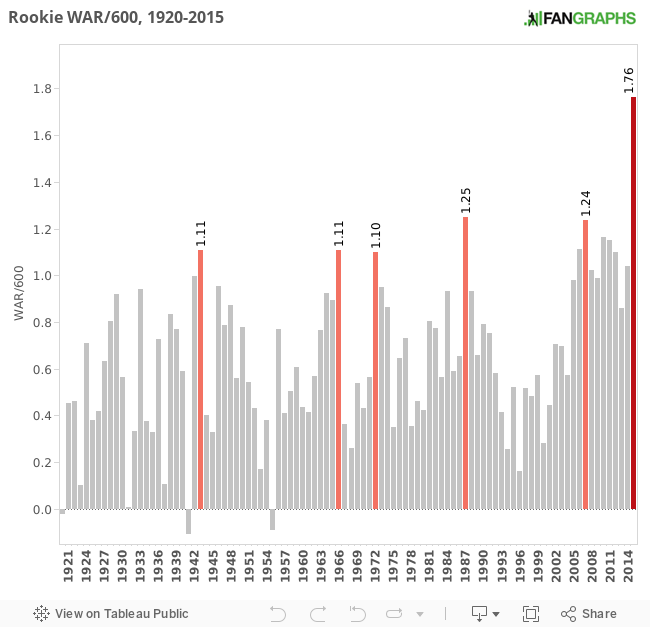
There’s no other way to put it: this is remarkable. No other year even comes close to 2015, with 1987 and 2007 being the only years in remote proximity based on WAR/600. The 1987 season featured Mark McGwire (5.1 WAR), Kevin Seitzer (5.1), Devon White (4.6) and Mike Greenwell (3.4) among its most notable rookies, while 2007 offered Troy Tulowitzki (5.2 WAR), Dustin Pedroia (3.7), Hunter Pence (3.5), and Ryan Braun (2.5). Those were amazing rookie classes. And yet 2015 blows them away.
After the incredible showing from the 2015 rookies in the first half of the season, I expected the league to catch up a little, and for the rookies not to produce at quite the same level during the second half of the season. That can really only be said of a few players (Joc Pederson comes to mind, who put up 3.1 WAR in the first half before dropping -0.3 WAR in the second) — and for each instance of one of those players who declined, there was another rookie who took the league by storm.
There was Francisco Lindor, who produced 4.5 WAR in the second half after his late call up; Odubel Herrera produced 3.7; Kris Bryant was good for 3.1; Jung-ho Kang put up 2.5. There were 19 rookies who produced at least +1.0 WAR in the second half of 2015, an increase from 17 in the first half. This year’s rookies not only replicated their incredible and historic first half production in the second half; they actually exceeded it.
There’s one figure that best underlines that point. In the first half, the top 20 rookies produced a combined 29.9 WAR, the highest mark in at least the past 40 years; the top 20 rookies during the second half produced a whopping combined 37.5 WAR. In other words, at the All-Star break, we thought that 2015 might be the best year we’d ever seen for rookies. It turns out it was even better than we thought.
The 2015 season offered a perfect storm in the movement toward bringing the most talented rookies up sooner: they are cheaper than veteran players, ready to be as good as average major leaguers at increasingly younger ages, and can learn the polish they need while on the job in the big leagues. After looking at this data, it’s not at all crazy to think that the structure of MLB’s current arbitration system — which keeps rookies down in the minors for longer than they would be otherwise — is ripe for reform. If that turns out to be the case, we might not have seen the best rookie class yet.
Owen Watson writes for FanGraphs and The Hardball Times. Follow him on Twitter @ohwatson.
So…baseball is dying, right?
No, just the fans are.