The Curious Case of the Cubs’ Offensive Woes

Playoff baseball has become something of an expectation on the North Side of Chicago since 2015, but there are good reasons why the Cubs have been somewhat derisively known as the “lovable losers” since the term was first applied to them 1977. For most of their 145 year history, the Cubs have not been worried about their record in October. In fact between 1945 and 1984, they didn’t appear in the postseason at all. Which is why it’s such a remarkable statement to say that the 2021 Cubs got off to one of the worst offensive starts in franchise history. It’s even more perplexing because this season’s offense is mostly made up of the same core of players that won the World Series in 2016 and brought playoff baseball to Wrigley Field in five of the last six seasons.
Twelve games into the season, there was no shortage of pieces about the Cubs’ broken offense. However, those concerns were briefly allayed when the team went on a torrid run, scoring 55 runs in six games. Some fans may have breathed a sigh of relief as the bats came to life, but close observers noticed a pattern. Sahadev Sharma at The Athletic speculated that the Cubs offense was neither historically broken nor magically fixed. He argued the team is trapped in the same boom and bust cycle that allowed the Brewers to chase them down and force a game-163 in 2018. That offensive outage lead then-president of baseball operations Theo Epstein to declare that “our offense broke somewhere along the lines.” It’s the same cycle that saw them get off to a red hot, 13-3 start in the pandemic-shortened season, only to be unable to score against an upstart Marlins squad in the Wild Card Series. So let’s explore what’s changed with this offense since 2016.
We’ll start with the obvious: there has been a notable offensive decline since 2016.

That peak run differential of +252 is impressive, and the Cubs offense was excellent in 2016. Their wRC+ of 112 (excluding pitchers) led the National League and was just behind the 114 Boston put up that season. Interestingly, while that team is in the top 10 of a lot of the other offensive leaderboards, the only categories they led MLB in are BB% and OBP. They still had quite a bit of swing and miss in their game, but their 20.0 K% was tied for 20th unlike their current mark of 25.5%, which is tied for 7th. Focusing on wRC+ because it gives us a baseline of the team’s offensive performance relative to a consistent league average baseline of 100, you can see below how the non-pitcher Cubs offense has fared since 2015:
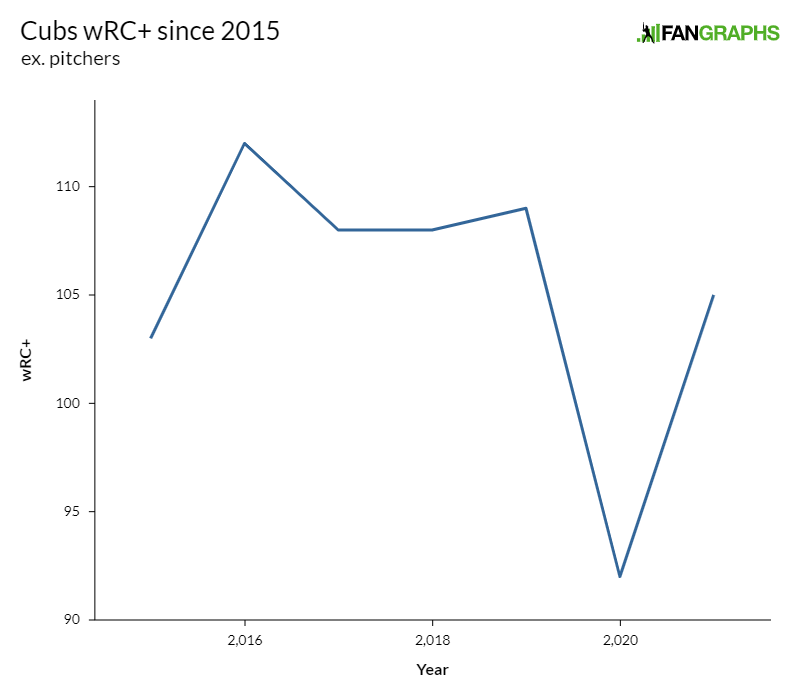
The Cubs built their League Championship and World Series teams in 2015-17 on above average offenses that led the league in walks combined with exceptional run prevention in the form of their pitching and defense. But what turned the Cubs offense from being at times very good to below league average is tricky to measure because the peaks and valleys tend to get smoothed out over the course of a season. Buried in the Cubs’ 2018 team wRC+ of 108 is what I’m referring to as the largest “boom and bust” offense in the National League between 2015-19. What exactly is a boom and bust offense? I’m so glad you asked. To capture this I took every team in the NL and tallied the number of games where they scored fewer than one run (bust) or more than seven runs (boom). I limited it to the National League because the existence of the designated hitter changes the baseline for these numbers. 2020 is excluded for the same reason, but also because the smaller number of games lends itself to a lot more volatility that makes it hard to compare to a full season.
| Team | Year | <=1 | >=7 | % Big BB |
|---|---|---|---|---|
| CHC | 2018 | 39 | 49 | 54.32% |
| CHC | 2017 | 28 | 50 | 48.15% |
| LAD | 2019 | 17 | 59 | 46.91% |
| MIA | 2017 | 24 | 49 | 45.06% |
| PHI | 2019 | 25 | 47 | 44.44% |
| SFG | 2019 | 36 | 36 | 44.44% |
| STL | 2016 | 28 | 44 | 44.44% |
| COL | 2016 | 21 | 50 | 43.83% |
| COL | 2019 | 22 | 49 | 43.83% |
| LAD | 2016 | 33 | 38 | 43.83% |
| LAD | 2018 | 25 | 46 | 43.83% |
| MIA | 2019 | 45 | 25 | 43.21% |
| MIL | 2018 | 27 | 43 | 43.21% |
| PIT | 2015 | 33 | 37 | 43.21% |
| ARI | 2019 | 25 | 44 | 42.59% |
| ATL | 2018 | 26 | 43 | 42.59% |
| CIN | 2016 | 26 | 43 | 42.59% |
| PIT | 2019 | 31 | 38 | 42.59% |
| SDP | 2015 | 36 | 33 | 42.59% |
| SDP | 2016 | 33 | 36 | 42.59% |
As you can see, the 2018 Cubs are the most volatile offense in terms of this boom/bust metric. They are the only team in this five-year window that saw more than half of their games decided by fewer than one run or more than seven. The 2017 Cubs are close to the 50% mark but still about 6% off the pace of the 2018 Cubs. Incidentally, you’ve probably already noticed that there are great and awful teams on this list. That’s because it’s possible to slot yourself on the leaderboard with substantially more boom than bust (like the 2019 Dodgers) or substantially more bust than boom (like the 2019 Marlins). Colorado shows up here a lot because Coors lends itself to a lot of high scoring games. It isn’t meant to be a metric of good or bad teams, only volatile ones that may have something lurking below the surface of an average wRC+ or a high run differential.
Notably absent from this list are the 2019 Cubs, despite the September 2019 run that saw the team score 59 runs during a five game winning streak. While there are still bursts of brilliant offense on the North Side, like the 55 run onslaught the Cubs put up in six games between April 17-23 this season, the offense has been trending more towards a bust since 2018.
How big of a bust? For that we need to return to some old school counting stats. Through the first 20 games of 2021, the Cubs had the second fewest number of hits that any Cubs team has had since 1974 (as far back as FanGraphs game-by-game counting stats go) while simultaneously amassing the second highest number of strikeouts for any Cubs team during the same time period. It’s a recipe for a lot of losses and the only reason this Cubs team wasn’t in much worse shape as April came to a close is that a stunning 20.4% of those hits left the yard. It is the highest number of home runs as a proportion of hits since 1974 through 20 games. The next closest season was 2004 when 17.9% of the Cubs 196 hits through 20 games left the yard. The 2021 team has substantially fewer hits than that 2004 club and home runs are unlikely to save a team that strikes out 26.9% of the time. You can see a sample of these not so superlative Cubs seasons along with their ultimate outcomes below (this table is sorted by fewest hits through 20 games), but the bottom line is this team’s early struggles offensively rival some of the most futile offenses in Cubs history:
| Year | AB | H | HR | % HR | R | BB | SO | AVG | wRC+ | 20G Record | Season Record | Season Outcome |
|---|---|---|---|---|---|---|---|---|---|---|---|---|
| 1997 | 660 | 136 | 10 | 7.4% | 64 | 57 | 110 | .206 | 49 | 3-17 | 68-94 | 5th NL Central |
| 2021 | 633 | 137 | 28 | 20.4% | 92 | 75 | 204 | .216 | 88 | 10-10 | 12-16 | Unknown |
| 1992 | 653 | 139 | 10 | 7.2% | 61 | 54 | 106 | .213 | 64 | 7-13 | 78-84 | 4th NL East |
| 1981 | 653 | 147 | 6 | 4.1% | 53 | 55 | 108 | .225 | 66 | 3-17 | 38-65 | 6th NL East |
| 1985 | 647 | 148 | 15 | 10.1% | 69 | 58 | 105 | .229 | 69 | 13-7 | 77-84 | 4th NL East |
| 1991 | 664 | 149 | 17 | 11.4% | 77 | 57 | 95 | .224 | 73 | 9-11 | 77-83 | 4th NL East |
| 1983 | 655 | 150 | 11 | 7.3% | 65 | 44 | 110 | .229 | 63 | 6-14 | 71-91 | 5th NL East |
| 2020 | 650 | 151 | 26 | 17.2% | 97 | 80 | 210 | .232 | 102 | 13-7 | 34-26 | 1st NL Central |
| 1979 | 656 | 154 | 14 | 9.1% | 69 | 79 | 105 | .235 | 77 | 10-10 | 80-82 | 5th NL East |
| 1974 | 668 | 154 | 17 | 11.0% | 85 | 91 | 92 | .231 | 83 | 8-12 | 66-96 | 6th NL East |
There are some reasons to be cautiously optimistic the Cubs could turn it around despite their appearance on a list of historically slow offensive starts. While the 88 wRC+ is nothing to write home about, it is the second highest tally on this list and as we saw above the offense has been trending up in recent games. Additionally, it’s worth noting that the roster is substantially similar to the only successful team on this list – the 2020 squad that managed to win the NL Central. The 2020 squad dealt with offensive outages after a hot start and was swept out of the playoffs when the bust cycle of their offense showed up against the Marlins in the Wild Card Series. A closer look at how the Marlins made such quick work of the Cubs bats is informative for the problems the 2021 Cubs are dealing with a month into the season. It turns out the starting pitchers for the 2020 Marlins were the perfect kryptonite for the Cubs – a rotation full of young pitchers with four-seam fastballs above 95 mph.
The Cubs have seen 52.3% fastballs in 2021, the fifth most in the league and they are unlikely to get a reprieve from those pitches any time soon based on this reporting from Jesse Rogers at ESPN:
There was a time when throwing the Cubs a fastball was a bad idea. From 2016 to 2018, the combination of Javy Baez, Anthony Rizzo and Kris Bryant hit .307 with a .559 slugging percentage against fastballs. But the numbers have steadily dropped since then, culminating in a .235 batting average and just a .419 slugging percentage over their past 75 games (the shortened 2020 season and first 15 games of this year).
As a team, the Cubs have a major league-worst .230 batting average and are slugging just .414 off fastballs in that time frame. Against fastballs of 95 mph or more, they’re hitting a paltry .178 since the start of 2020 and just .105 this season.
This checks out relative to the pitchers who have shut down Cubs hitting since the Wild Card Series. The Cubs have been held to one run or fewer 19 times in the last two seasons (17 times in the regular season and twice in the Marlins sweep). Below are the starting pitchers for those games along with key stats including the percentage of four-seam fastballs thrown in those games:
| Date | Team | SP | IP | RA | FB Velo | Normal Usage | Cubs Usage | Difference |
|---|---|---|---|---|---|---|---|---|
| 4/11/21 | PIT | Brubaker | 5.1 | 1 | 93 | 24.5% | 27.0% | 2.5% |
| 4/28/21 | ATL | Ynoa | 5.1 | 0 | 97 | 42.0% | 45.6% | 3.6% |
| 4/27/21 | ATL | Anderson | 7 | 0 | 95 | 44.8% | 47.8% | 3.0% |
| 4/25/21 | MIL | Woodruff | 6 | 0 | 97 | 37.6% | 58.2% | 20.6% |
| 4/14/21 | MIL | Burnes* | 6 | 0 | 97 | 1.4% | 2.5% | 1.1% |
| 4/6/21 | MIL | Peralta | 5 | 0 | 93 | 55.6% | 47.3% | -8.3% |
| 10/2/20 | MIA | Sanchez | 5 | 0 | 98 | 23.8% | 73.0% | 49.2% |
| 9/30/20 | MIA | Alcantara | 6.2 | 1 | 97 | 28.3% | 59.0% | 30.7% |
| 9/23/20 | PIT | Williams | 5.2 | 1 | 91 | 44.0% | 42.6% | -1.4% |
| 9/19/20 | MIN | Pineda | 5 | 1 | 91 | 55.1% | 53.3% | -1.8% |
| 9/18/20 | MIN | Hill | 7 | 1 | 89 | 41.3% | 44.2% | 2.9% |
| 9/5/20 | STL | Gomber | 2.2 | 1 | 91 | 45.1% | 63.6% | 18.5% |
| 8/25/20 | DET | Turnbull | 5.2 | 1 | 94 | 36.4% | 53.6% | 17.2% |
| 8/21/20 | CHW | Keuchel* | 8 | 1 | 88 | 2.1% | 6.1% | 4.0% |
| 8/17/20 | STL | Kim | 3.2 | 1 | 89 | 49.0% | 43.9% | -5.1% |
| 9/24/20 | PIT | Kuhl* | 7 | 0 | n/a | n/a | n/a | n/a |
| 9/20/20 | MIN | Berrios | 6 | 0 | 94 | 29.9% | 18.8% | -11.1% |
| 9/11/20 | MIL | Woodruff | 7 | 0 | 97 | 37.6% | 41.0% | 3.4% |
| 9/9/20 | CIN | Bauer | 7.2 | 0 | 94 | 43.7% | 54.5% | 10.8% |
Three of these games were pitched by pitchers who rarely or never throw four-seam fastballs. In three other games, four-seam fastball usage declined by more than 5% relative to the pitchers’ normal pitch mix. In the remaining 13 games, six saw four-seam fastball usage jump 10-49% relative to that starting pitcher’s standard pitching arsenal. Notably the two largest increases occurred during the Marlins Wild Card sweep of the Cubs. The only pitcher who appears on this list twice is Milwaukee’s Brandon Woodruff; his four-seam fastball usage against the Cubs jumped from 41% in September 2020 to 58.2% on April 25.
It’s still early in 2021. There are 131 games for the Cubs to make mechanical adjustments and change their approach at the plate. They are hot off a three-game sweep of the Dodgers and have almost fought their way back to a winning record. But at this point, their offensive slide is less about a single series, or brief offensive outburst, and more a multiple-year trend. The core of players who brought a World Series Championship to Wrigleyville will always be beloved, but they are going to need a better approach against fastballs to make another trip to the postseason in 2021.
for the boom or bust table, are the column headings right? It reads to me that it’s capturing “games the cubs scored GREATER than one run” or “games the cubs scored LESS than seven runs?”
Not sure it the column headings are mistaken or it’s the wrong data. (I could be mistaken too!)
The signs got mixed up. I’ll fix it. Thanks for the heads up.
First column is =7.
Sara, the verbiage before the table says “fewer than one run” and “more than seven runs.” That would be either a shutout or 8+ runs. I think you meant to say “one run or fewer” and “seven or more runs,” correct?
Hi Greg! It’s actually “fewer than or equal to one run” and “more than or equal to seven.” I’ll add the equals to qualifier.