
The Dodgers Dynasty Takes Its Place Among the Greats
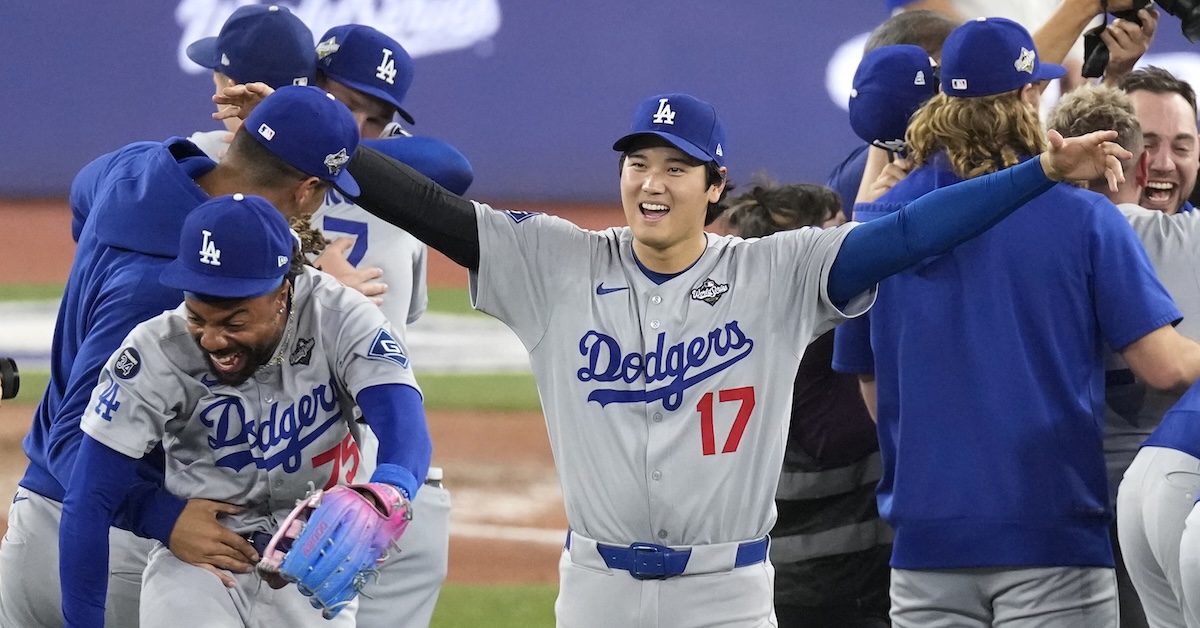
At the end of perhaps the most thrilling back-and-forth Game 7 in World Series history, with one out in the bottom of the 11th inning and the tying run on third base, Alejandro Kirk hit a chopper to shortstop. Mookie Betts raced over to second base to force out Addison Barger, and while running through the bag, fired a perfect strike into the outstretched glove of Freddie Freeman. The Dodgers’ second game-ending double play in as many nights didn’t just clinch the 2025 World Series, it made them the first team to win back-to-back championships since the 1999–2000 Yankees.
Dating back to their days in Brooklyn, the Dodgers have won nine championships, but this is the first time they’ve done so in consecutive seasons. Twice before, they had returned to the World Series as reigning champions only to lose, first to the Yankees in 1956 and then to the Orioles in ’66. Neither of those attempts to repeat involved surviving multiple playoff rounds before that. This time, the 93-win Dodgers went 13-4 in the postseason, first sweeping the 83-win Reds in the Wild Card Series and then defeating three of the four teams that finished with more wins: the 96-win Phillies (3-1 in the Division Series), 97-win Brewers (4-0 in the League Championship Series), and finally the 94-win Blue Jays (who themselves dispatched the 94-win Yankees in the Division Series). Despite being outpitched, outhit, and outscored in the World Series, the Dodgers outlasted the AL champions, with two of their four wins coming in extra innings, the last of those by deploying three of their four series starters in relief and by pulling off three of the 12 most impactful plays ever in terms of Championship Win Probability Added, namely Miguel Rojas’ game-tying home run in the top of the ninth (12th, +34.9% cWPA), Will Smith’s go-ahead solo shot in the top of the 11th inning (fifth, 41% cWPA), and Betts’ double play (fourth, +46.2% cWPA).
Once upon a time, winning back-to-back titles wasn’t uncommon. From 1903 through 2000 — a span of 96 World Series (none in 1904 or ’94) — 10 teams won two in a row, two won three in a row, one won four in a row, and one won five in a row. That’s 14 teams who won at least two World Series in a row (not double-counting any of them), and 21 times in which the World Series winner was the same as the year before. Here’s a breakdown, divided into (roughly) 20-year increments that fortunately don’t split up any back-to-back championships:
| Period | 2 Straight | 3 Straight | 4 Straight | 5 Straight | Total Repeats |
|---|---|---|---|---|---|
| 1903-1920 | 3 | 3 | |||
| 1921-1940 | 3 | 1 | 6 | ||
| 1941-1960 | 1 | 4 | |||
| 1961-1980 | 3 | 1 | 5 | ||
| 1981-2000 | 1 | 1 | 3 | ||
| 2001-2025 | 1 | 1 |
They don’t make ’em like that anymore, and it’s not hard to understand why. The demise of the reserve clause and rise of free agency following the landmark Messersmith–McNally decision in 1975 meant that teams could no longer maintain their core players indefinitely. Free agency accelerated the ability of clubs to amass talent without having to rely solely on drafting or signing amateur players or making flurries of trades. Yes, it generally took — and still takes — money, but if money were the sole determinant of winning, the Yankees and Dodgers would be dominating the 21st century, at least to a greater degree than they’ve done.
According to Cot’s Contracts, the Yankees had the majors’ highest year-end 40-man payroll 12 times in a row from 2002–13, but they won only one championship and one other pennant in that span even while making the playoffs 10 times. That same data shows the Dodgers leading the majors seven times since 2014, the second year after Guggenheim Baseball Management purchased the team from Frank McCourt, who had driven the Dodgers into bankruptcy. They’ve converted that into three championships, but they’ve also had seasons where their championship ambitions were thwarted by lower-spending teams.
The disconnect between money and championships — or between regular-season success and championships, the thrust of this article — owes plenty to the expansion of the playoff field, which began with the advent of division play in 1969. The playoffs have turned the postseason into a tournament where even powerhouses can get knocked out in best-of-five or best-of-seven series before getting to play for the championship. It’s the hottest team that wins it all, and upsets are part of the fun and/or heartbreak — a cornerstone of baseball history. As measured by the gap between the regular-season winning percentages of the losing team and the winning team, three of the six biggest postseason upsets involved the Dodgers getting bounced in 2021 (by the Braves in the NLCS), ’22 (by the Padres in the NLDS), and ’23 (by the Diamondbacks in the NLDS). The irony is that at least by won-loss records, those Dodgers teams were better in the regular season than either of the two World Series winners that followed; in fact, the 2021 team held a share of the franchise record for wins until the ’22 team topped it, while this year’s team won fewer games than any full-season Dodgers team since 2018 (which still won a pennant).
The Dodgers have now reached the postseason in 13 consecutive seasons, via 12 NL West titles and one Wild Card berth. Under president of baseball operation Andrew Friedman and manager Dave Roberts, they’ve won five pennants in the past nine seasons, and three championships in the past six. That’s the closest proximity in which the franchise has won three times, beating out their three-in-seven-years stretch from 1959–65 and their continent-spanning three-in-nine-years run from ’55–63.
| Season | W | L | W-L% | Finish | Playoffs | Manager |
|---|---|---|---|---|---|---|
| 2013 | 92 | 70 | .568 | 1 | Lost NLCS (4-2) | Don Mattingly |
| 2014 | 94 | 68 | .580 | 1 | Lost NLDS (3-1) | Don Mattingly |
| 2015 | 92 | 70 | .568 | 1 | Lost NLDS (3-2) | Don Mattingly |
| 2016 | 91 | 71 | .562 | 1 | Lost NLCS (4-2) | Dave Roberts |
| 2017 | 104 | 58 | .642 | 1 | Lost WS (4-3) | Dave Roberts |
| 2018 | 92 | 71 | .564 | 1 | Lost WS (4-1) | Dave Roberts |
| 2019 | 106 | 56 | .654 | 1 | Lost NLDS (3-2) | Dave Roberts |
| 2020 | 43 | 17 | .717 | 1 | Won WS (4-2) | Dave Roberts |
| 2021 | 106 | 56 | .654 | 2 | Lost NLCS (4-2) | Dave Roberts |
| 2022 | 111 | 51 | .685 | 1 | Lost NLDS (3-1) | Dave Roberts |
| 2023 | 100 | 62 | .617 | 1 | Lost NLDS (3-0) | Dave Roberts |
| 2024 | 98 | 64 | .605 | 1 | Won WS (4-1) | Dave Roberts |
| 2025 | 93 | 69 | .574 | 1 | Won WS (4-3) | Dave Roberts |
Last year, in the wake of their five-game victory over the Yankees, I noted that the Dodgers had separated themselves from what we might call the other playoff dynasties, clubs with sustained runs of excellence that culminated in only a single World Series win, as opposed to the more traditional notion of a dynasty that comes with capturing consecutive championships, à la the 1972–74 A’s, ’75–76 Reds, ’98–2000 Yankees, and their ilk. The Orioles won six division titles and four pennants from 1969–79 under Earl Weaver, but only won the World Series in ’70. Bobby Cox led the Braves to 14 consecutive postseason appearances from 1991–2005 — division titles in every year except the strike-shortened ’94 season, when there were no playoffs — and five World Series appearances, yet ’95 was the only year in which Atlanta won it all during that stretch. Since winning four World Series in five years with Joe Torre managing from 1996–2000, the Yankees have added four pennants and 20 playoff appearances under Torre and successors Joe Girardi and current skipper Aaron Boone, but Girardi’s ’09 team is the only one to win a championship.
With this year’s win, the Dodgers have leveled up again. Since the Yankees’ three-peat from 1998–2000, only two other teams have won at least three titles: the Red Sox (four, in 2004, ’07, ’13, and ’18) and Giants (three, in 2010, ’12, and ’14). Between those championships, both of those teams had seasons where they not only missed the playoffs, but also sank below .500.
After the Dodgers won in 2020, I took a swing at evaluating how their run — at that time three pennants and one championship within a four-year period — stacked up in the context of other stretches of success by teams in the post-1960 expansion era. In a process that taxed the limits of my Excel skills and my post-World Series brain, I used Standard Deviation Scores (Z-scores) to measure how far above average each team’s winning percentage and per-game run differential were across rolling five-year periods. The methodology harkened back to the 2000 Rob Neyer and Eddie Epstein book Baseball Dynasties: The Greatest Teams of All Time, though it didn’t quite replicate what they did, as I couldn’t find my copy within my then-disorganized library. I’ve since found it, but I’ve stuck with my methodology, revisiting it a few times since.
For this exercise, I ran the numbers in a few different ways. First, here’s how the 2025 Dodgers rank based on their three-year scores for winning percentage and run differential (Neyer and Epstein used three years but did separate measures for run scoring and run prevention):
| Rk | Team | Years | Win% | Win%Score | Rdif/Gm | Rdif Score | Tot Score |
|---|---|---|---|---|---|---|---|
| 1 | Dodgers | 2022–24 | .636 | 6.09 | 1.43 | 7.30 | 13.40 |
| 2 | Dodgers | 2021–23 | .652 | 5.80 | 1.67 | 7.21 | 13.01 |
| 3 | Dodgers | 2019–21 | .664 | 6.04 | 1.77 | 6.62 | 12.66 |
| 4 | Dodgers | 2020–22 | .677 | 5.88 | 1.92 | 6.36 | 12.24 |
| 5 | Dodgers | 2018–20 | .626 | 5.42 | 1.57 | 6.41 | 11.83 |
| 6 | Yankees | 1997–99 | .634 | 5.61 | 1.40 | 6.17 | 11.78 |
| 7 | Athletics | 1988–90 | .630 | 6.19 | 0.99 | 5.58 | 11.77 |
| 8 | Orioles | 1969–71 | .660 | 5.62 | 1.44 | 6.00 | 11.63 |
| 9 | Dodgers | 2023–25 | .599 | 5.08 | 1.04 | 6.40 | 11.48 |
| 10 | Braves | 1996–98 | .623 | 5.72 | 1.19 | 5.69 | 11.41 |
| 11 | Braves | 1995–97 | .613 | 6.08 | 0.94 | 5.32 | 11.40 |
| 12 | Mets | 1986–88 | .620 | 5.27 | 1.04 | 5.92 | 11.19 |
| 13 | Braves | 1997–99 | .638 | 5.77 | 1.30 | 5.37 | 11.14 |
| 14 | Braves | 2022–24 | .605 | 4.91 | 1.05 | 6.02 | 10.93 |
| 15 | Dodgers | 2017–19 | .620 | 5.00 | 1.35 | 5.50 | 10.50 |
| 16 | Yankees | 1996–98 | .621 | 5.19 | 1.23 | 5.29 | 10.48 |
| 17 | Reds | 1974–76 | .634 | 5.37 | 1.28 | 4.98 | 10.35 |
| 18 | Cleveland | 1994–96 | .634 | 5.44 | 1.28 | 4.88 | 10.32 |
| 19 | Braves | 2021–23 | .604 | 4.51 | 1.12 | 5.72 | 10.23 |
| 20 | Reds | 1973–75 | .628 | 5.61 | 1.07 | 4.61 | 10.22 |
| 21 | Mets | 1985–87 | .613 | 4.81 | 0.94 | 5.33 | 10.14 |
| 22 | Orioles | 1968–70 | .634 | 4.77 | 1.16 | 4.90 | 9.67 |
| 23 | Braves | 1994–96 | .605 | 5.29 | 0.77 | 4.36 | 9.65 |
| 24 | Yankees | 2009–11 | .607 | 4.58 | 1.11 | 4.99 | 9.57 |
| 25 | Braves | 1993–95 | .624 | 5.14 | 0.97 | 4.39 | 9.53 |
| 26 | Braves | 1991–93 | .609 | 4.60 | 0.88 | 4.92 | 9.52 |
Dodgers teams of recent vintage dominate this list, but the only three-year run that includes two championships ranks behind four other iterations, one of which (2021–23) doesn’t include either of their last two World Series winners. It’s not hard to understand why. This year’s team was a regular-season laggard by comparison. Not only was its .574 winning percentage lower than any season since 2018, but also its run differential (0.88 runs per game, +142 runs over the course of a full season) was its lowest since ’16; both dragged the team’s three-year scores down a bit relative to its other recent three-year runs.
Of course, that has less to do with the Dodgers being a weaker team than one that couldn’t stay healthy. According to the Baseball Prospectus Injured List Ledger, Dodgers players spent a major league-high 2,528 days on the IL, with regulars Freeman, Smith, Tommy Edman, Teoscar Hernández, and Max Muncy all spending time there, along with every starting pitcher of note besides Yoshinobu Yamamoto, and several key members of their bullpen, with Michael Kopech, Evan Phillips, Brock Stewart, and Kirby Yates all out of commission by October. Yet as Dan Szymborski noted last week, the version of the Dodgers playing in the World Series was just about the strongest they could muster, one that ZiPS projected would win 104 games over a full season, not 93.
Moving beyond the Dodgers, the 1997–99 Yankees won two titles, but the ’88–90 A’s and ’69–71 Orioles each won just one while making the World Series in all three of those years. Several three-year runs by the Braves are represented, but the ones that incorporate their championships from 1995 and 2021 rank below some that merely won pennants.
Turning to the five-year runs, it’s again all Dodgers atop the list, but the span incorporating this year’s iteration isn’t on top:
| Rk | Tm | Years | Win% | %Score | Dif/Gm | DifScore | TotScore | WS W | WS L |
|---|---|---|---|---|---|---|---|---|---|
| 1 | Dodgers | 2019–23 | .658 | 10.20 | 1.72 | 11.87 | 22.07 | 1 | 0 |
| 2 | Dodgers | 2020–24 | .647 | 10.08 | 1.56 | 11.73 | 21.81 | 2 | 0 |
| 3 | Dodgers | 2018–22 | .646 | 8.96 | 1.70 | 10.30 | 19.26 | 1 | 1 |
| 4 | Dodgers | 2017–21 | .636 | 8.99 | 1.50 | 9.93 | 18.91 | 1 | 2 |
| 5 | Dodgers | 2021–25 | .627 | 8.61 | 1.37 | 10.29 | 18.90 | 2 | 0 |
| 6 | Braves | 1995–99 | .626 | 9.67 | 1.09 | 8.57 | 18.24 | 1 | 2 |
| 7 | Braves | 1994–98 | .620 | 9.28 | 1.05 | 8.31 | 17.59 | 1 | 1 |
| 8 | Braves | 1993–97 | .617 | 9.06 | 1.00 | 8.25 | 17.30 | 1 | 1 |
| 9 | Dodgers | 2016–20 | .615 | 8.28 | 1.24 | 8.71 | 16.98 | 1 | 2 |
| 10 | Braves | 1996–2000 | .619 | 8.78 | 1.06 | 8.07 | 16.85 | 0 | 2 |
| 11 | Reds | 1972–76 | .626 | 8.68 | 1.11 | 7.73 | 16.42 | 2 | 0 |
| 12 | Braves | 1992–96 | .613 | 8.53 | 0.87 | 7.85 | 16.38 | 1 | 1 |
| 13 | Orioles | 1969–73 | .620 | 7.46 | 1.22 | 8.84 | 16.30 | 1 | 2 |
| 14 | Mets | 1986–90 | .592 | 7.07 | 0.93 | 9.00 | 16.07 | 1 | 0 |
| 15 | Mets | 1985–89 | .600 | 7.19 | 0.89 | 8.56 | 15.75 | 1 | 0 |
| 16 | Braves | 1991–95 | .610 | 8.17 | 0.84 | 7.54 | 15.71 | 1 | 2 |
| 17 | Yankees | 1994–98 | .607 | 7.63 | 1.07 | 7.42 | 15.06 | 2 | 0 |
| 18 | Athletics | 1971–75 | .594 | 7.18 | 0.88 | 7.83 | 15.00 | 3 | 0 |
| 19 | Braves | 1997–2001 | .609 | 7.74 | 1.01 | 7.24 | 14.98 | 0 | 1 |
| 20 | Orioles | 1968–72 | .613 | 6.81 | 1.08 | 8.02 | 14.83 | 1 | 2 |
| 21 | Yankees | 1996–2000 | .602 | 7.40 | 1.02 | 7.40 | 14.80 | 4 | 0 |
| 22 | Reds | 1973–77 | .611 | 7.75 | 1.01 | 7.04 | 14.79 | 2 | 0 |
| 23 | Yankees | 1997–01 | .607 | 7.38 | 1.03 | 7.39 | 14.77 | 3 | 1 |
| 24 | Yankees | 1995–99 | .605 | 7.24 | 1.04 | 7.36 | 14.61 | 3 | 0 |
| 25 | Mets | 1984–88 | .604 | 7.61 | 0.75 | 6.85 | 14.46 | 1 | 0 |
| 26 | Braves | 2019–23 | .601 | 6.73 | 1.01 | 7.71 | 14.44 | 1 | 0 |
| 27 | Braves | 2020–24 | .590 | 6.31 | 0.99 | 8.09 | 14.40 | 1 | 0 |
| 28 | Orioles | 1970–74 | .598 | 6.87 | 0.95 | 7.51 | 14.38 | 0 | 1 |
| 29 | Athletics | 1988–92 | .600 | 8.04 | 0.66 | 6.30 | 14.33 | 1 | 2 |
| 30 | Orioles | 1966–70 | .596 | 6.34 | 0.96 | 7.66 | 14.00 | 2 | 1 |
For this version, I’ve included the number of World Series each team won and lost during that five-year span, as well. Surprisingly, the Dodgers have the only two-time winners in the top 10, one span that incorporates their 2020 win — which can be regarded as skewing things a bit given their .717 winning percentage and 2.27 runs-per-game differential across a 60-game schedule — while the other includes this year’s title. Either way, they rank ahead of powerhouses such as the Big Red Machine; a span of Yankees success that included the strike year and the end of Buck Showalter’s tenure, as well as the first two championships under Torre; the dominant A’s from the first half of the 1970s; and then the most decorated iteration of Torre’s Yankees. All of this underscores just how hard it is to maintain a long run of dominance in the regular season while also kicking ass with some consistency in the postseason.
I ran one other version of the table, for seven-year spans:
| Rk | Tm | Years | Win% | Win%Score | Rdif/Gm | Rdif Score | Tot Score | WS W | WS L |
|---|---|---|---|---|---|---|---|---|---|
| 1 | Dodgers | 2017–23 | .641 | 13.15 | 1.55 | 11.87 | 25.02 | 1 | 2 |
| 2 | Dodgers | 2018–24 | .635 | 13.16 | 1.52 | 11.73 | 24.89 | 2 | 1 |
| 3 | Dodgers | 2019–25 | .637 | 13.01 | 1.47 | 10.29 | 23.30 | 3 | 0 |
| 4 | Dodgers | 2016–22 | .632 | 11.81 | 1.44 | 10.30 | 22.11 | 1 | 2 |
| 5 | Braves | 1993–99 | .625 | 12.64 | 1.09 | 8.57 | 21.21 | 1 | 2 |
| 6 | Braves | 1992–98 | .621 | 12.53 | 1.03 | 8.31 | 20.83 | 1 | 2 |
| 7 | Dodgers | 2015–21 | .614 | 10.79 | 1.18 | 9.93 | 20.72 | 1 | 2 |
| 8 | Braves | 1994–2000 | .617 | 12.34 | 0.99 | 8.07 | 20.42 | 1 | 2 |
| 9 | Braves | 1991–97 | .610 | 12.08 | 0.90 | 8.25 | 20.33 | 1 | 3 |
| 10 | Dodgers | 2014–20 | .602 | 10.56 | 1.02 | 8.71 | 19.26 | 1 | 2 |
| 11 | Braves | 1995–2001 | .608 | 11.64 | 0.94 | 7.24 | 18.88 | 1 | 2 |
| 12 | Reds | 1970–76 | .607 | 10.70 | 0.88 | 7.73 | 18.43 | 2 | 2 |
| 13 | Mets | 1984–90 | .588 | 9.41 | 0.75 | 9.00 | 18.41 | 1 | 0 |
| 14 | Braves | 1996–2002 | .610 | 11.14 | 0.96 | 6.44 | 17.58 | 0 | 2 |
| 15 | Braves | 1997–2003 | .614 | 11.23 | 0.99 | 6.17 | 17.40 | 0 | 1 |
| 16 | Orioles | 1968–74 | .603 | 9.79 | 0.98 | 7.51 | 17.30 | 1 | 2 |
| 17 | Yankees | 1993–99 | .597 | 9.89 | 0.96 | 7.36 | 17.25 | 3 | 0 |
| 18 | Yankees | 1994–2000 | .597 | 9.84 | 0.96 | 7.40 | 17.25 | 4 | 0 |
| 19 | Orioles | 1965–71 | .600 | 9.03 | 0.93 | 7.68 | 16.71 | 2 | 2 |
| 20 | Orioles | 1967–73 | .591 | 7.87 | 1.00 | 8.84 | 16.71 | 1 | 2 |
| 21 | Orioles | 1969–75 | .604 | 9.84 | 1.03 | 6.83 | 16.67 | 1 | 2 |
| 22 | Braves | 2018–24 | .586 | 8.53 | 0.89 | 8.09 | 16.62 | 1 | 0 |
| 23 | Yankees | 2005–11 | .591 | 9.05 | 0.93 | 7.41 | 16.45 | 1 | 0 |
| 24 | Orioles | 1966–72 | .592 | 8.38 | 0.96 | 8.02 | 16.41 | 2 | 2 |
| 25 | Yankees | 1995–2001 | .594 | 9.01 | 0.87 | 7.39 | 16.40 | 4 | 1 |
| 26 | Yankees | 2006–12 | .591 | 9.26 | 0.96 | 7.11 | 16.37 | 1 | 0 |
| 27 | Reds | 1972–78 | .606 | 10.43 | 0.88 | 5.92 | 16.34 | 2 | 1 |
| 28 | Yankees | 1996–2002 | .606 | 9.77 | 0.98 | 6.51 | 16.29 | 4 | 1 |
| 29 | Yankees | 2004–10 | .594 | 9.13 | 0.82 | 7.07 | 16.20 | 1 | 0 |
| 30 | Dodgers | 2013–19 | .591 | 9.24 | 0.87 | 6.93 | 16.17 | 0 | 2 |
This one makes the best case for the current Dodgers, as a version that incorporates all three champions ranks third, not far behind two other recent iterations that at least won three pennants. However, I do have to point out that seven years leaves a lot of time for roster turnover. The 2019 Dodgers, who won 106 games — nine more than any other NL team — had Muncy, Enrique Hernández, Smith as a midseason call-up, and Clayton Kershaw in his last season making at least 25 starts, plus smaller contributions from the since-traded Dustin May and the now-injured Tony Gonsolin. That’s not a lot of end-to-end continuity when compared to some of those other high-ranking teams. The 2020 Dodgers added Betts and, uh, Blake Treinen, but key players who fueled that championship — such as Cody Bellinger, Corey Seager, Justin Turner, and Julio Urías — were gone by ’24, and Kershaw’s role in these last two championships was rather minimal.
The seven-year problem isn’t just confined to the Dodgers. The various iterations of the 1990s Braves — who won just one championship no matter how you slice it — at least began with Hall of Famers Tom Glavine and John Smoltz anchoring their rotation, with Greg Maddux and Fred McGriff arriving in 1993, but Chipper Jones didn’t cement his lineup spot until 1995, and Andruw Jones burst on the scene late the next year. The top-ranked version of the Reds had Johnny Bench, Tony Perez, and Pete Rose, but Joe Morgan didn’t arrive until 1972. The “Core Four” Yankees — Derek Jeter, Andy Pettitte, Jorge Posada, and Mariano Rivera — all debuted in 1995, though only Pettitte was a major contributor to that team until the Yankees moved Rivera to the bullpen for good in September. The 1966–72 Orioles, who won two championships and four pennants, were managed not by Weaver at the outset but by Hank Bauer; they swept the Dodgers that first year with a team that included so many mainstays who would fuel that run, including Hall of Famers Brooks Robinson, Frank Robinson (traded after 1971), and a rookie Jim Palmer, as well as Paul Blair, Davey Johnson, and Boog Powell.
While I could have run a six-year version that made an even better case for the current Dodgers, I think five years is enough to place them in the pantheon of great teams. Condensing that previous list to include only teams that won two World Series, and fleshing out the rankings with other expansion-era spans that won multiple championships, brings us this:
| Rk | Tm | Years | Win% | Win%Score | Rdif/Gm | Rdif Score | Tot Score | WS W | WS L |
|---|---|---|---|---|---|---|---|---|---|
| 1 | Dodgers | 2020–24 | .647 | 10.08 | 1.56 | 11.73 | 21.81 | 2 | 0 |
| 2 | Dodgers | 2021–25 | .627 | 8.61 | 1.37 | 10.29 | 18.90 | 2 | 0 |
| 3 | Reds | 1972–76 | .626 | 8.68 | 1.11 | 7.73 | 16.42 | 2 | 0 |
| 4 | Yankees | 1994–98 | .607 | 7.63 | 1.07 | 7.42 | 15.06 | 2 | 0 |
| 5 | Athletics | 1971–75 | .594 | 7.18 | 0.88 | 7.83 | 15.00 | 3 | 0 |
| 6 | Yankees | 1996–2000 | .602 | 7.40 | 1.02 | 7.40 | 14.80 | 4 | 0 |
| 7 | Reds | 1973–77 | .611 | 7.75 | 1.01 | 7.04 | 14.79 | 2 | 0 |
| 8 | Yankees | 1997–2001 | .607 | 7.38 | 1.03 | 7.39 | 14.77 | 3 | 1 |
| 9 | Yankees | 1995–99 | .605 | 7.24 | 1.04 | 7.36 | 14.61 | 3 | 0 |
| 10 | Orioles | 1966–70 | .596 | 6.34 | 0.96 | 7.66 | 14.00 | 2 | 1 |
| 11 | Athletics | 1972–76 | .576 | 6.26 | 0.83 | 7.60 | 13.86 | 3 | 0 |
| 12 | Yankees | 1998–2002 | .617 | 7.20 | 1.02 | 6.51 | 13.71 | 3 | 1 |
| 13 | Athletics | 1970–74 | .582 | 6.23 | 0.80 | 7.14 | 13.37 | 3 | 0 |
| 14 | Yankees | 1976–80 | .607 | 6.86 | 0.88 | 6.20 | 13.05 | 2 | 1 |
| 15 | Reds | 1974–78 | .603 | 7.11 | 0.89 | 5.92 | 13.03 | 2 | 0 |
| 16 | Reds | 1971–75 | .597 | 6.91 | 0.84 | 6.02 | 12.93 | 2 | 1 |
| 17 | Yankees | 1961–65 | .600 | 6.20 | 0.84 | 6.18 | 12.37 | 2 | 2 |
| 18 | Red Sox | 2007–11 | .574 | 5.45 | 0.88 | 6.90 | 12.34 | 2 | 0 |
| 19 | Red Sox | 2004–08 | .580 | 5.58 | 0.79 | 6.27 | 11.86 | 2 | 0 |
| 20 | Yankees | 1974–78 | .582 | 5.86 | 0.78 | 5.94 | 11.80 | 2 | 1 |
| 21 | Blue Jays | 1989–93 | .564 | 5.57 | 0.56 | 5.81 | 11.38 | 2 | 0 |
| 22 | Yankees | 1977–81 | .598 | 5.69 | 0.84 | 5.67 | 11.35 | 2 | 1 |
| 23 | Yankees | 1999–2003 | .600 | 5.89 | 0.84 | 5.19 | 11.08 | 2 | 2 |
| 24 | Yankees | 1975–79 | .583 | 5.37 | 0.80 | 5.68 | 11.05 | 2 | 1 |
| 25 | Athletics | 1969–73 | .580 | 5.43 | 0.70 | 5.51 | 10.94 | 2 | 0 |
| 26 | Red Sox | 2003–07 | .580 | 5.21 | 0.79 | 5.65 | 10.86 | 2 | 0 |
| 27 | Blue Jays | 1990–94 | .554 | 4.45 | 0.47 | 4.69 | 9.14 | 2 | 0 |
| 28 | Athletics | 1973–77 | .535 | 3.57 | 0.47 | 4.75 | 8.32 | 2 | 0 |
| 29 | Giants | 2010–14 | .538 | 2.81 | 0.20 | 1.73 | 4.54 | 3 | 0 |
| 30 | Blue Jays | 1991–95 | .528 | 2.49 | 0.16 | 2.02 | 4.51 | 2 | 0 |
| 31 | Giants | 2012–16 | .530 | 2.12 | 0.26 | 2.17 | 4.29 | 2 | 0 |
| 32 | Giants | 2009–13 | .538 | 2.71 | 0.20 | 1.43 | 4.14 | 2 | 0 |
| 33 | Giants | 2011–15 | .528 | 2.00 | 0.15 | 1.37 | 3.37 | 2 | 0 |
| 34 | Giants | 2008–12 | .533 | 2.33 | 0.13 | 0.91 | 3.23 | 2 | 0 |
| 35 | Blue Jays | 1992–96 | .505 | 0.79 | 0.02 | 0.89 | 1.68 | 2 | 0 |
Down near the bottom of this sortable table, you can see how the Giants’ on-off pattern costs them greatly in this comparison, and likewise the Blue Jays’ quick fade after winning in 1992–93. (They were stronger at the outset of the run that culminated with those championships.) A bit higher up you can see various iterations of two-championship Red Sox teams from the 2004–11 span, the Yankees’ 1961–65 squad (the earliest possible using the 1961 cutoff for this whole exercise), and so on. And again, take your pick between the two Dodgers runs; it’s reasonable to prefer the 2021–25 one if you feel the pandemic-shortened season is weighted too heavily.
While I could have tried to produce some ultimate ranking of expansion-era dynasties by weighing the championships and pennants with the Z-scores, that felt too subjective for this set of objective measures (which nonetheless did involve some subjective choices). I think this ranking illustrates that it’s very tough to maintain regular-season dominance over a stretch that includes multiple championships, and that the Dodgers of recent vintage are at or near the top of the mix thanks to the way they’ve backed their consistency from April through September (give or take a few days on either end) with what they’ve done in October. It’s pretty clear that you can’t win ’em all, but this Dodgers dynasty can stand with the best of the expansion era.
Brooklyn-based Jay Jaffe is a senior writer for FanGraphs, the author of The Cooperstown Casebook (Thomas Dunne Books, 2017) and the creator of the JAWS (Jaffe WAR Score) metric for Hall of Fame analysis. He founded the Futility Infielder website (2001), was a columnist for Baseball Prospectus (2005-2012) and a contributing writer for Sports Illustrated (2012-2018). He has been a recurring guest on MLB Network and a member of the BBWAA since 2011, and a Hall of Fame voter since 2021. Follow him on BlueSky @jayjaffe.bsky.social.
You forgot the
*****
Is that your mother’s tramp stamp?