There Were Fewer Homers This Year, but the Long Ball Still Reigns Supreme

MLB’s plan to de-juice the baseball this year seems to have worked. Home runs were down in 2021 compared to the last couple of seasons, though not by so much as to warrant a complete shift in the game’s current offensive paradigm. Instead, run scoring — which remains heavily concentrated around home runs — decreased overall. Non-pitchers hit just .247/.321/.418 this year, representing the second-lowest batting average in the live ball era (1920-present and excluding 2020) but the fourth-highest isolated power.
In slightly de-juicing the baseball, MLB erased some home runs. But as we can see in the sudden drop in batting average, which is down nine points for non-pitchers compared to 2019, shaving off homers didn’t result in other types of hits. As I wrote in my second of two pieces analyzing early 2021 home run trends, these lost homers mostly just became outs. That explains the significant reduction in overall offense, even as the league-wide home run total remained quite high in the context of baseball history.
With the season now officially complete, it’s time to revisit some of those early trends to get a final estimation of the effect of MLB’s de-juicing. Of course, there is a significant, potentially confounding, variable that makes 2021 different from other full seasons and complicates our analysis: the midseason enforcement against the use of sticky stuff. I will try to account for that here, though it probably deserves its own standalone examination.
I’ll get to figuring out the exact effects of the 2021 ball in a moment, but first, let’s discuss the top line figures. Batters hit 5,944 home runs this season, the third-highest single-season total in baseball history, behind just 2019 (6,776) and ’17 (6,105). The Blue Jays led baseball with 262 homers, which is the seventh-highest single-season team home run total of all-time. The Pirates, meanwhile, trailed the rest of baseball with just 124 long balls, a figure that is tied for 1,250th out of the 2,985 team-seasons on our leaderboards. The four homer-happiest team seasons all came in 2019, with the Twins’ 309 home runs that year the most ever for any team in a single season; the Marlins hit the fewest home runs in 2019, with 146.
Five players hit at least 40 home runs this season, with Vladimir Guerrero Jr. and Salvador Perez tying for the major-league lead with 48 apiece; Shohei Ohtani (46), Marcus Semien (45), and Fernando Tatis Jr. (42) joined them in the elusive 40-home run club. All told, 43 players hit at least 30 home runs this season and 102 players hit at least 20. In 2019, Pete Alonso led baseball with 53 homers; ten players homered at least 40 times, 58 hit at least 30, and 129 slugged at least 20. No matter how you slice it, 2019 was a fireworks show compared to this season.
Here’s what major league home run totals have looked like since 2015. Metrics such as home run per plate appearance and home run per batted ball are especially key, as rule changes (such as seven-inning doubleheaders) and a decrease in batted ball events overall can influence the raw total:
| Season | HR | PA | BBE | HR/PA% | HR/BBE% |
|---|---|---|---|---|---|
| 2015 | 4,909 | 183,627 | 130,506 | 2.67% | 3.76% |
| 2016 | 5,610 | 184,577 | 128,856 | 3.04% | 4.35% |
| 2017 | 6,105 | 185,295 | 127,599 | 3.29% | 4.78% |
| 2018 | 5,585 | 185,139 | 126,324 | 3.02% | 4.42% |
| 2019 | 6,776 | 186,516 | 125,814 | 3.63% | 5.39% |
| 2020 | 2,304 | 66,506 | 44,007 | 3.46% | 5.24% |
| 2021 | 5,944 | 181,817 | 121,766 | 3.27% | 4.88% |
On a per-plate-appearance basis, home runs were down about 5.5% this year compared to 2020 and down about 10% compared to ’19. On a per-batted-ball basis, home runs were down about 7% from 2020 and about 9.5% from ’19. Those aren’t awful outcomes for my early-May projection of a roughly-8% decrease in home runs compared to 2019; that figure also estimated the home run total assuming hitters would receive the same number of plate appearances in 2021 as they did in ’19. On a per-plate-appearance basis, my early-May projection of a 3.35% home run rate was just 0.08 points off from the actual 2021 figure. Not too bad.
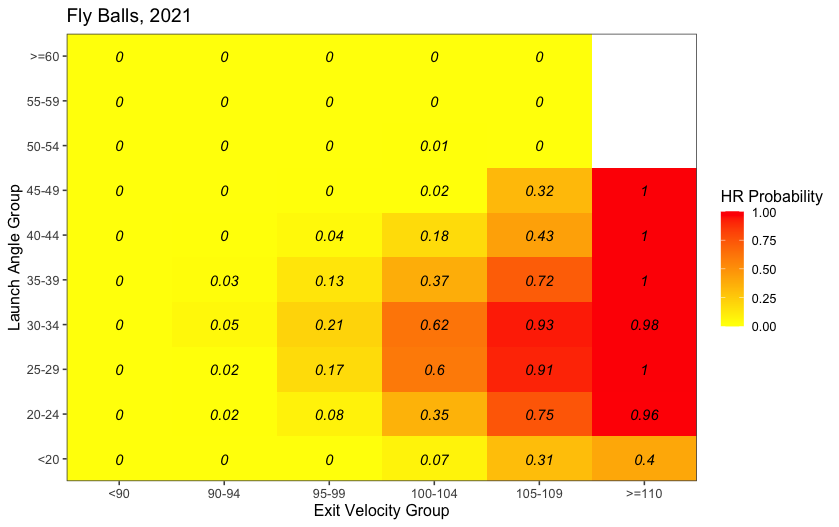
We can re-run my earlier analysis to see where home runs were lost compared to 2019. I again binned every fly ball by exit velocity and launch angle and took the home run per batted ball rate for each bin. Here is how the two seasons compare. First, 2021:
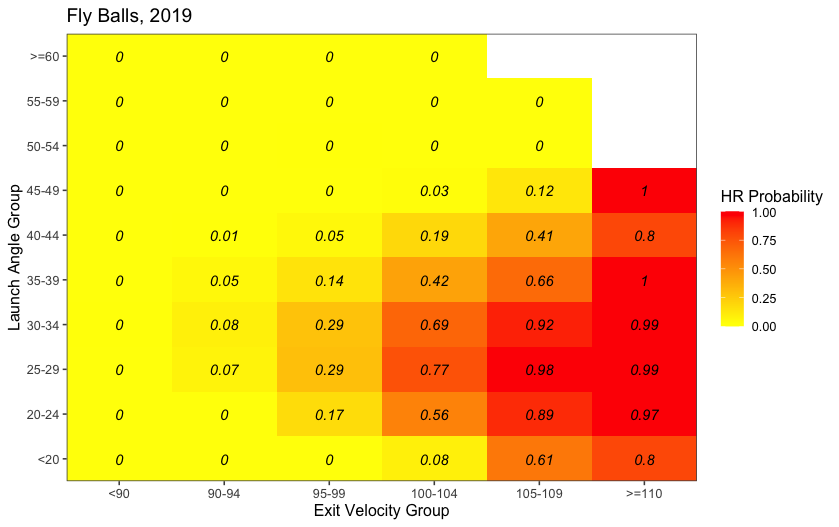
And now 2019:
To help us spot the differences, here is a comparison plot. Negative values represent a decrease from 2019 to ’21:
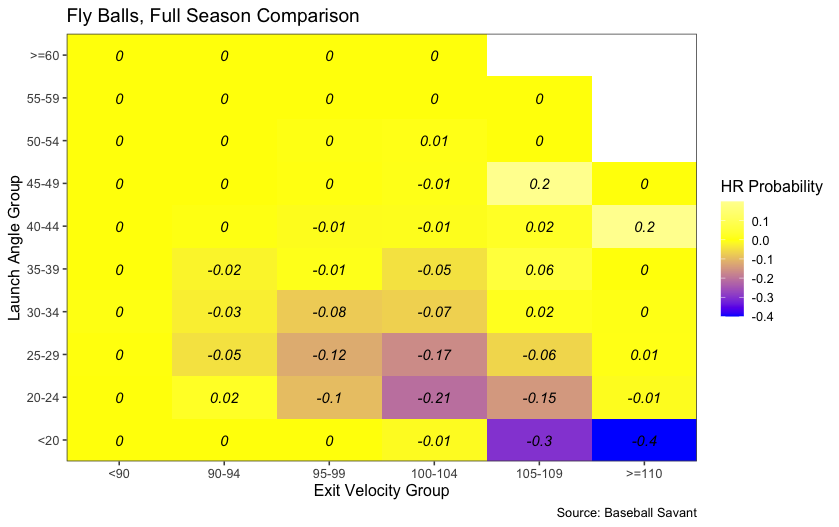
This is very similar to what I found from looking at just the April batted ball data. With a less aerodynamic baseball, the batted balls that would have gone over the wall in 2019 fell short. This had the greatest effect on the batted balls hit at the lowest launch angles because of reduced carry. Indeed, among all fly balls hit below 25 degrees of launch angle irrespective of exit velocity, 58% went for home runs in 2019 compared to just 47% in ’21. Hit the ball at or above 25 degrees of launch angle, and the difference in home run rate is just two percentage points. The hard-hit, low-launch-angle fly ball — those in the bottom right corner of the charts — just weren’t homers as often this year, as there simply wasn’t the carry on those balls there was in 2019. Again, this is exactly what we expected based on both what MLB indicated they were doing with the baseball and on the early returns from April.
Of course, there’s still the matter of sticky stuff. As Rob Arthur wrote at Baseball Prospectus in mid-June, sticky stuff might have a muting effect on home runs, with decreased carry on fly balls overall. This throws a huge wrench into our relatively neat data, providing a confounding variable that makes it uniquely difficult to compare 2021 to any previous year. While I did notice a slight uptick in league-wide offense in the immediate aftermath of increased enforcement, more research must be done to evaluate the complete effect. It also seems plausible that pitchers figured out a way to get around the increased enforcement, further complicating things. This creates headaches for analysis, so let’s evaluate the home run rates through June 2, since June 3 is when the news first broke that MLB planned on cracking down.
The numbers paint a similar story, but with a more extreme drop-off from 2019 to ’21. This also doesn’t account for other factors like weather, which can be variable from year-to-year, especially in segment-of-season sample sizes:
| Season | HR | PA | BBE | HR/PA% | HR/BBE% |
|---|---|---|---|---|---|
| 2015 | 1,481 | 58,801 | 41931 | 2.52% | 3.53% |
| 2016 | 1,766 | 61,031 | 42,556 | 2.89% | 4.15% |
| 2017 | 1,992 | 62,124 | 42,788 | 3.21% | 4.66% |
| 2018 | 1,962 | 66,200 | 44,975 | 2.96% | 4.36% |
| 2019 | 2,360 | 67,328 | 45,275 | 3.51% | 5.21% |
| 2021 | 1,879 | 61,412 | 40,365 | 3.06% | 4.66% |
On a per-plate-appearance basis, 2021 represented a nearly 13% drop-off in home run rate from ’19, though the per-batted-ball data only suggest a 10.5% decline. Both figures recovered after the sticky stuff enforcement went into effect, though, which does open the door for further research on the direct effects of the enforcement on the home run totals. It seems that, compared to 2019, a roughly-10% decrease in home runs on a per-batted-ball basis is a pretty fair estimation.
And just as I found in the piece I referenced earlier, almost all of the decrease in home run rate resulted in outs. On all fly balls in 2019, batters reached base roughly 30% of the time. In 2021, batters reached base on a fly ball about 27% of the time. A three-point difference might not seem like a lot, but almost 32,000 fly balls were hit this year; that’s the exchange of more than 900 hits for outs. Baseball’s league-wide batting average would jump back up pretty quickly if you reintroduced those hits.
Ultimately, a slight de-juicing of the baseball makes sense — I agree that there were just way too many home runs in 2019 — but doing so only further highlights the potential issues in baseball’s current offensive environment. In an era with more and increasingly precise shifts, better pitchers and pitches, and a still-pretty-juiced baseball, offense is going to remain concentrated in the long ball. But if there are fewer home runs, then the entire offensive output suffers, and that’s exactly what happened this season.
Devan Fink is a Contributor at FanGraphs. You can follow him on Twitter @DevanFink.
At what point does it become more valuable for a player (or a team) to try for line drives instead of home runs?
Is there an inherent value in zigging when everyone else zags?
If you’re a lefty with an average or better hit tool, plus speed, but zero power (ie. Ichiro with zero power), then work on hitting line drives to all fields. Dee Gordon-Strange did this for a while and had some offensive success, as did this year’s version of Nicky Lopez.
The irony there tho is that Ichiro actually was capable of displaying power during BP.
The lack of contact by hitters is mostly due to more pitch velocity and spin, and more breaking pitches. Considering the huge difference in value between homers and in the play line drive hits, I am not sure such a point exists (excluding players without power trying to hit homers) as every homer not hit needs to be replaced by a single and a double to match value.
you pretty much always try to hit line drives instead of 45 degree homeruns.