They Don’t Make Pitch Models Like They Used To
Before we get started, I need you to promise to hold on until the end here. I have buried the lede. The crux of this article is in the last two graphs, all the way at the bottom. I put them there on purpose because I want the data to tell you a story, so I need you to see this story through to the end. I think it’s worth it.
Last Tuesday, Ben Clemens wrote an article titled, “They Don’t Make Barrels Like They Used To.” Sadly, it was not a scathing takedown aimed at the shoddy craftsmanship of modern-day coopers. It documented the steady decrease in the value of barrels over the course of the Statcast era. In 2025, barrels were worth roughly 250 fewer points of wOBA than they were in 2015. That’s a staggering loss – the entire career wOBA of Pepe Frias up in smoke – and Ben broke down several culprits for the theft, along with one other factor: intention. “Tell hitters that barrels get them paid,” Ben wrote, “and they might start to change their behavior in a way that produces less valuable barrels, squared up to center field or in other ways that are easier to produce but less likely to land safely.” He attributed this to Goodhart’s Law: “When a measure becomes a target, it ceases to become a good measure.”
This law has a sports-specific corollary that you’re probably familiar with. I’ve previously referred to it as the Competitive Advantage Life Cycle in the context of catcher framing:
- Teams realize the immense value of a skill.
- An arms race ensues as they scramble to cultivate it.
- The skill becomes widespread across the league.
- Since the skill is more evenly distributed, it loses much of its value.
The second we gained the ability to calculate the value of catcher framing, everybody started working on it. The terrible framers either got better or got run out of the sport. Players who were excellent at framing but worse at other parts of the game suddenly found more playing time because their skills were appreciated. Lastly, as the average framing level rose, the rest of the league started catching up to the very best framers. This graph is three years old now, but it shows that convergence very clearly.

The terrible framers are gone, and the great framers don’t stand out as much as they used to. Everybody’s a bit closer to the new, tougher standard, so framing is more important than it’s ever been, but also less valuable. All this got me thinking about one of the oddest measurement tools we have these days: pitch modeling.
Like barrels (and hard-hit rate before them), the grades that pitch models hand out are reverse-engineered based on past results. The baseball savants at Baseball Savant ran their numbers and focused on a specific combination of launch angle and exit velocity that resulted in tons of damage. Likewise, smart people like Cameron Grove, Eno Sarris, Max Bay, Ethan Moore, and others charted the characteristics and results of every single pitch, then used that huge trove of data to estimate the value of any given pitch. Pitch models are much more complicated because they’re synthesizing a much larger set of variables, but they work very well. Stuff metrics do a better job of predicting a pitcher’s future success than ERA and even advanced ERA estimators like FIP and DRA. Those of us in the public sphere only started hearing about stuff models in 2021, with Driveline Baseball as an early proponent, but they’ve grown like wildfire. I can name five different public models off the top of my head. Every team in baseball has its own private model, and I wouldn’t be surprised to learn that some teams have several different models that do slightly different things.
This ubiquity brings us back to our friend Charles Goodhart. Several years into the pitch model revolution, pitchers are absolutely using this measure as a target. We hear them talking about it all the time, and they sound like nerds. Trying to improve your repertoire certainly isn’t a new phenomenon, but combined with instant feedback from Edgertronic cameras and portable Trackman units, pitch modeling offers a more direct path toward nastiness. It’s never been easier to add new pitches or to improve old ones, and pitch models often help guide that work. Other factors have pushed the game toward better stuff grades, too. Velocity is always climbing, and the pitch models love velocity. For years now, pitchers have been establishing the fastball less and throwing their best pitches more often, which often means their overall stuff numbers will grade out better simply because they’re not throwing their lower-rated pitches as often. Lastly, pitchers are going all out in shorter bursts, throwing harder and leveraging their best pitches sooner. It’s an all-out sprint toward pitches that are (and grade out as) nastier.
We have pitch modeling data going back to 2020. That’s four full seasons plus whatever the hell 2020 was. Is it enough time for Goodhart’s law to take effect? To check, I pulled the overall stuff grade for every pitcher with at least 400 pitches thrown in the past five years, using the two models that we have in house, PitchingBot and Stuff+. That’s a sample of 2,860 player-seasons. I performed two main checks, first looking at the distribution of stuff grades, and then checking how they lined up with actual pitching success.
We’ll start with the distribution. If we assume that some combination of Goodhart’s law and the Competitive Advantage Life Cycle is affecting pitch modeling, then we’d expect to see the distributions narrow over time, just as they did for pitch framing. Laggards would use the new tools to catch up to the pack. Players whose stuff didn’t measure up would lose playing time; think of all the handwringing about Ranger Suárez, who outpitches his stuff year in and year out, and it’s not hard to imagine a younger pitcher who does the same in the minors getting fewer chances to stick in the majors. And as the overall standard got higher, the middle of the pack would close some of the distance with the leaders. The result would be a tighter distribution around the middle. Because these grades are recalibrated every year, the average score would always stay the same, but we’d expect to see the standard deviation shrink. That’s our hypothesis, and the numbers bear it out.
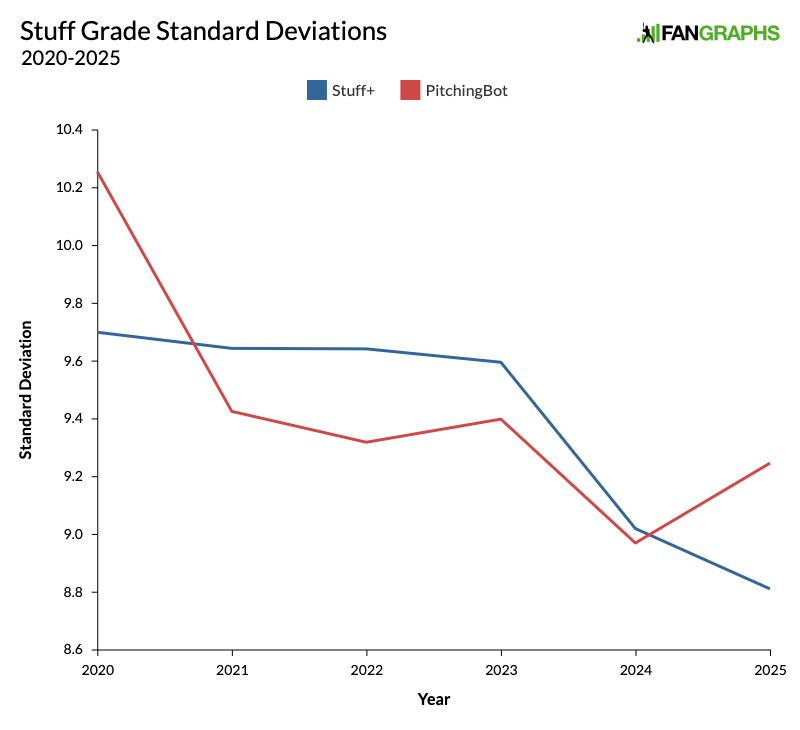
Even if you throw out the scrawny 2020 sample, the standard deviations of both Stuff+ and PitchingBot have clearly been trending downward over the past four years. From 2020 to 2023, the standard deviation of Stuff+ was nearly unchanged: 9.7 in 2020 and 9.6 in each season from 2021 to 2023. It started falling in 2024 and reached 8.8 in 2025. This is a small effect; we’re talking about fractions of a point. However, it might feel larger when you realize that it’s a decrease of nearly 9%.
That’s small enough that it’s tough to see the effects in a distribution plot. To help make that clear, I’ve split the distributions into two sets, 2021 to 2023 and then 2024 and 2025. Here’s Stuff+. I took every pitcher-season on our list, and split their overall Stuff+ grade into buckets of four points.
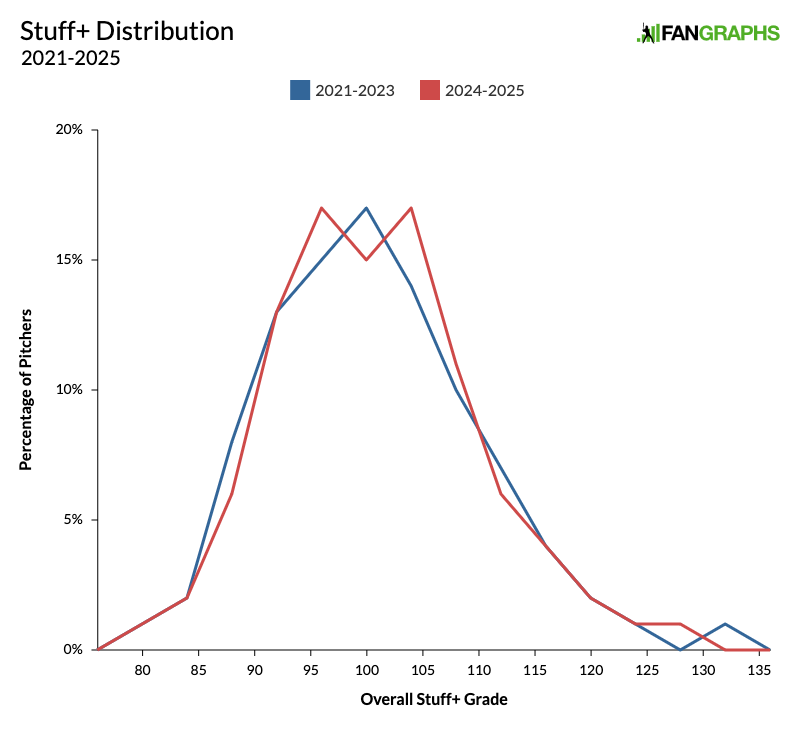
From 2021 to 2023, 46% of pitchers graded out between 94 and 106. In 2024 and 2025, that number increased to 49%. That provides the narrowness we expected, and you can see that it comes specifically from the back end of the distribution. From 2021 to 2023, 12% of pitchers featured stuff grades below 90. That fell to 9% in 2024 and 2025, and that decrease very much showed up in the PitchingBot distribution.
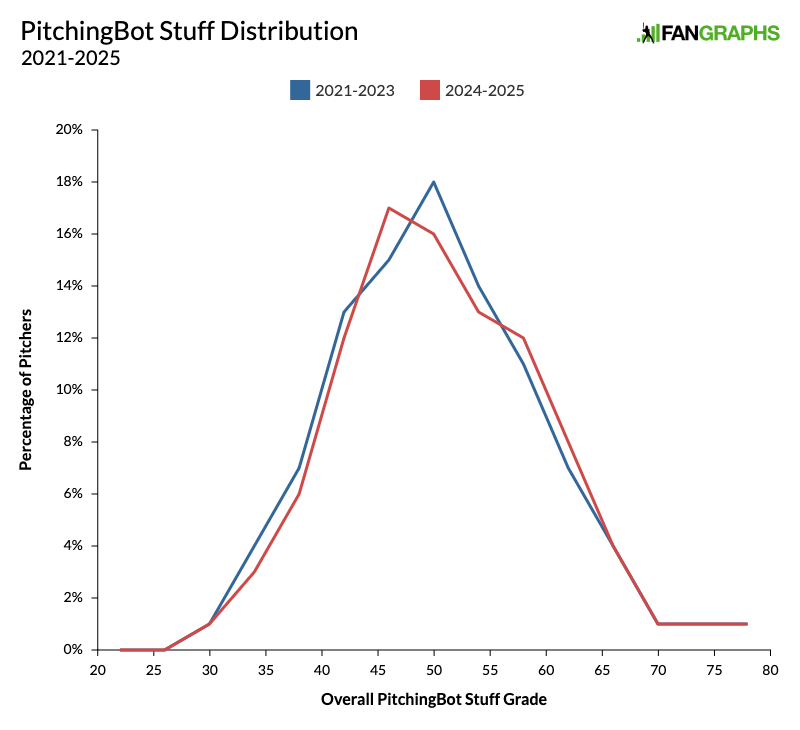
We’re talking about very small numbers here, but the changes are consistent between the two models. We see a small reduction in pitchers with below-average stuff according to the pitch models. In other words, the minimum stuff level is higher (even after you normalize stuff grades year-over-year). Moreover, I need you to keep in mind that we’re talking about just five years here. The timeline of the pitch framing graph at the top of the article was three times as long.
Now let’s get to actual performance. That’s the true test of Goodhart’s law. How good are the stuff metrics at identifying what they’re supposed to measure, pitches that lead to good outcomes? To check, I ran some simple correlation coefficients. I used the same group of pitcher-seasons and checked the correlation with both wOBA and xwOBA. (As a note, I reversed the numbers so that the graph would be more intuitive. A positive correlation coefficient, a higher spot on the graph, means a stronger connection between good stuff grades and actually pitching well.)
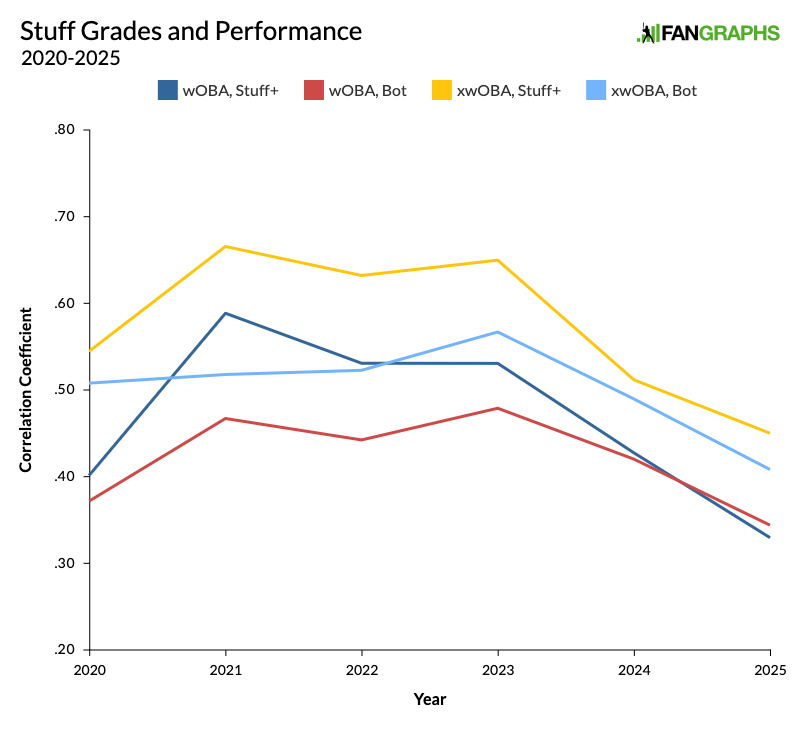
All four lines have decreased over the past two seasons. All of them. The two lines for wOBA, which shows actual production, have dropped the most. At the beginning of this graph, Stuff+ had a much stronger correlation to actual performance and expected performance, but now the two metrics are roughly even. Let me show you the starkest example of this change. The two scatter plots below show Stuff+ and wOBA in both 2021 and 2025.
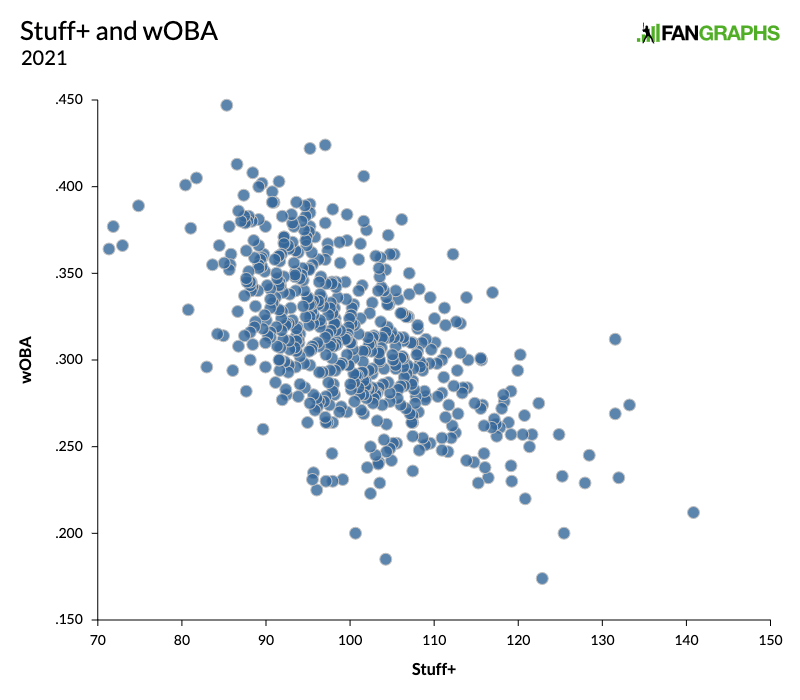
So that’s why they call it a scatter plot. In 2021, the trendline was unambiguous. Better stuff grades mean lower wOBA. In 2025, the dots scattered. The correlation was much weaker. This is the most extreme example, but it’s true of both our stuff metrics and both expected and actual wOBA. Goodhart really knew his stuff (plus). If you’re a pitcher with a Stuff+ grade of 110 in 2025, your stuff is almost certainly nastier than a pitcher who had a Stuff+ grade of 110 in 2020. However, the probability that your excellent stuff actually turns into excellent results is significantly lower.
Before I leave you, I need to remind you that nothing I’ve written here today means that stuff (or even stuff grades) matters less than it used to. If we separate stuff, the platonic ideal of pitches that are hard to hit, from stuff grades, which just show our best approximation of that ideal, the former is never, ever going to matter less. It is pitching. Pitchers are nastier than ever, and as the distribution graphs showed, the minimum acceptable stuff level has never been higher, even if you’re just comparing it to the league-average stuff level, which is rising because, again, pitchers are definitely nastier than ever. But all that parity – along with any other distortions that result from everybody chasing measurable stuff (at least to some extent) for stuff’s own sake – means that stuff grades have never been less predictive of actual, on-field results. We’re still very early in the lifetime of these metrics. They will surely improve in the coming years, and they’ll also have to change to keep up with whatever new trends emerge from the always-evolving cat-and-mouse game between pitchers and hitters. Whether their applicability to on-field performance ever goes back to its previous heights, however, is an open question.
Davy Andrews is a Brooklyn-based musician and a writer at FanGraphs. He can be found on Bluesky @davyandrewsdavy.bsky.social.
This is great (stuff)!!
Maybe I’m reading these two articles wrong, but I think this is two different effects.
The reason I think that is because it is difficult to hit the ball hard in the air and not get good results. Balls will still land on grass or over the fence. The parks aren’t getting bigger and defensive positioning/skill probably hasn’t improved enough to account for the difference that Ben Clemens found. But if everybody is throwing harder, nastier pitches then everybody is going to get better results because fewer balls will contact bats solidly.
But I am certainly open to other arguments.
Looking at the results of balls-in-play to the OF over the Statcast era convinced me that defensive positioning/skill may be the largest factor there.