
Using Pitch Speed to Tweak Hard-Hit Rate
On May 17, Chicago White Sox legend Yermín Mercedes hit the sixth home run of his stellar, albeit wilting, nevertheless unlikely, rookie campaign. A mammoth blast over the center field wall of Target Field, the home run sparked — in equal parts, seemingly — awe and controversy.
? THE YERMINATOR JUST HOMERED OFF OF LA TORTUGA! ? pic.twitter.com/pHacUxXtdF
— MLB (@MLB) May 18, 2021
The controversy? Mercedes teed off on a 3-0 count with one out to spare in a 15-4 blowout, off a beloved Position Player PitchingTM no less. He did so in the home park of a sputtering rival, one expected to compete for their division’s title but, at the time, had instead won half as many games (13) as it had lost (26). Naturally, a lengthy and unpleasant discourse about the game’s unwritten rules ensued. Retribution, however juvenile, was had.
At the time, the sheer amount of baggage on the home run did not register with me. My brain is so moldy and soggy that I reacted somewhat primitively. Good lord, Yermín Mercedes absolutely mashed possibly the slowest pitch I’ve ever seen.
Indeed, Mercedes’ home run is the hardest-hit batted ball (109.3 mph) against a pitch 60 mph or slower (47.1 mph) in the Statcast era. Only Christian Walker (seen here) and Ryan McMahon (seen here) come close, and their batted balls came against pitches thrown more than 53 mph. That’s, like, light speed in comparison.
The rarefied (if somewhat stupid) air Mercedes’ home run breathes suggests it might be exceptionally difficult to generate such a high exit velocity (EV) against such a slow pitch. It reminded me of some ingenious work done by Connor Kurcon (now of the Houston Astros’ R&D team) that centered on the idea of a dynamic hard-hit rate (DHH%). Inspired by a quintessential Joey Gallo pop-up — 107.2 mph off the bat at a steep 63 degrees — Kurcon asked a leading question: Would you consider this ball hit hard?
Given just the video, would you consider this ball hit hard? (poll below) pic.twitter.com/vXsuHI3fqP
— Connor Kurcon (@ckurcon) April 8, 2020
What Kurcon found — a finding that I would argue meshes well with our intuition about and understanding of the game of baseball — is that not all hard hits are created equal. Launch angle context is important, of course — optimal lanuch angles are necessary for hitters to be productive — but maybe just not in all the ways one might expect.
Gallo, specifically, was quite fortunate; a 63 degree pop-up is an automatic out the other 99 times out of 100, no matter how hard it’s hit. It is a decidedly abysmal launch angle. But it is exceedingly difficult to do what Gallo did, to generate such massive power at such a suboptimal angle. Few other human beings can do what he did, even if it was demonstrably bad! If we knew nothing else about Gallo, ignorant of his prospect pedigree and possibly unaware of how obscenely large he is, his pop-up would communicate a significant amount of information about his power, much more than the grotesqueness of the batted ball and its ensuing fielding misfortunes would let on.
Thus, Kurcon proposed a hard-hit rate that relies on an EV threshold that changes dynamically with launch angle. This runs contrary to Statcast’s hard-hit rate (HardHit%), which employs a static EV threshold of 95 mph. Kurcon found that this particular formulation of hard-hit rate, which he called Dynamic Hard-Hit Rate (DHH%), was both more predictive of hitter production (per weighted on-base average on contact, or wOBAcon) and stickier year-to-year than HardHit%.
This premise, of a dynamic threshold to define hard hits, is relevant to contexts beyond launch angle like, say, pitch speed! A pitcher’s influence on EV is relatively small; pitch speed plays a small role, but most of the influence on EV lies in the hands of the hitter. Still, it stands to reason it takes a tremendous amount of strength to hit a little league pitch nearly 430 feet.
Statcast data can help validate or invalidate that hunch. The figure below shows 75th-percentile EV at most pitch speeds (rounded to the nearest tenth of a mph). Note how EV decays as pitch speed declines:
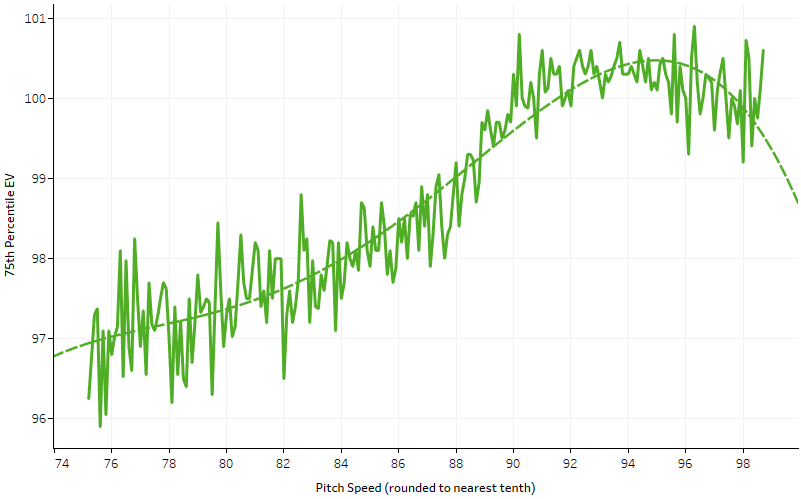
(My choice of 75th percentile is somewhat arbitrary, frankly. The shape of this curve looks nearly identical at, say, 90th-percentile EV as well.)
The line of best fit (r² = 0.89) tails off ominously on pitch speeds lower than roughly 75 mph in such a way that it may not be a particularly helpful benchmark for extremely slow pitches, like the Willians Astudillo eephus that Mercedes slugged. Ultimately, we don’t have enough data to reach sound conclusions for ultra-slow pitches. Maybe at a certain, uh, slowness, the line curves back up and it becomes easier to generate additional exit velocity. It’s just unclear to me where that inflection point might be. I think this leaves our original question unanswered, although I am biased and would argue that, yes, what Mercedes accomplished is actually very interesting to mushy-brained people like me.
Despite these unknowns, we can at least use the line of best fit drawn above as the basis for a DHH% based on pitch speed (“Pitch DHH%”) for pitches with normal velocities. Like Kurcon’s original version based on launch angle, Pitch DHH% is slightly more descriptive (same-year) and predictive (next-year) of wOBAcon than HardHit% — I think a pessimist could argue it is negligibly superior. But, as a measure of skill, it is significantly stickier year to year.
| Metric | wOBAcon (y0) | wOBAcon (y1) | Itself (y1) |
|---|---|---|---|
| DHH%: Pitch Speed | 0.473 | 0.344 | 0.754 |
| HardHit% | 0.457 | 0.328 | 0.674 |
| wOBAcon | 1.000 | 0.387 | 0.387 |
y0 = current year; y1 = next year
Min. 250 batted ball events (BBE) in y0 and y1
You’ll notice that, for predicting wOBAcon, Pitch DHH% is less powerful than wOBAcon itself, which might make you wonder why we would rely on anything else in the first place. In fairness, wOBAcon reflects outcomes determined by countless inputs that affect every batted ball event. HardHit% and (Pitch) DHH%, on the other hand, rely only on a couple of contact quality inputs. That we can explain so much with so little should maybe be considered a feat in and of itself.
So how does the original DHH% better predict wOBAcon than wOBAcon itself, whereas Pitch DHH% doesn’t? It ignores all hard hits shallower than zero degrees (i.e., all groundballs). Without this threshold, the original DHH% resembles Pitch DHH%, somewhere above HardHit% but below wOBAcon for predictive purposes.
| Metric | wOBAcon (y0) | wOBAcon (y1) | Itself (y1) |
|---|---|---|---|
| DHH%: Pitch Speed | 0.473 | 0.344 | 0.754 |
| HardHit% | 0.457 | 0.328 | 0.674 |
| wOBAcon | 1.000 | 0.387 | 0.387 |
| DHH%: Original | 0.554 | 0.416 | 0.788 |
| DHH%: Original (No 0°) | 0.436 | 0.355 | 0.821 |
y0 = current year; y1 = next year
Min. 250 batted ball events in y0 and y1
This is by no means an indictment of DHH%; if anything, it’s a testament to Kurcon’s ingenuity to elevate a metric from interesting to indispensible. Unfortunately, there is no such threshold I can think to implement for pitch speed that might yield a similar predictive edge. We know groundballs are predominantly outs and singles — maybe one in 40 go for extra bases. Any hitter can do any amount of damage on any pitch speed, though — Mercedes proved as much! — which makes the idea of enforcing a velocity-based cutoff dubious.
Still, that does not make this version of DHH% useless. We can leverage it to identify hitters that HardHit% over- and under-rates. Take, for example, Max Muncy, about whom much ink has been spilled on these digital pages. Among 170 hitters with at least 120 batted ball events (BBE) through June 13, Muncy’s hard-hit rate improves from the 52nd percentile of HardHit% to the 82nd percentile of Pitch DHH%.
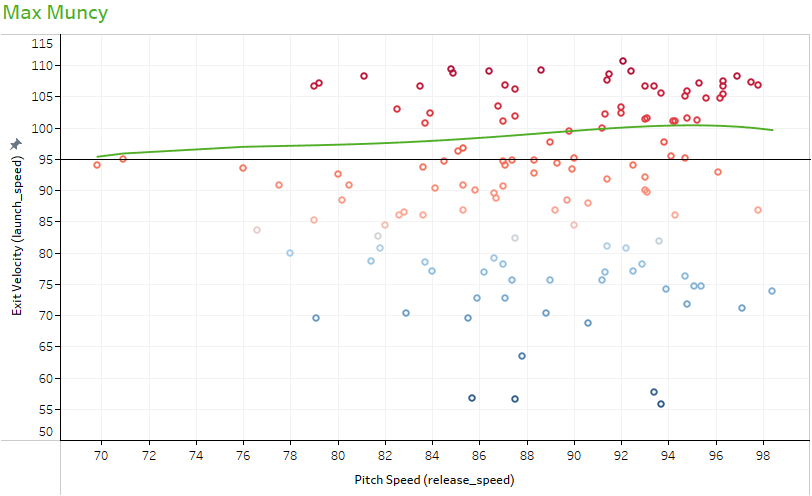
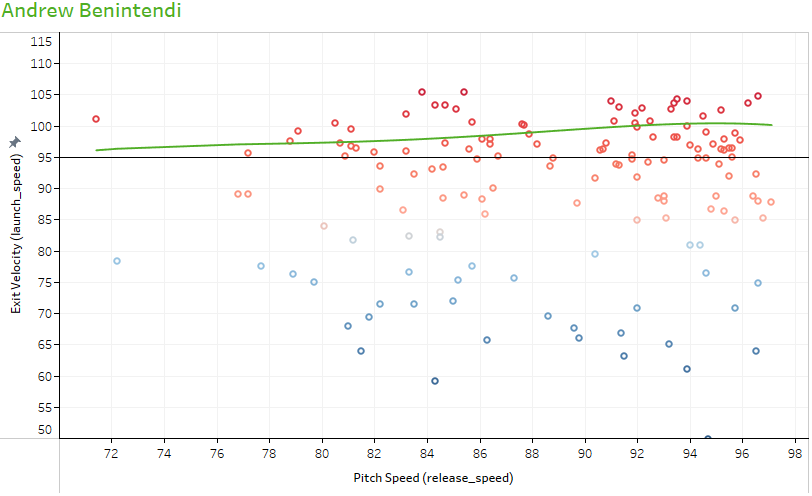
The green line depicts our new dynamic threshold, while the black line depicts the classic fixed threshold of 95 mph. Muncy boasts very few batted balls between the two thresholds; as such, Pitch DHH% gives him more credit for generating higher EVs on faster pitches, which hitters should generally be expected to do. Conversely, Pitch DHH% punishes Andrew Benintendi third-most of any hitter, with his hard-hit rate declining from the 56th percentile (HardHit%) to the 18th (Pitch DHH%) after accounting for pitch speed. Benintendi lives between the thresholds, with many of his BBE exceeding the 95 mph threshold but relatively few exceeding our new dynamic threshold.
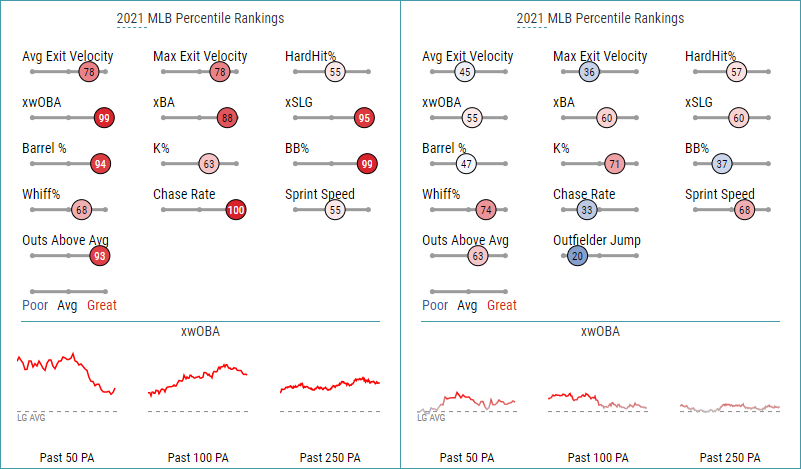
It comes as no surprise to me, then, that Muncy’s Statcast profile (below left) bleeds red like his Pitch DHH% (and unlike his HardHit%), while Benintendi’s HardHit% seems to overstate his quality of contact in a way that Pitch DHH% keeps firmly in check.
(Topically, our little king Mercedes ranks 21st of 170 in hard-hit rate improvement! Unfortunately, going from the eight-percentile HardHit% to the 23rd-percentile Pitch DHH% seems hardly like cause for celebration.)
Of course, some hitters aren’t so nuanced. There’s something oddly comforting about Pitch DHH% declining to make wholesale changes to Giancarlo Stanton (100th percentile before and after) or Aaron Judge (99th percentile) or even David Fletcher (0th percentile). Certain types of hitters — the Vladimir Guerrero Jrs., but also the Nicky Lopezes; the Ronald Acuña Jrs., but also the Myles Straws — will not see their needles move much or at all when transitioning from a fixed threshold to a dynamic one.
But for everyone else, Pitch DHH% might have more insight to offer — like, for example, by further validating Anthony Rendon‘s poor performance (18th-percentile Pitch DHH%, down from 52nd-percentile HardHit%). Or “predicting” Jonathan Schoop’s recent heater (57th percentile, up from 43rd). Or possibly serving as a leading indicator to an eventual cool-down from Buster Posey (36th percentile, down from 78th), whose outstanding outcomes seem to defy many of the peripherals that underpin them.
The table below provides side-by-side comparisons of HardHit% and Pitch DHH% for all 282 hitters with at least 75 BBE through June 14 (the table is sortable). Maybe Pitch DHH% better explains your favorite player’s production (or lack thereof) to date. Who can say? Not me. But I do suspect, with mathematical validation and the humility of knowing this suspicion is far from revelatory, that approaching hard-hit rates with additional context and nuance improves our ability to describe and diagnose (and, ideally, better appreciate) hitter performance.
| Rank | Hitter Name | BBE | HardHit% | DHH%: Pitch Speed | ∆ Percentile |
|---|---|---|---|---|---|
| 1 | Aaron Judge | 156 | 0.99 | 1.00 | 0.00 |
| 2 | Giancarlo Stanton | 116 | 1.00 | 1.00 | 0.00 |
| 3 | Franmil Reyes | 97 | 0.94 | 0.99 | +0.05 |
| 4 | Vladimir Guerrero Jr. | 184 | 0.98 | 0.99 | +0.01 |
| 5 | Evan Longoria | 119 | 1.00 | 0.99 | -0.01 |
| 6 | Tyler O’Neill | 103 | 0.93 | 0.98 | +0.05 |
| 7 | Fernando Tatis Jr. | 125 | 0.95 | 0.98 | +0.03 |
| 8 | Ronald Acuña Jr. | 162 | 0.99 | 0.98 | -0.01 |
| 9 | Nelson Cruz | 152 | 0.96 | 0.97 | +0.01 |
| 10 | Shohei Ohtani | 143 | 0.98 | 0.97 | -0.01 |
| 11 | Mike Trout | 76 | 0.93 | 0.96 | +0.03 |
| 12 | Manny Machado | 174 | 0.96 | 0.96 | 0.00 |
| 13 | Salvador Perez | 185 | 0.97 | 0.96 | -0.01 |
| 14 | Rafael Devers | 170 | 0.97 | 0.95 | -0.01 |
| 15 | Juan Soto | 144 | 0.98 | 0.95 | -0.03 |
| 16 | Yasmani Grandal | 81 | 0.99 | 0.95 | -0.04 |
| 17 | Teoscar Hernández | 133 | 0.91 | 0.94 | +0.03 |
| 18 | Harold Ramirez | 100 | 0.94 | 0.94 | 0.00 |
| 19 | Joc Pederson | 127 | 0.95 | 0.94 | -0.01 |
| 20 | Brad Miller | 77 | 0.82 | 0.93 | +0.11 |
| 21 | Andrew Vaughn | 117 | 0.94 | 0.93 | 0.00 |
| 22 | Josh Bell | 124 | 0.95 | 0.93 | -0.03 |
| 23 | José Ramírez | 192 | 0.88 | 0.92 | +0.05 |
| 24 | Rowdy Tellez | 101 | 0.89 | 0.92 | +0.03 |
| 25 | José Abreu | 165 | 0.92 | 0.92 | 0.00 |
| 26 | Bo Bichette | 193 | 0.92 | 0.91 | -0.01 |
| 27 | Jesse Winker | 178 | 0.96 | 0.91 | -0.05 |
| 28 | Justin Upton | 131 | 0.83 | 0.90 | +0.07 |
| 29 | Avisaíl García | 147 | 0.85 | 0.90 | +0.06 |
| 30 | Jorge Soler | 133 | 0.90 | 0.90 | 0.00 |
| 31 | Ryan Zimmerman | 81 | 0.74 | 0.89 | +0.16 |
| 32 | Josh Donaldson | 148 | 0.88 | 0.89 | +0.01 |
| 33 | Freddie Freeman | 184 | 0.91 | 0.89 | -0.02 |
| 34 | Trent Grisham | 98 | 0.71 | 0.88 | +0.16 |
| 35 | Phillip Evans | 98 | 0.88 | 0.88 | +0.01 |
| 36 | Matt Olson | 179 | 0.89 | 0.88 | -0.01 |
| 37 | Max Kepler | 106 | 0.80 | 0.87 | +0.07 |
| 38 | Pete Alonso | 129 | 0.83 | 0.87 | +0.04 |
| 39 | Alex Kirilloff | 88 | 0.88 | 0.86 | -0.01 |
| 40 | Garrett Cooper | 113 | 0.88 | 0.86 | -0.02 |
| 41 | Paul Goldschmidt | 182 | 0.93 | 0.86 | -0.07 |
| 42 | Miguel Cabrera | 129 | 0.77 | 0.85 | +0.09 |
| 43 | J.D. Martinez | 176 | 0.76 | 0.85 | +0.09 |
| 44 | Adam Duvall | 134 | 0.83 | 0.85 | +0.02 |
| 45 | Trey Mancini | 178 | 0.68 | 0.84 | +0.16 |
| 46 | Victor Caratini | 93 | 0.71 | 0.84 | +0.13 |
| 47 | Nick Castellanos | 183 | 0.90 | 0.84 | -0.06 |
| 48 | Max Muncy | 143 | 0.55 | 0.83 | +0.27 |
| 49 | Hunter Dozier | 113 | 0.75 | 0.83 | +0.08 |
| 50 | Yordan Alvarez | 146 | 0.78 | 0.83 | +0.05 |
| 51 | Clint Frazier | 106 | 0.40 | 0.82 | +0.42 |
| 52 | Adolis García | 152 | 0.85 | 0.82 | -0.03 |
| 53 | Yoán Moncada | 145 | 0.70 | 0.81 | +0.11 |
| 54 | Daniel Vogelbach | 104 | 0.80 | 0.81 | +0.01 |
| 55 | Ketel Marte | 87 | 0.86 | 0.81 | -0.05 |
| 56 | Randy Arozarena | 166 | 0.72 | 0.80 | +0.08 |
| 57 | Aledmys Díaz | 96 | 0.81 | 0.80 | -0.01 |
| 58 | Ryan McMahon | 176 | 0.84 | 0.80 | -0.04 |
| 59 | Rougned Odor | 91 | 0.56 | 0.79 | +0.23 |
| 60 | J.T. Realmuto | 111 | 0.75 | 0.79 | +0.04 |
| 61 | Kelvin Gutierrez | 77 | 0.76 | 0.79 | +0.03 |
| 62 | Wilson Ramos | 91 | 0.70 | 0.78 | +0.09 |
| 63 | Gary Sánchez | 103 | 0.73 | 0.78 | +0.04 |
| 64 | Randal Grichuk | 188 | 0.79 | 0.78 | -0.01 |
| 65 | Jared Walsh | 158 | 0.56 | 0.77 | +0.21 |
| 66 | Tyler Naquin | 133 | 0.78 | 0.77 | -0.01 |
| 67 | Brandon Belt | 82 | 0.77 | 0.77 | -0.01 |
| 68 | Tom Murphy | 75 | 0.52 | 0.76 | +0.24 |
| 69 | Joey Gallo | 124 | 0.54 | 0.76 | +0.21 |
| 70 | Bobby Dalbec | 107 | 0.63 | 0.76 | +0.13 |
| 71 | Ramón Laureano | 129 | 0.74 | 0.76 | +0.02 |
| 72 | James McCann | 111 | 0.84 | 0.76 | -0.08 |
| 73 | Alec Bohm | 163 | 0.85 | 0.76 | -0.10 |
| 74 | Kyle Tucker | 199 | 0.88 | 0.76 | -0.12 |
| 75 | Ian Happ | 114 | 0.91 | 0.76 | -0.16 |
| 76 | Hunter Renfroe | 146 | 0.56 | 0.73 | +0.17 |
| 77 | Miguel Sanó | 99 | 0.79 | 0.73 | -0.06 |
| 78 | Eric Hosmer | 182 | 0.86 | 0.73 | -0.13 |
| 79 | Manuel Margot | 177 | 0.59 | 0.72 | +0.12 |
| 80 | Trea Turner | 198 | 0.66 | 0.72 | +0.06 |
| 81 | Kyle Schwarber | 133 | 0.89 | 0.72 | -0.18 |
| 82 | Willie Calhoun | 149 | 0.67 | 0.71 | +0.04 |
| 83 | Joey Votto | 96 | 0.84 | 0.71 | -0.13 |
| 84 | Juan Lagares | 81 | 0.43 | 0.70 | +0.26 |
| 85 | Mitch Haniger | 190 | 0.67 | 0.70 | +0.04 |
| 86 | Jed Lowrie | 168 | 0.79 | 0.70 | -0.09 |
| 87 | Bryce Harper | 110 | 0.50 | 0.69 | +0.19 |
| 88 | Charlie Blackmon | 170 | 0.61 | 0.69 | +0.08 |
| 89 | Taylor Ward | 80 | 0.60 | 0.69 | +0.08 |
| 90 | Tim Anderson | 159 | 0.60 | 0.68 | +0.08 |
| 91 | Odúbel Herrera | 122 | 0.65 | 0.68 | +0.03 |
| 92 | Corey Seager | 118 | 0.90 | 0.68 | -0.22 |
| 93 | Willson Contreras | 132 | 0.58 | 0.67 | +0.09 |
| 94 | David Bote | 110 | 0.74 | 0.67 | -0.07 |
| 95 | A.J. Pollock | 93 | 0.80 | 0.67 | -0.14 |
| 96 | Gregory Polanco | 120 | 0.72 | 0.66 | -0.06 |
| 97 | Tommy Pham | 138 | 0.81 | 0.66 | -0.15 |
| 98 | Chris Taylor | 142 | 0.53 | 0.65 | +0.12 |
| 99 | Carlos Correa | 193 | 0.70 | 0.65 | -0.05 |
| 100 | Nathaniel Lowe | 165 | 0.69 | 0.65 | -0.05 |
| 101 | Michael Brantley | 166 | 0.77 | 0.65 | -0.12 |
| 102 | Anthony Rizzo | 179 | 0.57 | 0.64 | +0.07 |
| 103 | Miguel Andujar | 81 | 0.59 | 0.64 | +0.05 |
| 104 | Austin Riley | 144 | 0.57 | 0.63 | +0.06 |
| 105 | Francisco Lindor | 173 | 0.68 | 0.63 | -0.05 |
| 106 | Gio Urshela | 159 | 0.69 | 0.63 | -0.06 |
| 107 | Travis Shaw | 129 | 0.42 | 0.62 | +0.20 |
| 108 | Starling Marte | 86 | 0.46 | 0.62 | +0.16 |
| 109 | Rhys Hoskins | 168 | 0.69 | 0.62 | -0.07 |
| 110 | Jason Heyward | 107 | 0.60 | 0.61 | +0.01 |
| 111 | Anthony Santander | 107 | 0.72 | 0.61 | -0.10 |
| 112 | Carlos Santana | 185 | 0.64 | 0.60 | -0.04 |
| 113 | Javier Báez | 129 | 0.65 | 0.60 | -0.05 |
| 114 | Justin Turner | 177 | 0.82 | 0.60 | -0.21 |
| 115 | Elias Díaz | 78 | 0.19 | 0.59 | +0.40 |
| 116 | Yandy Díaz | 169 | 0.38 | 0.59 | +0.21 |
| 117 | Brandon Crawford | 134 | 0.73 | 0.59 | -0.14 |
| 118 | C.J. Cron | 109 | 0.25 | 0.58 | +0.33 |
| 119 | Michael A. Taylor | 118 | 0.44 | 0.58 | +0.14 |
| 120 | Paul DeJong | 98 | 0.34 | 0.57 | +0.23 |
| 121 | Jonathan Schoop | 176 | 0.43 | 0.57 | +0.14 |
| 122 | Jean Segura | 153 | 0.48 | 0.57 | +0.09 |
| 123 | Austin Slater | 86 | 0.54 | 0.57 | +0.02 |
| 124 | Jazz Chisholm Jr. | 102 | 0.42 | 0.56 | +0.13 |
| 125 | Sean Murphy | 124 | 0.63 | 0.56 | -0.07 |
| 126 | Jorge Polanco | 180 | 0.45 | 0.55 | +0.10 |
| 127 | Nomar Mazara | 81 | 0.68 | 0.55 | -0.13 |
| 128 | David Peralta | 177 | 0.38 | 0.54 | +0.16 |
| 129 | Marcell Ozuna | 142 | 0.51 | 0.54 | +0.04 |
| 130 | Yuli Gurriel | 202 | 0.65 | 0.54 | -0.11 |
| 131 | Pedro Severino | 110 | 0.13 | 0.53 | +0.41 |
| 132 | Michael Conforto | 86 | 0.20 | 0.53 | +0.33 |
| 133 | Kyle Lewis | 93 | 0.33 | 0.53 | +0.20 |
| 134 | Lorenzo Cain | 79 | 0.47 | 0.52 | +0.05 |
| 135 | Xander Bogaerts | 183 | 0.55 | 0.52 | -0.03 |
| 136 | DJ LeMahieu | 201 | 0.67 | 0.52 | -0.15 |
| 137 | Bryan Reynolds | 165 | 0.37 | 0.51 | +0.14 |
| 138 | Stephen Piscotty | 95 | 0.49 | 0.51 | +0.01 |
| 139 | Pavin Smith | 191 | 0.81 | 0.51 | -0.30 |
| 140 | Mitch Moreland | 99 | 0.61 | 0.50 | -0.11 |
| 141 | Jackie Bradley Jr. | 126 | 0.64 | 0.50 | -0.14 |
| 142 | Jonathan Villar | 113 | 0.17 | 0.49 | +0.32 |
| 143 | Adam Eaton | 124 | 0.46 | 0.49 | +0.04 |
| 144 | Jesús Aguilar | 185 | 0.54 | 0.49 | -0.05 |
| 145 | Mark Canha | 175 | 0.51 | 0.48 | -0.03 |
| 146 | Jose Altuve | 190 | 0.62 | 0.48 | -0.14 |
| 147 | Marcus Semien | 190 | 0.63 | 0.48 | -0.15 |
| 148 | Ty France | 165 | 0.27 | 0.47 | +0.20 |
| 149 | Will Smith | 135 | 0.62 | 0.47 | -0.15 |
| 150 | Willy Adames | 135 | 0.75 | 0.47 | -0.27 |
| 151 | Erik González | 156 | 0.11 | 0.46 | +0.35 |
| 152 | Christian Arroyo | 80 | 0.13 | 0.46 | +0.33 |
| 153 | Yadier Molina | 128 | 0.32 | 0.46 | +0.14 |
| 154 | Mike Brosseau | 78 | 0.23 | 0.45 | +0.21 |
| 155 | Nick Solak | 173 | 0.39 | 0.45 | +0.06 |
| 156 | Jeimer Candelario | 155 | 0.43 | 0.45 | +0.02 |
| 157 | Marwin Gonzalez | 129 | 0.41 | 0.44 | +0.02 |
| 158 | Josh Naylor | 156 | 0.47 | 0.44 | -0.02 |
| 159 | Jake Bauers | 85 | 0.64 | 0.44 | -0.21 |
| 160 | Brandon Lowe | 141 | 0.29 | 0.43 | +0.14 |
| 161 | Ryan Mountcastle | 149 | 0.49 | 0.43 | -0.06 |
| 162 | Seth Brown | 96 | 0.23 | 0.42 | +0.20 |
| 163 | Austin Hays | 102 | 0.30 | 0.42 | +0.12 |
| 164 | Starlin Castro | 182 | 0.32 | 0.42 | +0.09 |
| 165 | Dylan Moore | 83 | 0.14 | 0.41 | +0.28 |
| 166 | Luis Urías | 134 | 0.49 | 0.41 | -0.09 |
| 167 | Dansby Swanson | 166 | 0.62 | 0.41 | -0.21 |
| 168 | Guillermo Heredia | 75 | 0.26 | 0.40 | +0.14 |
| 169 | Colin Moran | 88 | 0.28 | 0.40 | +0.11 |
| 170 | Kolten Wong | 135 | 0.31 | 0.40 | +0.09 |
| 171 | Aaron Hicks | 80 | 0.40 | 0.39 | -0.01 |
| 172 | Cesar Hernandez | 182 | 0.41 | 0.39 | -0.02 |
| 173 | Josh Rojas | 144 | 0.47 | 0.39 | -0.08 |
| 174 | Jose Rojas | 86 | 0.58 | 0.39 | -0.20 |
| 175 | Alex Verdugo | 197 | 0.48 | 0.38 | -0.10 |
| 176 | Gavin Lux | 145 | 0.31 | 0.37 | +0.07 |
| 177 | Christian Walker | 89 | 0.36 | 0.37 | +0.01 |
| 178 | Mike Yastrzemski | 120 | 0.58 | 0.37 | -0.21 |
| 179 | Lourdes Gurriel Jr. | 169 | 0.37 | 0.36 | -0.02 |
| 180 | Alex Dickerson | 102 | 0.46 | 0.36 | -0.10 |
| 181 | Buster Posey | 130 | 0.78 | 0.36 | -0.42 |
| 182 | Corey Dickerson | 160 | 0.11 | 0.35 | +0.24 |
| 183 | Eugenio Suárez | 160 | 0.15 | 0.35 | +0.20 |
| 184 | Austin Meadows | 161 | 0.51 | 0.35 | -0.16 |
| 185 | Cavan Biggio | 94 | 0.21 | 0.34 | +0.12 |
| 186 | Cedric Mullins | 194 | 0.48 | 0.34 | -0.14 |
| 187 | Jacob Stallings | 125 | 0.18 | 0.33 | +0.15 |
| 188 | Trevor Story | 147 | 0.25 | 0.33 | +0.09 |
| 189 | Nick Senzel | 96 | 0.44 | 0.33 | -0.11 |
| 190 | Jeff McNeil | 90 | 0.32 | 0.32 | 0.00 |
| 191 | Miguel Rojas | 143 | 0.34 | 0.32 | -0.02 |
| 192 | Kyle Seager | 185 | 0.73 | 0.32 | -0.41 |
| 193 | Tyler Stephenson | 102 | 0.27 | 0.31 | +0.04 |
| 194 | Kris Bryant | 166 | 0.44 | 0.31 | -0.14 |
| 195 | Albert Pujols | 123 | 0.52 | 0.31 | -0.21 |
| 196 | Ozzie Albies | 193 | 0.27 | 0.30 | +0.02 |
| 197 | Wil Myers | 126 | 0.35 | 0.30 | -0.05 |
| 198 | Andrew McCutchen | 150 | 0.36 | 0.30 | -0.06 |
| 199 | Asdrúbal Cabrera | 100 | 0.18 | 0.29 | +0.11 |
| 200 | Carson Kelly | 104 | 0.29 | 0.29 | 0.00 |
| 201 | Willi Castro | 133 | 0.06 | 0.28 | +0.22 |
| 202 | Jonathan India | 126 | 0.22 | 0.28 | +0.07 |
| 203 | Brett Gardner | 104 | 0.25 | 0.28 | +0.03 |
| 204 | Billy McKinney | 101 | 0.53 | 0.28 | -0.26 |
| 205 | Nolan Arenado | 213 | 0.35 | 0.27 | -0.08 |
| 206 | Mookie Betts | 179 | 0.42 | 0.27 | -0.15 |
| 207 | Enrique Hernández | 146 | 0.30 | 0.26 | -0.04 |
| 208 | Jon Berti | 113 | 0.50 | 0.26 | -0.23 |
| 209 | Amed Rosario | 154 | 0.53 | 0.26 | -0.27 |
| 210 | Yermín Mercedes | 174 | 0.09 | 0.25 | +0.17 |
| 211 | Brian Anderson | 88 | 0.39 | 0.25 | -0.15 |
| 212 | Niko Goodrum | 106 | 0.57 | 0.25 | -0.32 |
| 213 | Willians Astudillo | 108 | 0.12 | 0.24 | +0.11 |
| 214 | Dominic Smith | 139 | 0.26 | 0.24 | -0.02 |
| 215 | Akil Baddoo | 77 | 0.19 | 0.23 | +0.04 |
| 216 | Matt Beaty | 80 | 0.21 | 0.23 | +0.02 |
| 217 | Matt Chapman | 146 | 0.30 | 0.23 | -0.07 |
| 218 | Mauricio Dubón | 103 | 0.16 | 0.22 | +0.06 |
| 219 | Alex Bregman | 185 | 0.32 | 0.22 | -0.10 |
| 220 | Jose Trevino | 111 | 0.38 | 0.22 | -0.16 |
| 221 | Maikel Franco | 197 | 0.07 | 0.21 | +0.14 |
| 222 | Ha-Seong Kim 김하성 김하성 | 111 | 0.15 | 0.21 | +0.06 |
| 223 | Eduardo Escobar | 194 | 0.22 | 0.21 | -0.01 |
| 224 | DJ Stewart | 98 | 0.10 | 0.20 | +0.10 |
| 225 | Gleyber Torres | 166 | 0.19 | 0.20 | +0.01 |
| 226 | Raimel Tapia | 206 | 0.22 | 0.20 | -0.03 |
| 227 | Tommy Edman | 240 | 0.35 | 0.19 | -0.16 |
| 228 | Kevin Kiermaier | 90 | 0.45 | 0.19 | -0.26 |
| 229 | Andrew Benintendi | 176 | 0.59 | 0.19 | -0.40 |
| 230 | Isiah Kiner-Falefa | 221 | 0.10 | 0.18 | +0.08 |
| 231 | Victor Robles | 108 | 0.16 | 0.18 | +0.02 |
| 232 | David Dahl | 106 | 0.36 | 0.18 | -0.18 |
| 233 | Anthony Rendon | 140 | 0.52 | 0.18 | -0.34 |
| 234 | Dylan Carlson | 167 | 0.24 | 0.17 | -0.07 |
| 235 | Freddy Galvis | 159 | 0.12 | 0.16 | +0.04 |
| 236 | Yan Gomes | 118 | 0.20 | 0.16 | -0.04 |
| 237 | Francisco Mejía | 88 | 0.33 | 0.16 | -0.18 |
| 238 | Josh Fuentes | 144 | 0.07 | 0.15 | +0.08 |
| 239 | Joey Wendle | 150 | 0.17 | 0.15 | -0.02 |
| 240 | Christian Vázquez | 157 | 0.28 | 0.15 | -0.14 |
| 241 | José Iglesias | 162 | 0.08 | 0.14 | +0.06 |
| 242 | Elvis Andrus | 171 | 0.26 | 0.14 | -0.12 |
| 243 | Danny Jansen | 78 | 0.40 | 0.14 | -0.25 |
| 244 | Omar Narváez | 113 | 0.08 | 0.13 | +0.05 |
| 245 | Eddie Rosario | 183 | 0.21 | 0.13 | -0.08 |
| 246 | Charlie Culberson | 95 | 0.06 | 0.12 | +0.05 |
| 247 | Jake Cronenworth | 211 | 0.11 | 0.12 | +0.01 |
| 248 | Garrett Hampson | 158 | 0.16 | 0.12 | -0.04 |
| 249 | Robbie Grossman | 167 | 0.28 | 0.12 | -0.16 |
| 250 | Donovan Solano | 95 | 0.12 | 0.11 | -0.01 |
| 251 | J.P. Crawford | 187 | 0.16 | 0.11 | -0.05 |
| 252 | Kurt Suzuki | 77 | 0.03 | 0.10 | +0.07 |
| 253 | Leury García | 132 | 0.14 | 0.10 | -0.04 |
| 254 | Kyle Farmer | 138 | 0.15 | 0.10 | -0.05 |
| 255 | Wilmer Flores | 122 | 0.10 | 0.09 | 0.00 |
| 256 | Josh Harrison | 156 | 0.17 | 0.09 | -0.08 |
| 257 | Mike Tauchman | 92 | 0.24 | 0.09 | -0.15 |
| 258 | Jurickson Profar | 154 | 0.07 | 0.08 | 0.00 |
| 259 | Harold Castro | 88 | 0.66 | 0.08 | -0.58 |
| 260 | Didi Gregorius | 95 | 0.04 | 0.07 | +0.04 |
| 261 | Nick Ahmed | 132 | 0.06 | 0.07 | +0.01 |
| 262 | Kevin Pillar | 90 | 0.41 | 0.07 | -0.35 |
| 263 | Kevin Newman | 197 | 0.01 | 0.06 | +0.05 |
| 264 | Hanser Alberto | 93 | 0.02 | 0.06 | +0.04 |
| 265 | Luis Arraez | 125 | 0.37 | 0.06 | -0.31 |
| 266 | Joe Panik | 84 | 0.04 | 0.05 | +0.01 |
| 267 | Martín Maldonado | 106 | 0.09 | 0.05 | -0.04 |
| 268 | Ehire Adrianza | 79 | 0.23 | 0.05 | -0.19 |
| 269 | Jose Peraza | 78 | 0.05 | 0.04 | 0.00 |
| 270 | Andrelton Simmons | 136 | 0.05 | 0.04 | -0.01 |
| 271 | Whit Merrifield | 222 | 0.09 | 0.04 | -0.06 |
| 272 | Adam Frazier | 224 | 0.05 | 0.03 | -0.02 |
| 273 | Tucker Barnhart | 102 | 0.21 | 0.03 | -0.18 |
| 274 | Nick Madrigal | 184 | 0.02 | 0.02 | 0.00 |
| 275 | Yonathan Daza | 128 | 0.03 | 0.02 | -0.01 |
| 276 | Nicky Lopez | 140 | 0.04 | 0.02 | -0.02 |
| 277 | Tim Locastro | 80 | 0.00 | 0.01 | +0.01 |
| 278 | Eric Sogard | 100 | 0.01 | 0.01 | 0.00 |
| 279 | Myles Straw | 165 | 0.02 | 0.01 | -0.01 |
| 280 | David Fletcher | 215 | 0.00 | 0.00 | 0.00 |
| 281 | Tony Kemp | 92 | 0.01 | 0.00 | -0.01 |
(Note that Muncy’s and Benintendi’s percentiles appear different in the table because the minimum threshold was lowered from 120 BBE to 75 BBE.)
Whoa.