Few things tickle my fancy like a baseball player up to no good. Blue Jays reliever Brendon Little presently holds this distinction. Take a gander:
That’s Ramón Laureano swinging at Little’s knuckle-curve, which Little bounced off the front edge of home plate. Here’s another (pardon Matt Olson’s cameo):
If you are familiar with Andrés Muñoz, the baseball player, you may know that he is good. It may be enough for you to simply witness and bask in his elite performance, and question it no further. (Rarely are we so content here.) You may not realize he is unusual; you may not care. Often in baseball, being good and being unusual go hand in hand. This is a short exploration, albeit one preceded by an exorbitantly long prologue, of why Muñoz is good and unusual.
If you are familiar with FanGraphs, the baseball website, you may know about approach angles. If not: A pitch’s approach angle is the three-dimensional angle at which it crosses the front of home plate. Broken down into its two-dimensional vectors, it becomes vertical approach angle (VAA) and horizontal approach angle (HAA).
VAA is a description of pitch shape and thus depends on other physical attributes of the pitch — namely, its velocity and acceleration in all three dimensions. While representing the most distilled measurements of a pitch’s movement through space, the velocity and acceleration vectors themselves are functions of release height, release angle, release speed, spin rate, spin axis, spin efficiency… it goes on. VAA, as it happens, is very sensitive to pitch height. Reporting a pitch’s average VAA is not especially meaningful without either providing locational context or stripping it of that context all together.
To accomplish the latter, I developed VAA Above Average. It’s a simple recalculation that communicates a fastball’s flatness or steepness irrespective of pitch height. Through this it’s much easier to see that, for example, flatter VAAs induce higher swinging strike rates (SwStr%) at all pitch heights compared to steeper VAAs (forgive the half-baked visualization):
Hi! It has been made to clear to me that my use of f = m * a as a narrative device herein was quite distracting, chiefly because in this context it’s incorrect. I apologize in advance to renowned baseball physicist Prof. Alan Nathan, should he ever read this; to all other physics enthusiasts who have remarked on the mistake; and to me, for embarrassing me. Ideally you will see past it and appreciate the meat and potatoes of the post for what they are: that there is possibly declining marginal utility to bat acceleration in a way we don’t seem to witness for bat speed. Thanks, and sorry again!
I can’t possibly begin to cover all the excellent work concerning Statcast’s new bat tracking data. Now as much as ever, it’s important to support your local Baseball Prospectuses, PitcherLists, Baseball Americas, FanGraphses and freelance Substack writers. We move quickly in these parts. There’s so much analysis to consume, all of it superb.
When confronted with this new data, one of my first instincts was to see which metrics from other areas of sabermetric analysis could be replicated within the bat tracking framework. Enter 90th-percentile exit velocity (90EV); it’s a powerful shorthand metric that distills a lot of information about the top end of a hitter’s exit velocity distribution into a single number. It’s not perfect, and other metrics outperform it, but it’s easy to see how it has become popular in contemporary analysis, especially in prospecting and scouting circles. Read the rest of this entry »
Release angles comprise the vertical and horizontal angles at which a pitcher releases a pitch. They are the natural counterpart to approach angles, except they capture the initial angle of a pitch’s trajectory rather than its final angle upon crossing home plate. Release angles can tell us a lot — namely, where a pitch is headed (or, at least, intended to go). However, we already have plenty of data to describe a pitch’s flight path. We have its short-form movement (i.e., total inches of break), as well as its acceleration and velocity vectors in all three dimensions, not to mention its final location coordinates. We can pretty much map the entire trajectory without release angles. Like the last unrevealed letter in Wheel of Fortune, you theoretically need it to solve the puzzle, but you can probably infer the word or phrase just fine without it. What are release angles, then, if not just a different way to describe a pitch’s movement in space? What information do release angles add? (Michael Rosen adeptly provided an answer to that question here.)
When a pitcher throws a pitch, the pitch reaches home plate in a fraction of a second. The opposing hitter, then, has a fraction of a fraction of a second to discern a great many things about the pitch: its velocity, its shape, its probable final location, all to then ascertain whether or not he should swing. Given the impossibly small window of time in which to make a swing decision, much of a hitter’s behavior is influenced by the untold thousands of pitches he’s seen before, like a mental library of pitch shapes. One of the very first visual cues a hitter receives, aside from the pitcher’s release point, is the angle at which a pitch leaves the pitcher’s hand. This particular visual cue ought to enable a hitter to determine out-of-hand a prohibitively bad pitch — one that, on most occasions, will not find the zone. He can potentially make a snap decision with a fairly high degree of confidence that the pitch will miss the zone. Read the rest of this entry »
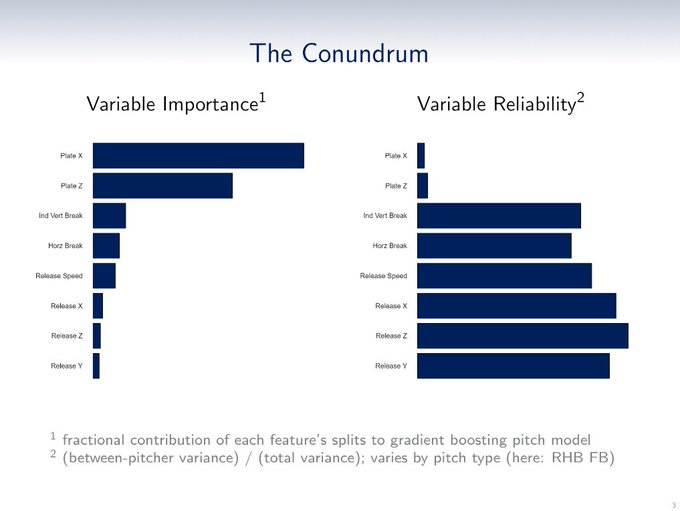
The proliferation of Stuff models has invariably pitted capital-S Stuff against command in terms of their respective importance to a pitcher’s success. If you had to choose one, is it better to locate well, or is it better to be filthy?
The answer to this question is why baseball is beautiful and delightful but also occasionally horribly frustrating. From Vicente Iglesias and Scott Powers:
Importance, in layman’s terms, means how relevant a variable is to explaining an observed outcome; reliability is how much we can expect a variable to repeat or be repeated. In baseball, we often talk about these ideas in terms of “descriptiveness” and “predictiveness.” This dichotomy illustrates the Catch-22 that forever propels baseball forward in all its uncertain glory: pitch location plays an outsized role in determining the outcomes we witness, yet we cannot expect to rely on it year over year. Meanwhile, Stuff is much more reliablenext year — i.e., changes to a pitcher’s pitches in terms of velocity, movement, and release point tend to vary to a much smaller degree over time — but it plays a significantly undersized role in influencing actual outcomes this year. Brutal stuff. Why do we even bother? Read the rest of this entry »
I’ll lead with this: I’m not certain the Launch Angle RevolutionTM was ever really a thing — or at least, it wasn’t a thing in the way we thought it was. In 2019, we were faced with an onslaught of home runs that needed an explanation, a genesis. It made sense to turn to launch angles: all else equal, if you hit balls higher, they tend to travel farther. As we’d later learn, juiced balls were much more a culprit than anything else. I wish I could find the sound byte for it – my squishy memory may have manufactured it – but I swear I recall Christian Yelich, perhaps the juiced ball’s most prominent (though, to be clear, not necessarily its biggest) beneficiary, scoffing at the concept of a “launch angle swing.” (Edit: It’s here! Thanks, Mike Petriello!) Although Yelich’s fly ball rate jumped 13.4 percentage points in 2019, he (arguably rightly) denounced the very idea of what everyone assumed had fueled his success.
There is, however, unquestionably another revolution afoot: the Pulled Fly Ball RevolutionTM. Inherently, it’s its own kind of launch angle revolution. But it’s also a spray angle revolution, and a pitch selection revolution, and a swing decision revolution. It is multifaceted and sprawling, and it is much more clearly defined than its predecessor. Here’s the percentage of batted ball events (BBE) that were pulled fly balls (PFBs, for short) by year:
In an auspicious turn of fate, while revisiting this draft, our beloved Eno Sarris reached out to ask if I had ever published anything about HAA. He had questions about Brandon Pfaadt — specifically, Pfaadt’s sweeper. Much was made about Pfaadt’s success this postseason, which can be attributed, in no small part, to his sweeper and how he weaponized it. (More on that later.) I was spurred into action. Thanks, Eno! Read the rest of this entry »
This time last year, I investigated where vertical approach angle (VAA) seems to matter most. The short answer: at the top of the strike zone for four-seam fastballs and at the bottom of the zone for sinkers and two-seam fastballs. This piece, which is adapted from a presentation I did as part of the 2022 PitcherListPitchCon, will provide much-needed additional context, like benchmarking and watermelon-colored heat-map-style graphics.
For the uninitiated — which could be many of you — VAA is the angle at which a pitch approaches home plate… vertically. Despite its usefulness, the concept has experienced slow uptake in the public sphere. I think that’s largely due to a lack of data, which, for nerds like me too entrenched in baseball Twitter, has shrouded the metric in mystery. Why are scouts and college baseball R&D departments valuing VAA so highly, why have I barely heard of it, and how can I find it?
To answer the last question: Statcast is granular enough that, fortunately, we can calculate VAA using physics. So, let’s calculate it! Thanks to Baseball Prospectus‘ Harry Pavlidis (who credits baseball’s renowned physicists), here are the equations: Read the rest of this entry »
Last year, Connor Kurcon created dynamic hard-hit rate (DHH%) to add dimension to our typical understanding of Statcast’s hard-hit rate (HardHit%). Whereas HardHit% uses a fixed minimum exit velocity (EV) threshold of 95 mph to determine a hard hit, DHH% uses a — you guessed it — dynamic threshold that changes according to launch angle of the batted ball event (BBE). Kurcon found this orientation of hard-hit rate to be more powerful than its original in terms of describing same-year contact quality (per weighted on-base average on contact, or wOBAcon), predicting next-year contact quality, and predicting itself (year-over-year “stickiness”).
Inspired by a Yermín Mercedes home run off a Willians Astudillo eephus, I borrowed the premise of DHH% and applied it to pitch velocity — that is, the dynamic threshold was based on pitch speed rather than launch angle. Although not as powerful as the original, Pitch DHH% also proved itself superior to HardHit%.
Ever since Kurcon unveiled DHH% in 2020, though, I’ve been thinking about how the premise might apply to spray angle (horizontal angle, lateral angle, whatever you want to call it). It seemed intuitive to me that a hitter would generate more power to his pull side and less to the opposite field. I suspect if you were prompted to guess, you might have said the same. Read the rest of this entry »
On May 17, Chicago White Sox legend Yermín Mercedes hit the sixth home run of his stellar, albeit wilting, nevertheless unlikely, rookie campaign. A mammoth blast over the center field wall of Target Field, the home run sparked — in equal parts, seemingly — awe and controversy.
The controversy? Mercedes teed off on a 3-0 count with one out to spare in a 15-4 blowout, off a beloved Position Player PitchingTM no less. He did so in the home park of a sputtering rival, one expected to compete for their division’s title but, at the time, had instead won half as many games (13) as it had lost (26). Naturally, a lengthy and unpleasant discourse about the game’s unwritten rules ensued. Retribution, however juvenile, was had.
At the time, the sheer amount of baggage on the home run did not register with me. My brain is so moldy and soggy that I reacted somewhat primitively. Good lord, Yermín Mercedes absolutely mashed possibly the slowest pitch I’ve ever seen.