Now Let’s Tweak Hard-Hit Rate Using Spray Angle
Last year, Connor Kurcon created dynamic hard-hit rate (DHH%) to add dimension to our typical understanding of Statcast’s hard-hit rate (HardHit%). Whereas HardHit% uses a fixed minimum exit velocity (EV) threshold of 95 mph to determine a hard hit, DHH% uses a — you guessed it — dynamic threshold that changes according to launch angle of the batted ball event (BBE). Kurcon found this orientation of hard-hit rate to be more powerful than its original in terms of describing same-year contact quality (per weighted on-base average on contact, or wOBAcon), predicting next-year contact quality, and predicting itself (year-over-year “stickiness”).
Inspired by a Yermín Mercedes home run off a Willians Astudillo eephus, I borrowed the premise of DHH% and applied it to pitch velocity — that is, the dynamic threshold was based on pitch speed rather than launch angle. Although not as powerful as the original, Pitch DHH% also proved itself superior to HardHit%.
Ever since Kurcon unveiled DHH% in 2020, though, I’ve been thinking about how the premise might apply to spray angle (horizontal angle, lateral angle, whatever you want to call it). It seemed intuitive to me that a hitter would generate more power to his pull side and less to the opposite field. I suspect if you were prompted to guess, you might have said the same.
And you would have been correct. Like last time, I examined 75th-percentile EV by spray angle using 2017-20 Statcast data and normalized for handedness (-45° is dead pull, whether right-handed or left-handed). The data largely validated my intuition:
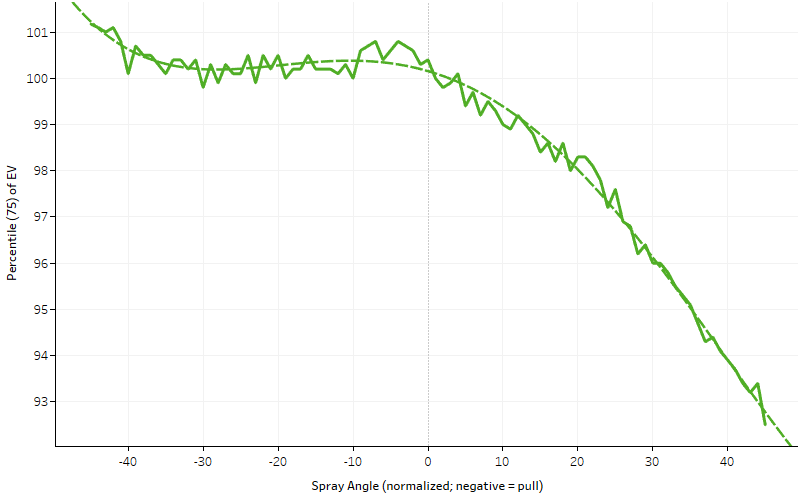
If you draw a line straight up the middle of the field, EV falls off precipitously as soon as a hitter’s spray angle crosses that line, over from the pull side to the opposite field.
D.K. Willardson, author of Quantitative Hitting: Surprising Discoveries of the Game’s Best Hitters, nearly spoiled this when he left the following comment on my June 16 post about Pitch DHH%. He articulates the concept wonderfully:
[…] it seems like spray angle should also be considered. Batted ball data as well as bat sensor data show significant increases in bat speed on pull-side contact which has a consistency ‘cost’. […] It would seem that those with ‘organic’ power like Judge should have more value than those with high pull rates that are giving them more ‘synthetic’ power.
Again, drawing a line of best fit (r² = 0.99) through the graph above, we can establish a dynamic threshold for a hard-hit rate based on spray angle (“Spray DHH%”). And, again, like its DHH% and Pitch DHH% predecessors, Spray DHH% is more powerful than HardHit% every which way you cut it:
| Metric | wOBAcon (y0) | wOBAcon (y1) | Itself (y1) |
|---|---|---|---|
| DHH%: Spray Angle | 0.466 | 0.339 | 0.728 |
| DHH%: Pitch Speed | 0.473 | 0.344 | 0.754 |
| HardHit% | 0.457 | 0.328 | 0.674 |
y0 = current year; y1 = next year
Min. 250 batted ball events in y0 and y1
(An aside: increasing the line of best fit’s intercept term — shifting the entire threshold upward — improves stickiness, but at the expense of its descriptive power. We might find similar trade-offs if we changed the original HardHit% threshold from 95 mph to, say, 97 mph. This is all to say that the dynamic threshold I’ve chosen is negotiable. Just something worth noting.)
Like DHH% with respect to launch angle, Spray DHH% captures the limits of human strength with respect to batted ball direction. In theory, it rewards Willardson’s so-called organic power more than it rewards synthetic power, crediting only legitimate power to the pull side and giving more credit to well-struck balls to the opposite field.
Take, for example, Willi Castro, who generally makes weak contact and whose batted ball profile is almost perfectly distributed: 33.5% to the pull side, 33.5% up the middle, 32.9% to the opposite field. Among 179 hitters with at least 150 BBE through July 4, he ranks 12th in improvement from HardHit% (third percentile) to Spray DHH% (30th percentile). His major-league track record is short, and his body type lends itself to gap power, but there’s evidence to suggest Castro’s power spike could be repeatable were he to de-emphasize the opposite-field approach he freshly adopted in 2021.
Spray DHH% might also help us diagnose hitters whose swings have fallen out of whack. A hitter who grades out poorly by HardHit% but performs significantly better via Spray DHH% would suggest to me he is capable of improving his average EV (and related metrics) were he to turn on the ball a bit more.
The struggling Eugenio Suárez rates highly in his transition from HardHit% to Spray DHH%. A 4.0-WAR hitter who posted a .271/.364/.521 line (128 wRC+) while averaging more than 36 home runs per year from 2017 through ’19, Suárez underwent shoulder surgery before the 2020 season. The power is still there, kind of — he has hit 32 home runs in 565 plate appearances since — but it has come with a putrid .188/.281/.415 line (85 wRC+). In his case, Spray DHH% seems particularly illuminating given its stability:
| Year | HardHit% | Spray DHH% |
|---|---|---|
| 2018 | 45.5% | 21.0% |
| 2019 | 40.8% | 21.9% |
| 2020 | 44.7% | 20.5% |
| 2021 | 35.1% | 20.7% |
The sudden and stark discrepancy between his HardHit% and Spray DHH% suggests the conditions for his well-struck balls in 2021 have changed. There’s also a launch angle issue at play here: his SweetSpot% (the percentage of batted balls between 8-32 degrees), once incredibly stable between 38% and 39% from 2016 through ’19, has dipped to 30% post-surgery. I think all of this brings into focus that — as if it weren’t already obvious — maybe, just maybe?, Suárez’s shoulder isn’t actually 100% healthy. He still appears capable of his trademark power, but there seems to be a critical bat plane issue, perhaps influenced by his shoulder health.
Bear witness, if you will, to this swing from 2018 transposed against this swing almost exactly three years later, both on middle-middle pitches. My crude trigonometry suggests Suárez’s bat angle is nearly 7 degrees steeper. And that’s before noting his stance is now slightly open and crouched in addition to (what appears to be) a leg lift that features less recoil/rotation and possibly a foot plant that occurs a millisecond later. I’m less confident in the latter details — I admit I’m a poor scout — and it’s just two swings, chosen at random. It could be nothing. But, given the circumstances, it could also be not nothing.
Meanwhile, at the other end of the spectrum, Bryan Reynolds boasts the 4th-largest improvement from HardHit% (33rd percentile) to Spray DHH% (67th percentile) of any hitter with at least 150 BBE. His Statcast profile is confounding; his nearly elite “expected” metrics (xwOBA, xBA, xSLG) are betrayed by his lackluster HardHit% and average EV. Replace HardHit% with Spray DHH%, though, and Reynolds is redeemed. (He also grades out admirably by Pitch DHH%, too, as shown below, which suggests his average EV and HardHit% are affected more by spray angle and pitch speed than his raw outcomes let on.)
The table below compares HardHit%, Pitch DHH%, and Spray DHH% for all 266 hitters with at least 100 BBE through July 4 (the table is sortable). Like Pitch DHH%, maybe Spray DHH% better explains your favorite hitter’s production (or lack thereof). Who can say? Not me. I do hope, however, that adding context and nuance to hard-hit rates improves our ability to describe, diagnose, and better appreciate hitter performance. And I suspect that these contexts — launch angle and spray angle, for example — can be layered one upon another to create a more powerful Frankenstein dynamic hard-hit rate.
| Rank | Hitter Name | BBE | [A] HardHit% |
DHH%: Pitch Velo |
[B] DHH%: Spray Angle |
[A] – [B] ∆ Percentile |
|---|---|---|---|---|---|---|
| 1 | Giancarlo Stanton | 156 | 1.00 | 1.00 | 1.00 | 0.00 |
| 2 | Aaron Judge | 201 | 0.99 | 0.99 | 1.00 | 0.01 |
| 3 | Shohei Ohtani | 189 | 0.99 | 1.00 | 0.99 | 0.00 |
| 4 | Nelson Cruz | 201 | 0.96 | 0.98 | 0.99 | 0.03 |
| 5 | Vladimir Guerrero Jr. | 238 | 0.97 | 0.99 | 0.99 | 0.01 |
| 6 | Tyler O’Neill | 147 | 0.95 | 0.95 | 0.98 | 0.03 |
| 7 | Josh Donaldson | 173 | 0.94 | 0.96 | 0.98 | 0.04 |
| 8 | Fernando Tatis Jr. | 168 | 0.99 | 0.99 | 0.97 | -0.02 |
| 9 | Manny Machado | 232 | 0.97 | 0.95 | 0.97 | 0.00 |
| 10 | Ronald Acuña Jr. | 204 | 0.97 | 0.97 | 0.97 | 0.00 |
| 11 | Franmil Reyes | 101 | 0.94 | 0.98 | 0.96 | 0.02 |
| 12 | Rowdy Tellez | 106 | 0.89 | 0.92 | 0.96 | 0.07 |
| 13 | Rafael Devers | 227 | 0.98 | 0.97 | 0.95 | -0.03 |
| 14 | Salvador Perez | 236 | 0.98 | 0.92 | 0.95 | -0.03 |
| 15 | Evan Longoria | 119 | 1.00 | 0.96 | 0.95 | -0.05 |
| 15 | Yasmani Grandal | 121 | 0.95 | 0.97 | 0.95 | -0.01 |
| 17 | Miguel Sanó | 123 | 0.89 | 0.86 | 0.94 | 0.05 |
| 18 | Matt Olson | 239 | 0.84 | 0.88 | 0.94 | 0.10 |
| 19 | Alec Bohm | 203 | 0.90 | 0.87 | 0.93 | 0.03 |
| 19 | Hunter Renfroe | 202 | 0.74 | 0.93 | 0.93 | 0.19 |
| 21 | Juan Soto | 204 | 0.94 | 0.94 | 0.92 | -0.02 |
| 22 | Joey Gallo | 159 | 0.72 | 0.94 | 0.92 | 0.20 |
| 23 | Pete Alonso | 189 | 0.85 | 0.94 | 0.92 | 0.07 |
| 24 | Bo Bichette | 260 | 0.91 | 0.87 | 0.91 | 0.01 |
| 25 | Ketel Marte | 115 | 0.91 | 0.89 | 0.91 | 0.00 |
| 26 | Gary Sánchez | 144 | 0.73 | 0.93 | 0.91 | 0.17 |
| 27 | Teoscar Hernández | 186 | 0.76 | 0.92 | 0.90 | 0.14 |
| 28 | Jorge Soler | 174 | 0.87 | 0.90 | 0.90 | 0.03 |
| 29 | Garrett Cooper | 127 | 0.91 | 0.91 | 0.89 | -0.02 |
| 30 | Justin Upton | 151 | 0.80 | 0.91 | 0.89 | 0.09 |
| 31 | Christian Yelich | 107 | 0.95 | 0.79 | 0.89 | -0.06 |
| 32 | Harold Ramirez | 145 | 0.86 | 0.95 | 0.88 | 0.02 |
| 33 | Ryan Zimmerman | 108 | 0.79 | 0.89 | 0.88 | 0.09 |
| 34 | Paul Goldschmidt | 244 | 0.96 | 0.88 | 0.88 | -0.09 |
| 35 | J.D. Martinez | 230 | 0.80 | 0.83 | 0.87 | 0.07 |
| 36 | Bobby Dalbec | 134 | 0.65 | 0.90 | 0.87 | 0.22 |
| 37 | Juan Lagares | 134 | 0.67 | 0.78 | 0.86 | 0.19 |
| 37 | Max Kepler | 131 | 0.76 | 0.74 | 0.86 | 0.11 |
| 39 | José Abreu | 211 | 0.89 | 0.84 | 0.86 | -0.04 |
| 40 | Miguel Cabrera | 168 | 0.85 | 0.83 | 0.85 | 0.01 |
| 41 | Joc Pederson | 168 | 0.89 | 0.85 | 0.85 | -0.04 |
| 42 | Jared Walsh | 207 | 0.71 | 0.92 | 0.85 | 0.14 |
| 43 | Trey Mancini | 229 | 0.53 | 0.80 | 0.84 | 0.31 |
| 44 | Andrew Vaughn | 162 | 0.90 | 0.88 | 0.84 | -0.06 |
| 45 | Tommy Pham | 192 | 0.82 | 0.74 | 0.83 | 0.01 |
| 46 | Nick Castellanos | 240 | 0.85 | 0.72 | 0.83 | -0.02 |
| 47 | Tyler Naquin | 170 | 0.70 | 0.83 | 0.83 | 0.13 |
| 48 | Josh Bell | 163 | 0.93 | 0.85 | 0.82 | -0.11 |
| 49 | Adolis García | 196 | 0.81 | 0.81 | 0.82 | 0.01 |
| 50 | Ryan McMahon | 204 | 0.86 | 0.82 | 0.82 | -0.05 |
| 51 | Clint Frazier | 118 | 0.53 | 0.79 | 0.81 | 0.29 |
| 52 | Freddie Freeman | 238 | 0.93 | 0.84 | 0.81 | -0.12 |
| 53 | Avisaíl García | 192 | 0.84 | 0.86 | 0.80 | -0.04 |
| 54 | Kyle Schwarber | 179 | 0.92 | 0.85 | 0.80 | -0.12 |
| 55 | Bryce Harper | 152 | 0.58 | 0.80 | 0.80 | 0.21 |
| 56 | Adam Duvall | 174 | 0.83 | 0.89 | 0.79 | -0.04 |
| 57 | Kelvin Gutierrez | 104 | 0.71 | 0.73 | 0.79 | 0.08 |
| 58 | Max Muncy | 175 | 0.56 | 0.80 | 0.79 | 0.23 |
| 59 | Rougned Odor | 112 | 0.59 | 0.64 | 0.78 | 0.20 |
| 60 | Pedro Severino | 141 | 0.21 | 0.53 | 0.78 | 0.57 |
| 61 | Eric Hosmer | 234 | 0.82 | 0.82 | 0.77 | -0.05 |
| 61 | Joey Votto | 145 | 0.86 | 0.72 | 0.77 | -0.08 |
| 63 | J.T. Realmuto | 160 | 0.68 | 0.74 | 0.77 | 0.08 |
| 64 | Nate Lowe | 211 | 0.65 | 0.73 | 0.76 | 0.11 |
| 65 | Randal Grichuk | 240 | 0.75 | 0.76 | 0.76 | 0.01 |
| 66 | Yordan Alvarez | 187 | 0.89 | 0.75 | 0.76 | -0.14 |
| 67 | Gregory Polanco | 152 | 0.68 | 0.68 | 0.75 | 0.08 |
| 68 | Jason Heyward | 141 | 0.61 | 0.70 | 0.75 | 0.14 |
| 69 | Willy Adames | 189 | 0.82 | 0.55 | 0.74 | -0.07 |
| 70 | Rhys Hoskins | 216 | 0.79 | 0.61 | 0.74 | -0.05 |
| 71 | Corey Seager | 118 | 0.92 | 0.77 | 0.74 | -0.18 |
| 72 | Javier Báez | 166 | 0.75 | 0.86 | 0.73 | -0.02 |
| 73 | Taylor Ward | 131 | 0.59 | 0.77 | 0.73 | 0.14 |
| 74 | Carlos Correa | 238 | 0.72 | 0.76 | 0.73 | 0.00 |
| 74 | Mitch Moreland | 119 | 0.69 | 0.61 | 0.73 | 0.03 |
| 76 | Trevor Story | 205 | 0.45 | 0.66 | 0.72 | 0.26 |
| 77 | Chris Taylor | 182 | 0.44 | 0.67 | 0.71 | 0.28 |
| 78 | José Ramírez | 237 | 0.83 | 0.79 | 0.71 | -0.12 |
| 78 | Josh Naylor | 188 | 0.58 | 0.61 | 0.71 | 0.14 |
| 80 | Austin Riley | 205 | 0.62 | 0.81 | 0.70 | 0.08 |
| 80 | Brandon Belt | 106 | 0.89 | 0.77 | 0.70 | -0.19 |
| 82 | Albert Pujols | 155 | 0.42 | 0.55 | 0.70 | 0.28 |
| 83 | Willson Contreras | 170 | 0.73 | 0.82 | 0.69 | -0.04 |
| 84 | Bryan Reynolds | 223 | 0.37 | 0.69 | 0.68 | 0.31 |
| 85 | Yandy Díaz | 206 | 0.27 | 0.56 | 0.68 | 0.41 |
| 86 | AJ Pollock | 134 | 0.65 | 0.59 | 0.68 | 0.03 |
| 87 | Anthony Rizzo | 210 | 0.73 | 0.75 | 0.67 | -0.06 |
| 88 | C.J. Cron | 156 | 0.36 | 0.53 | 0.67 | 0.31 |
| 89 | Ian Happ | 147 | 0.60 | 0.56 | 0.67 | 0.07 |
| 90 | Christian Walker | 140 | 0.52 | 0.46 | 0.66 | 0.14 |
| 91 | DJ LeMahieu | 264 | 0.64 | 0.36 | 0.66 | 0.02 |
| 92 | Jonathan Schoop | 245 | 0.51 | 0.66 | 0.65 | 0.15 |
| 93 | Carlos Santana | 243 | 0.60 | 0.62 | 0.65 | 0.05 |
| 94 | Jazz Chisholm Jr. | 146 | 0.57 | 0.54 | 0.65 | 0.08 |
| 95 | Manuel Margot | 223 | 0.63 | 0.58 | 0.64 | 0.01 |
| 96 | Odúbel Herrera | 179 | 0.41 | 0.56 | 0.64 | 0.23 |
| 97 | Seth Brown | 114 | 0.29 | 0.49 | 0.64 | 0.34 |
| 98 | Brandon Lowe | 172 | 0.46 | 0.71 | 0.63 | 0.17 |
| 99 | Jonathan Villar | 134 | 0.28 | 0.64 | 0.63 | 0.35 |
| 100 | Victor Caratini | 127 | 0.77 | 0.70 | 0.62 | -0.15 |
| 101 | Willie Calhoun | 178 | 0.55 | 0.65 | 0.62 | 0.08 |
| 102 | Yuli Gurriel | 263 | 0.66 | 0.47 | 0.62 | -0.04 |
| 103 | Randy Arozarena | 211 | 0.61 | 0.59 | 0.61 | 0.00 |
| 104 | Phillip Evans | 132 | 0.77 | 0.76 | 0.61 | -0.16 |
| 105 | Lourdes Gurriel Jr. | 223 | 0.37 | 0.40 | 0.61 | 0.24 |
| 106 | Trea Turner | 250 | 0.80 | 0.63 | 0.60 | -0.20 |
| 107 | Brandon Crawford | 181 | 0.81 | 0.73 | 0.60 | -0.21 |
| 108 | Michael A. Taylor | 163 | 0.55 | 0.54 | 0.59 | 0.05 |
| 109 | David Bote | 110 | 0.76 | 0.78 | 0.59 | -0.17 |
| 110 | Austin Hays | 159 | 0.30 | 0.59 | 0.59 | 0.29 |
| 111 | Yoán Moncada | 176 | 0.64 | 0.69 | 0.58 | -0.06 |
| 112 | Tim Anderson | 220 | 0.50 | 0.68 | 0.58 | 0.08 |
| 113 | Elias Díaz | 114 | 0.47 | 0.68 | 0.58 | 0.11 |
| 114 | Jean Segura | 170 | 0.48 | 0.67 | 0.57 | 0.09 |
| 115 | Marcell Ozuna | 142 | 0.50 | 0.67 | 0.57 | 0.07 |
| 116 | Ramón Laureano | 178 | 0.50 | 0.63 | 0.56 | 0.06 |
| 117 | Nomar Mazara | 111 | 0.56 | 0.65 | 0.56 | 0.00 |
| 118 | Francisco Lindor | 237 | 0.68 | 0.57 | 0.56 | -0.12 |
| 119 | Matt Chapman | 198 | 0.51 | 0.52 | 0.55 | 0.04 |
| 119 | Sean Murphy | 163 | 0.49 | 0.71 | 0.55 | 0.06 |
| 121 | Alex Verdugo | 257 | 0.62 | 0.42 | 0.55 | -0.08 |
| 122 | Wil Myers | 166 | 0.44 | 0.31 | 0.54 | 0.10 |
| 123 | Ty France | 219 | 0.36 | 0.57 | 0.54 | 0.18 |
| 124 | Travis Shaw | 129 | 0.40 | 0.58 | 0.53 | 0.14 |
| 125 | Gio Urshela | 198 | 0.64 | 0.60 | 0.53 | -0.11 |
| 126 | David Peralta | 232 | 0.49 | 0.50 | 0.53 | 0.03 |
| 127 | Mitch Haniger | 238 | 0.69 | 0.55 | 0.52 | -0.17 |
| 128 | James McCann | 145 | 0.78 | 0.50 | 0.52 | -0.26 |
| 129 | Enrique Hernández | 198 | 0.33 | 0.39 | 0.52 | 0.19 |
| 130 | Miguel Andújar | 122 | 0.34 | 0.52 | 0.51 | 0.17 |
| 131 | Corey Dickerson | 160 | 0.14 | 0.42 | 0.51 | 0.37 |
| 132 | Alex Kirilloff | 137 | 0.63 | 0.70 | 0.50 | -0.12 |
| 133 | Austin Slater | 107 | 0.71 | 0.62 | 0.50 | -0.21 |
| 134 | Jesse Winker | 239 | 0.87 | 0.64 | 0.50 | -0.38 |
| 135 | Jonathan India | 178 | 0.29 | 0.43 | 0.49 | 0.21 |
| 136 | Jed Lowrie | 213 | 0.77 | 0.49 | 0.49 | -0.29 |
| 137 | Gavin Lux | 184 | 0.56 | 0.51 | 0.49 | -0.08 |
| 138 | Michael Brantley | 229 | 0.78 | 0.58 | 0.48 | -0.30 |
| 139 | Austin Meadows | 211 | 0.52 | 0.44 | 0.48 | -0.04 |
| 140 | Trent Grisham | 150 | 0.45 | 0.46 | 0.47 | 0.02 |
| 141 | Xander Bogaerts | 242 | 0.48 | 0.50 | 0.47 | -0.01 |
| 142 | Anthony Santander | 149 | 0.58 | 0.65 | 0.47 | -0.12 |
| 143 | Daniel Vogelbach | 129 | 0.83 | 0.60 | 0.46 | -0.36 |
| 144 | Eugenio Suárez | 194 | 0.22 | 0.48 | 0.46 | 0.24 |
| 145 | Jesús Aguilar | 226 | 0.67 | 0.45 | 0.45 | -0.21 |
| 146 | Michael Conforto | 107 | 0.19 | 0.47 | 0.45 | 0.26 |
| 147 | Ben Gamel | 100 | 0.41 | 0.52 | 0.45 | 0.04 |
| 148 | Kyle Tucker | 229 | 0.92 | 0.62 | 0.44 | -0.47 |
| 149 | Paul DeJong | 140 | 0.27 | 0.41 | 0.44 | 0.17 |
| 150 | Hunter Dozier | 157 | 0.74 | 0.48 | 0.44 | -0.30 |
| 151 | DJ Stewart | 117 | 0.14 | 0.35 | 0.43 | 0.29 |
| 152 | Jake Bauers | 134 | 0.57 | 0.42 | 0.43 | -0.14 |
| 153 | Ryan Mountcastle | 201 | 0.41 | 0.44 | 0.42 | 0.02 |
| 154 | Starling Marte | 130 | 0.23 | 0.51 | 0.42 | 0.20 |
| 155 | Mike Yastrzemski | 175 | 0.47 | 0.38 | 0.42 | -0.05 |
| 156 | Charlie Blackmon | 220 | 0.54 | 0.53 | 0.41 | -0.12 |
| 157 | Buster Posey | 157 | 0.70 | 0.27 | 0.41 | -0.29 |
| 158 | Erik González | 181 | 0.11 | 0.37 | 0.41 | 0.30 |
| 159 | Kyle Seager | 230 | 0.61 | 0.32 | 0.40 | -0.21 |
| 159 | Mookie Betts | 229 | 0.52 | 0.29 | 0.40 | -0.12 |
| 161 | Maikel Franco | 241 | 0.15 | 0.45 | 0.39 | 0.24 |
| 162 | Pavin Smith | 237 | 0.74 | 0.39 | 0.39 | -0.35 |
| 163 | Alex Dickerson | 117 | 0.55 | 0.38 | 0.39 | -0.17 |
| 163 | Dylan Moore | 118 | 0.19 | 0.26 | 0.39 | 0.20 |
| 165 | Tyler Stephenson | 140 | 0.43 | 0.29 | 0.38 | -0.05 |
| 166 | Amed Rosario | 212 | 0.54 | 0.35 | 0.38 | -0.17 |
| 167 | Dansby Swanson | 215 | 0.79 | 0.38 | 0.37 | -0.41 |
| 168 | Dominic Smith | 192 | 0.40 | 0.30 | 0.37 | -0.03 |
| 169 | Starlin Castro | 229 | 0.42 | 0.43 | 0.36 | -0.06 |
| 170 | Marwin Gonzalez | 159 | 0.34 | 0.37 | 0.36 | 0.02 |
| 171 | Jon Berti | 156 | 0.45 | 0.31 | 0.36 | -0.09 |
| 172 | Nick Solak | 222 | 0.26 | 0.41 | 0.35 | 0.10 |
| 173 | Brett Gardner | 132 | 0.20 | 0.28 | 0.35 | 0.15 |
| 174 | Cesar Hernandez | 234 | 0.42 | 0.39 | 0.35 | -0.08 |
| 175 | Jeimer Candelario | 205 | 0.29 | 0.45 | 0.34 | 0.05 |
| 176 | Colin Moran | 112 | 0.13 | 0.44 | 0.34 | 0.21 |
| 177 | Will Smith | 170 | 0.66 | 0.33 | 0.33 | -0.33 |
| 178 | Mike Tauchman | 102 | 0.22 | 0.16 | 0.33 | 0.11 |
| 179 | Edmundo Sosa | 107 | 0.06 | 0.23 | 0.33 | 0.26 |
| 180 | Mark Canha | 204 | 0.53 | 0.24 | 0.32 | -0.21 |
| 181 | Jose Altuve | 247 | 0.48 | 0.32 | 0.32 | -0.16 |
| 182 | Carson Kelly | 116 | 0.31 | 0.49 | 0.32 | 0.00 |
| 183 | Willi Castro | 173 | 0.05 | 0.40 | 0.31 | 0.26 |
| 184 | Yermín Mercedes | 195 | 0.06 | 0.24 | 0.31 | 0.25 |
| 185 | Niko Goodrum | 116 | 0.47 | 0.35 | 0.30 | -0.17 |
| 186 | Kolten Wong | 164 | 0.43 | 0.33 | 0.30 | -0.13 |
| 187 | Kris Bryant | 202 | 0.40 | 0.34 | 0.30 | -0.11 |
| 188 | Ha-Seong Kim 김하성 김하성 | 130 | 0.11 | 0.21 | 0.29 | 0.19 |
| 189 | Guillermo Heredia | 118 | 0.33 | 0.26 | 0.29 | -0.05 |
| 190 | Jorge Polanco | 240 | 0.38 | 0.35 | 0.29 | -0.09 |
| 191 | Jake Cronenworth | 271 | 0.24 | 0.25 | 0.28 | 0.04 |
| 191 | Raimel Tapia | 268 | 0.23 | 0.17 | 0.28 | 0.05 |
| 193 | Billy McKinney | 126 | 0.31 | 0.29 | 0.27 | -0.03 |
| 194 | Joey Wendle | 185 | 0.21 | 0.18 | 0.27 | 0.06 |
| 195 | Alex Bregman | 189 | 0.35 | 0.24 | 0.27 | -0.08 |
| 196 | Gleyber Torres | 202 | 0.16 | 0.16 | 0.26 | 0.11 |
| 197 | Adam Eaton | 133 | 0.35 | 0.28 | 0.26 | -0.09 |
| 197 | Ozzie Albies | 255 | 0.30 | 0.36 | 0.26 | -0.04 |
| 199 | Marcus Semien | 249 | 0.62 | 0.26 | 0.25 | -0.36 |
| 200 | Jackie Bradley Jr. | 162 | 0.71 | 0.47 | 0.25 | -0.46 |
| 201 | Nolan Arenado | 270 | 0.32 | 0.18 | 0.24 | -0.07 |
| 202 | Luis Urías | 191 | 0.39 | 0.15 | 0.24 | -0.15 |
| 203 | Justin Turner | 226 | 0.67 | 0.41 | 0.24 | -0.43 |
| 204 | Victor Robles | 147 | 0.12 | 0.27 | 0.23 | 0.11 |
| 205 | Asdrúbal Cabrera | 142 | 0.15 | 0.09 | 0.23 | 0.08 |
| 206 | Cedric Mullins | 253 | 0.49 | 0.32 | 0.23 | -0.26 |
| 207 | Didi Gregorius | 100 | 0.03 | 0.20 | 0.22 | 0.19 |
| 208 | Kevin Pillar | 137 | 0.30 | 0.19 | 0.22 | -0.09 |
| 209 | Elvis Andrus | 235 | 0.25 | 0.25 | 0.21 | -0.04 |
| 210 | Robbie Grossman | 213 | 0.24 | 0.12 | 0.21 | -0.03 |
| 211 | Cavan Biggio | 134 | 0.25 | 0.09 | 0.21 | -0.04 |
| 212 | Miguel Rojas | 191 | 0.14 | 0.14 | 0.20 | 0.07 |
| 213 | Yadier Molina | 186 | 0.26 | 0.30 | 0.20 | -0.06 |
| 214 | David Dahl | 115 | 0.38 | 0.23 | 0.20 | -0.18 |
| 215 | Andrew McCutchen | 192 | 0.39 | 0.30 | 0.19 | -0.20 |
| 216 | Yan Gomes | 155 | 0.32 | 0.36 | 0.19 | -0.14 |
| 217 | Donovan Solano | 148 | 0.10 | 0.15 | 0.18 | 0.08 |
| 217 | Tommy Edman | 300 | 0.27 | 0.27 | 0.18 | -0.09 |
| 219 | J.P. Crawford | 254 | 0.13 | 0.22 | 0.18 | 0.05 |
| 220 | Matt Beaty | 103 | 0.09 | 0.18 | 0.17 | 0.08 |
| 221 | Charlie Culberson | 115 | 0.04 | 0.08 | 0.17 | 0.13 |
| 222 | Mauricio Dubón | 122 | 0.15 | 0.21 | 0.17 | 0.02 |
| 223 | Kevin Kiermaier | 122 | 0.24 | 0.21 | 0.16 | -0.08 |
| 223 | Willians Astudillo | 113 | 0.12 | 0.33 | 0.16 | 0.04 |
| 225 | Eddie Rosario | 240 | 0.26 | 0.17 | 0.15 | -0.11 |
| 226 | Leury García | 163 | 0.18 | 0.20 | 0.15 | -0.03 |
| 227 | Wilmer Flores | 173 | 0.09 | 0.11 | 0.15 | 0.05 |
| 228 | Eduardo Escobar | 239 | 0.23 | 0.23 | 0.14 | -0.09 |
| 229 | Andrew Benintendi | 177 | 0.59 | 0.15 | 0.14 | -0.45 |
| 230 | Nick Ahmed | 172 | 0.07 | 0.20 | 0.14 | 0.06 |
| 231 | Isiah Kiner-Falefa | 281 | 0.09 | 0.14 | 0.13 | 0.05 |
| 232 | Francisco Mejía | 108 | 0.17 | 0.11 | 0.13 | -0.04 |
| 233 | José Iglesias | 217 | 0.12 | 0.22 | 0.12 | 0.01 |
| 234 | Christian Vázquez | 206 | 0.11 | 0.09 | 0.12 | 0.01 |
| 235 | Kyle Farmer | 188 | 0.10 | 0.13 | 0.12 | 0.02 |
| 236 | Jose Trevino | 135 | 0.33 | 0.17 | 0.11 | -0.22 |
| 237 | Josh Rojas | 195 | 0.28 | 0.12 | 0.11 | -0.17 |
| 238 | Whit Merrifield | 287 | 0.08 | 0.06 | 0.11 | 0.02 |
| 239 | Joshua Fuentes | 171 | 0.08 | 0.08 | 0.10 | 0.02 |
| 240 | Jeff McNeil | 123 | 0.36 | 0.14 | 0.10 | -0.27 |
| 241 | Jurickson Profar | 189 | 0.08 | 0.08 | 0.09 | 0.02 |
| 242 | Anthony Rendon | 178 | 0.39 | 0.05 | 0.09 | -0.30 |
| 243 | Dylan Carlson | 223 | 0.16 | 0.10 | 0.09 | -0.08 |
| 244 | Freddy Galvis | 194 | 0.17 | 0.11 | 0.08 | -0.09 |
| 245 | Martín Maldonado | 129 | 0.20 | 0.13 | 0.08 | -0.12 |
| 246 | Jacob Stallings | 161 | 0.17 | 0.19 | 0.08 | -0.10 |
| 247 | Akil Baddoo | 126 | 0.18 | 0.12 | 0.07 | -0.11 |
| 248 | Omar Narváez | 159 | 0.06 | 0.06 | 0.07 | 0.01 |
| 249 | Josh Harrison | 202 | 0.18 | 0.07 | 0.06 | -0.12 |
| 250 | Tucker Barnhart | 124 | 0.20 | 0.05 | 0.06 | -0.14 |
| 251 | Hanser Alberto | 130 | 0.02 | 0.10 | 0.06 | 0.04 |
| 252 | Kevin Newman | 261 | 0.02 | 0.05 | 0.05 | 0.03 |
| 253 | Luis Arraez | 180 | 0.35 | 0.01 | 0.05 | -0.30 |
| 254 | Garrett Hampson | 193 | 0.21 | 0.07 | 0.05 | -0.17 |
| 255 | Andrelton Simmons | 178 | 0.02 | 0.06 | 0.04 | 0.02 |
| 256 | Joe Panik | 107 | 0.03 | 0.03 | 0.04 | 0.01 |
| 257 | Nick Madrigal | 184 | 0.01 | 0.02 | 0.03 | 0.02 |
| 258 | Adam Frazier | 284 | 0.05 | 0.03 | 0.03 | -0.02 |
| 259 | Yonathan Daza | 188 | 0.07 | 0.02 | 0.03 | -0.04 |
| 260 | Brock Holt | 109 | 0.05 | 0.03 | 0.02 | -0.02 |
| 261 | Harold Castro | 113 | 0.45 | 0.04 | 0.02 | -0.43 |
| 262 | Nicky Lopez | 183 | 0.04 | 0.01 | 0.02 | -0.03 |
| 263 | Myles Straw | 223 | 0.03 | 0.04 | 0.01 | -0.02 |
| 264 | David Fletcher | 278 | 0.00 | 0.02 | 0.01 | 0.00 |
| 265 | Eric Sogard | 130 | 0.00 | 0.00 | 0.00 | 0.00 |
| 266 | Tony Kemp | 138 | 0.01 | 0.00 | 0.00 | -0.01 |
Rank according to “[B] DHH%: Spray Angle”
(Note that Castro’s, Suárez’s, and Reynolds’ percentiles appear different in the table because the minimum threshold was lowered from 140 BBE to 100 BBE.)
Don’t know why this article hasn’t gotten more comments, just wanted to say this is really great work!
Thanks, Ryan! Too many numbers and not enough spin rate talk or team-specific slander, I suppose!
Good stuff, Alex. Per usual.
Great article! Just curious, how did you get the numbers to calculate this stuff?
I love these articles! have you looked into hard hit rate adjusted by the distance of the pitch from the heart of the plate? also what if you did the rankings a z-scores instead of percentiles (or even do re-scaled z-scores so it could be like 20-80 scout grades for hard hit)
I’m guessing, on your latter question, it’s because the data seems skewed right. That is, the delta value skews positive, such that z-scores risk misrepresenting the conformity about the mean of the two distributions. These percentiles could better reflect a comparison of a population to itself, rather than to an optimal distribution of differences. But there is no harm in experimenting.