Where Vertical Approach Angle Seems to Matter Most
A couple of weeks ago, I was chatting with PitcherList’s Alex Fast about four-seam fastballs swinging strike rates (SwStr%) and their relationship to pitch height — or, perhaps more specifically, their lack of relationship. At the pitcher-season level (e.g., “2020 Clayton Kershaw“), the correlation between SwStr% and pitch height appeared weak at best. When you consider that no fastball is created equal and then introduce small-sample variance to the equation, the relationship could, understandably, become blurred at the pitcher level.
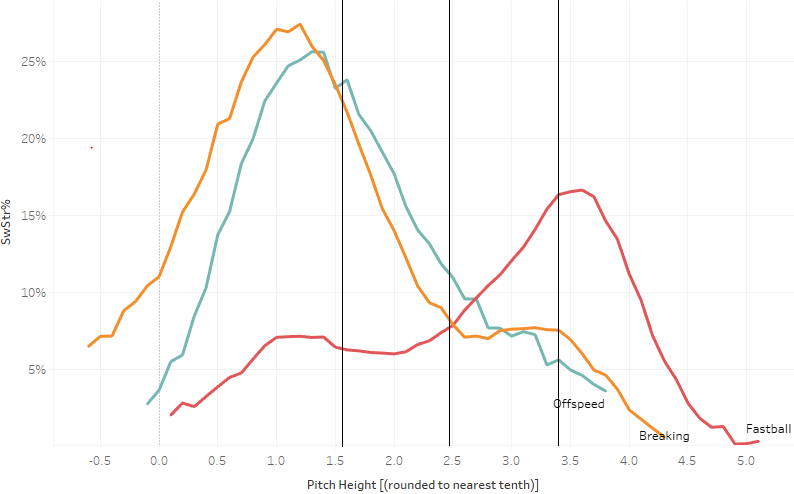
As a retort, I sent him the following graph, which shows SwStr% by pitch height for the three broad pitch classes as defined by Statcast, the source of the data. For reference, I’ve added black lines to indicate the average bottom, heart, and top of the strike zone:
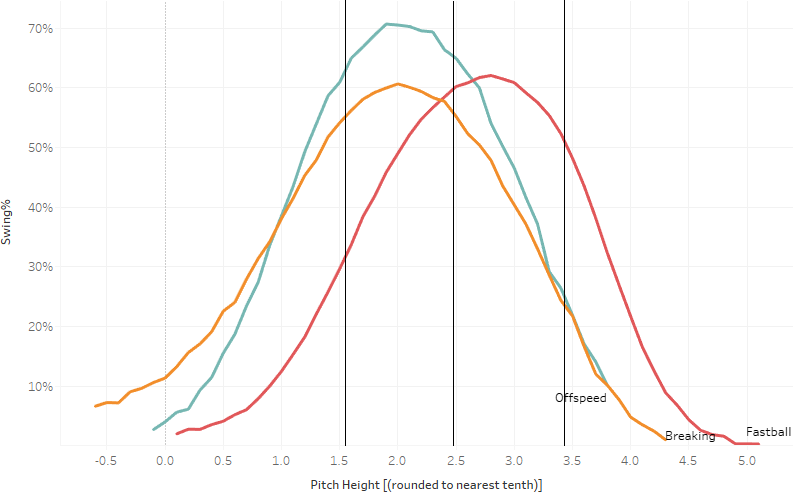
If we zoom out and consider the question at the macro level, independent of context (what’s the average swinging strike rate for all fastballs by pitch height?), we can see that fastballs generate more swinging strikes up in the zone, a phenomenon our own Jeff Zimmerman touched upon here. This finding is mildly interesting in and of itself. But as I considered the matter further, the importance of swing frequency (Swing%) to SwStr% became clear (both use all pitches as a denominator). Regardless of efficacy, more swings will afford more chances for swinging strikes. As such, I anticipated that fastballs probably induce more swinging strikes up high than down low simply because hitters swing more frequently at high fastballs. Similarly (but inversely), non-fastballs would generate more swinging strikes down low instead of up high. The next graph all but affirmed my intuition:
Although the peaks of the bell curves cluster near the heart of the zone, we can see distinct differences in swing rate by pitch class at the thresholds of the strike zone. At its bottom edge, hitters are half as likely to swing at fastballs as they are at non-fastballs; at its top edge, twice as likely.
The logical next step was to pair the two graphs together. Generally, each pitch class has a distinct swing frequency profile and, thus, a distinct swinging strike profile. How does each pitch class fare on swings alone? Isolating swings would measure the true swinging-strike efficacy of each pitch class by not giving or taking away credit for swing frequency.
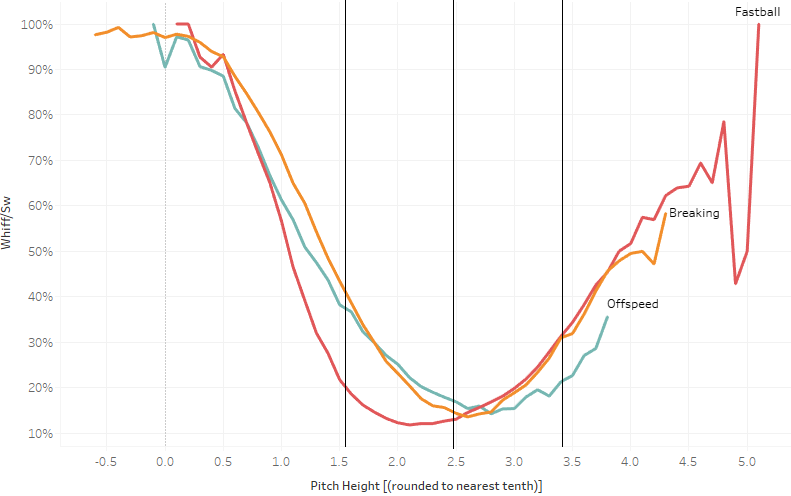
I’ll be frank: the question seemed like a waste of time. A quick Statcast query can tell me that, for example, sliders generated swinging strikes nearly 7 percentage points more often than four-seamers. Yet I checked anyway. If I were a true clickbait expert, I might say “these results will shock you.” (Also: singles in your area.) Here are whiffs per swing (I’ll call this Whiff%) plotted against pitch height for each pitch class:
Unsurprisingly, on average, in most areas of the zone, fastballs generate whiffs nearly or just as effectively as non-fastballs.
There are so many other factors to pitch effectiveness (and effective pitching, which aren’t the same!). But, on average, is it possible that pitch height is the great differentiator and, therefore, also the great equalizer? It’s not as ridiculous a question as it may seem. I also know its answer is not so simple, either, because the curves are not quite shaped exactly the same. Allow me to draw your attention back to the top and bottom of the zone, circled in purple:
At the bottom edge of the zone, fastballs generate about half as many whiffs per swing as non-fastballs. At the top edge of the zone, fastballs generate not only as many (or more) whiffs as non-fastballs but also continue to show efficacy way, way above the zone where other pitches no longer do.
This, at least for me, inspires a question: why? Why does this happen? It’s not enough (again, at least for me) to accept that pitchers are trained to throw (and/or that hitters are trained to expect) fastball high, non-fastballs low, or that it’s “just the way it is.” Maybe it’s what is done typically — it’s an inarguable fact, observable in hundreds of thousands of lines of Statcast data — but it doesn’t explain how or why it came to be. It must have come from somewhere.
Now is as good a time as any to (re-)introduce the topic of approach angle, which Ethan Moore, momentarily of Prospects365 but now freshly and deservedly of the Twins’ R&D department, discusses wonderfully here. (Fast pointed me to this video — it’s a great primer on approach angle for the uninitiated.)
Merriam and Webster would roll in their graves if they read this definition, but: a pitch’s approach angle is, well, the angle at which it approaches home plate. For these purposes, approach angle is calculated as it breaches the front plane of the strike zone. It uses a pitch’s velocity measured in all three observable dimensions at multiple points throughout its flight path as well as its acceleration and final pitch location. Effectively, it uses several physical characteristics of a pitch, physics, and a little bit of algebra to determine the trajectory of the pitch in question as it crosses home plate. (Approach angle can be perceived both vertically and horizontally; for the purposes of this post, I will refer only to vertical approach angle, or VAA.)
The concept is intuitive to anyone who has ever watched a baseball game. Compare, mentally, the traditional movement profile of a curve (which dives down) to a fastball (which travels with significantly less movement, especially vertically). However, intuitive as it may be, it’s somewhat of a new frontier for sabermetric analysis, at least in the public sphere and to my knowledge. Private entities with robust data collection efforts — Driveline, college programs, etc. — appear to already be on the cutting edge of approach angle, among many other topics. Personally, I only started toying with approach angle data a week or two ago!
While I suspect VAA can help explain many pitching-related phenomena (and hitting-related phenomena, for that matter), I expect it exerts profound influence in crucial areas of the zone where pitch height alone cannot explain discrepancies in swing frequency and whiff efficacy. Perhaps breaking pitches perform better than fastballs low in the zone (on a per-swing basis) because a steep VAA allows the pitch to dive below a swung bat; (again) similarly and (again) inversely, a shallow VAA high in the zone increases the relative effectiveness of fastballs by giving the impression of it “jumping” or “rising” over the swing. Ultimately, at the extreme ends of the strike zone, similarly extreme VAAs test — and exploit — the limitations of the typical hitter’s swing. Intuitive, yes, bordering on redundant — as avid baseball fans, we see this happen time and again — but it’s not insignificant to confirm anecdotal observation with concrete data.
Thanks to previous analysis by Moore, we know how VAA behaves within pitch types. Thanks to a handful of stripped-down multiple linear regressions, we know VAA explains a consequential amount of the variance in fastball effectiveness, less so for other pitch types:
So it turns out that [vertical approach angle] and [horizontal approach angle] are helpful to our understanding of what makes a good fastball. But they are also highly correlated with pitch location, which we already knew was important for a good fastball. So in the end, there really is not much new information here.
His takeaway is not wrong! As Moore notes, pitch height is important and VAA correlates strongly and linearly with pitch height. But I think these conclusions are limited — that by testing the value of VAA within, rather than agnostic of, pitch types, we captures only part but not all of VAA’s value. Moreover, pitch height behaves nonlinearly with whiffs, which means VAA does, too.
This is best exemplified with a heatmap of how VAA contributes to differences in whiffs per swing, regardless of pitch class. Red equals more whiffs per swing, blue equals fewer:
VAA behaves almost uniformly in the strike zone, whether you throw a flat-VAA pitch (a four-seamer!) or a steep-VAA pitch (a curve!). It is blue, blue, blue throughout irrespective of pitch height and of VAA — on average, there are virtually no gains to be had. It’s only at and slightly outside the upper and lower thresholds of the zone where VAAs — especially extreme VAAs — play an outsized role in generating whiffs. Moreover, pitch height is only as important as the VAA of the pitch enables it to be. As the heatmap shows, while pitch height matters, you can’t throw a shallow pitch low (or a steep pitch high) and expect the same kind of swing-and-miss effectiveness as a steep pitch low (shallow pitch high).
The broader implication of this, at least from a development standpoint, seems to be that, all else equal, a pitcher ought to try to develop pitches with outlier VAAs (extremely flat fastballs, extremely steep curves, and so on):
- Swing frequency (Swing%) differs by pitch type (“type” being a catch-all term to describe the amalgamation of any number of physical characteristics that makes one varietal of pitches distinct from another) at various pitch heights
- and whiff frequency (Whiff%) differs by VAA at various pitch heights
- such that unique combinations of VAA and pitch height establish unique patterns for swinging strikes (SwStr%) throughout the zone.
- These patterns underpin an approach that prioritizes high fastballs and low non-fastballs.
Realistically, this is not feasible, at least not for every pitcher — they can’t all be physically capable of becoming developmental success stories. More importantly, pure VAA optimization may not be necessary if a pitcher embraces his existing, naturally occurring skill set and arsenal, and optimizing his approach via game theory instead.
Rather than view swing frequency as a line graph, it ought to also be viewed as a heatmap, with VAA plotted against pitch height:
Like that of whiffs, the relationship between VAA and pitch height with respect to swings is nonlinear. VAA’s influence is minimal at the heart of the zone but increases the farther a pitch diverges from it. At the bottom of the strike zone, where flat pitches generally exhibit poor swing-and-miss tendencies, those same pitches exhibit an uncanny ability to cause a hitter’s bat to stay on his shoulder.
Swinging strikes are king, but a strike is nevertheless a strike. A called strike gets the job done, too, if the pitcher can reliably earn it.
Two fastballs could not better exemplify the two sides of this same coin than Freddy Peralta‘s and Walker Buehler’s four-seamers. Both are among the game’s flattest in terms of height-adjusted VAA but are deployed quite differently: Peralta frequently locates his up; Buehler, down.
Their outcomes synthesize all the evidence presented here. Among 114 four-seamers thrown at least 250 times last year, Peralta’s very flat fastball thrown very high generated the seventh-best swinging strike rate (a whopping 17.1%). Buehler’s very flat fastball thrown very low generated the 12th-best called strike rate (23.8%). Both make for nearly perfect anecdotes in support of the above heatmap.
However, a third four-seamer, Zack Greinke‘s, is quite steep in relative terms; it doesn’t benefit from that same flatness. But Greinke commands it so masterfully in the bottom of the zone that, in 2020, he achieved the highest frequency of called strikes of any four-seamer. A fourth four-seamer, Blake Snell’s, which is relatively steep for a four-seamer but frequently located up, allowed a miserable .444 wOBA, fifth-worst among 73 four-seamers thrown at least 300 times last year. Yikes. That said, both his breaking pitches are so lethal that I could envision him adopting a Buehleresque or Shane Bieberesque approach — fastballs low, elite secondaries buried in the dirt — with massive success.
All of which is to say: pitch height and VAA are important separately, and even more important paired together. But if a pitcher cannot generate elite VAAs on his pitches, he need not feel obligated to follow a traditional roadmap for success (“fastballs high, non-fastballs low”). Indeed, Greinke is nontraditional: if he lived high and not low, I imagine he’d run a greater risk of his relatively steep four-seamer getting torched than someone with a flatter fastball. Instead, he makes a living on called strikes and weak contact low in the zone (something I’ve discussed before, not coincidentally!). Again, not everyone can thrive this way — the margin for error is certainly slimmer, and it’s why Greinke and Kyle Hendricks and Dallas Keuchel are exceptions rather than the norm — but it can be accomplished under the right circumstances.
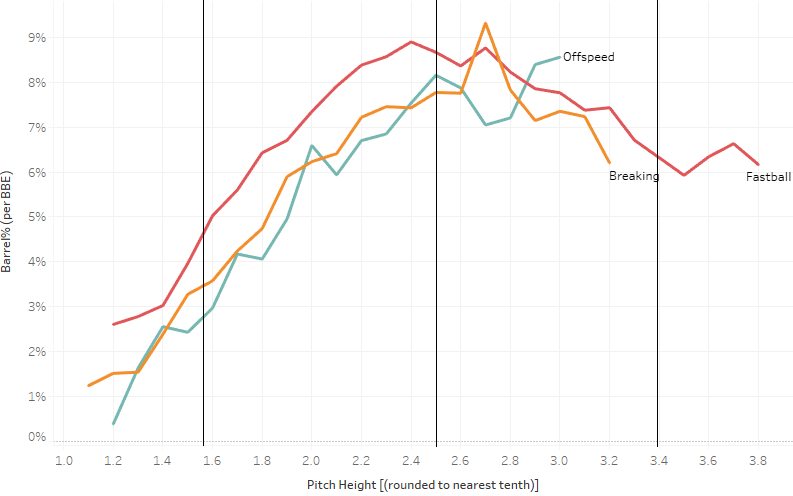
Fast devoted an entire post to low four-seamers Monday, expounding on Buehler for this very reason. Ben Palmer (also of PitcherList) made the assertion that one need not throw breaking pitches exclusively low in the zone. The evidence here would suggest otherwise; on average, a breaking pitch will be consistently more effective lower in the zone than higher, not only in terms of whiffs but also in terms of contact quality allowed (as measured by barrel rate, or Barrel%):
Independent of context, hitters swing less than half as often at breaking balls at the top of the zone than at the bottom, resulting in fewer whiffs overall; and all pitch classes (not just breaking balls) typically allow harder contact at the top of the zone.
But this is on average. When it comes down to brass tacks, breaking pitches, like fastballs, are not all created equal. A pitcher with, say, above-average command and a relatively flat curve could possibly locate his curve high in the zone for not only (1) comparable whiffs on a per-swing basis [image 3] but also (2) above-average called strikes [images 2 and 6].
Ultimately, how a pitcher should deploy his fastball (or curve, slider, or change-up) depends on whom you ask — Justin Verlander or Hendricks, Gerrit Cole or Keuchel. None of their answers would necessarily be wrong. Instead, they would and should depend on the physical composition and limitations of their pitches and selves.
In conclusion…
I’m no physicist, but certainly Statcast’s publication of HawkEye-measured spin axis data relates to this work. For describing or predicting performance, I preach getting as close as possible to physical inputs rather than relying on observed outcomes. Approach angle is not quite there — it’s influenced by things like velocity and acceleration, spin and active spin, spin axis and Magnus force and seam-shifted wake and other topics I’m too dense to understand — but it’s close. I’m not here (nor am I qualified) to instruct you how to augment these physical properties in order to augment approach angle. I’m just a nerd with some Statcast data and some observations.
That said: pitches behave quite similarly across pitch heights in terms of swing-and-miss frequency regardless of pitch class or pitch type. Only at and just outside the thresholds of the strike zone do we see pronounced differences in effectiveness — and those differences can be attributed directly to steep VAA pitches located low and shallow VAA pitches located high. That’s where and how the proverbial edge is captured, and it stands to reason, albeit without any proof from me, that changing eye levels in conjunction with such extreme features might further exaggerate this edge.
However, it seems to make sense to this author to craft a locational approach based on the pitch’s VAA, regardless of the pitch type label assigned to it (VAA influences these labels anyway). Location-based swing frequency depends on VAA, so a location-based plan of attack can optimize swing rate in order to maximize strikes (whether called or swinging) rather than adopt a one-size-fits-all blueprint.
This rings especially true for fastballs that don’t achieve the requisite “flatness” to live up in the zone (where all the whiffs are) without getting torched. Because hitter quality of contact increases higher in the zone, a pitcher’s already-thin margin for error becomes ever slimmer the steeper his fastball is. The same could be said of relatively flat curves low in the zone.
Moreover, there’s a game theory element to all of this — zigging where others zag, like Buehler does with his flat four-seamer low in the zone. Again, notion of one size not actually fitting all feels intuitive. It draws parallels to plenty of non-sports applications. But it’s nice to see data support it.
Discussed minimally here: these heatmaps show just how vulnerable pitches are when thrown in or near the heart of the zone. It takes exceptional command to allow a fastball to thrive low in the zone, let alone satisfactory command to ensure it does not get punished routinely. This should serve as additional testament to under-appreciated command/contact-quality artists like Hendricks, Greinke, Keuchel, and others who can pull it off.
Lastly, in my macro approach, I refer most frequently to the two pitch types with the biggest average differences in VAA: four-seamers and curves. Their extremes help elucidate the point. I think, at least for now, that an apples-to-oranges comparison may be most effective with respect to VAA. I don’t doubt, however, that VAA-pitch height analysis could still benefit from a “micro” approach and be replicated within a pitch type — say, comparing X change-up to all other change-ups.
Thanks are due to Baseball Prospectus’ Harry Pavlidis (with an assist on the assist from renowned baseball physicist Alan Nathan) for graciously explaining to me how to calculate approach angle; Noah Thurm for not only helping me organize my concluding thoughts but also lending a crucial perspective on possible takeaways I overlooked; and Alex Fast for inadvertently providing the inspiration to help me tie up loose ends I had struggled to reconcile.


Awesome