
Weird Stuff Is Going on in Extra Innings, Man
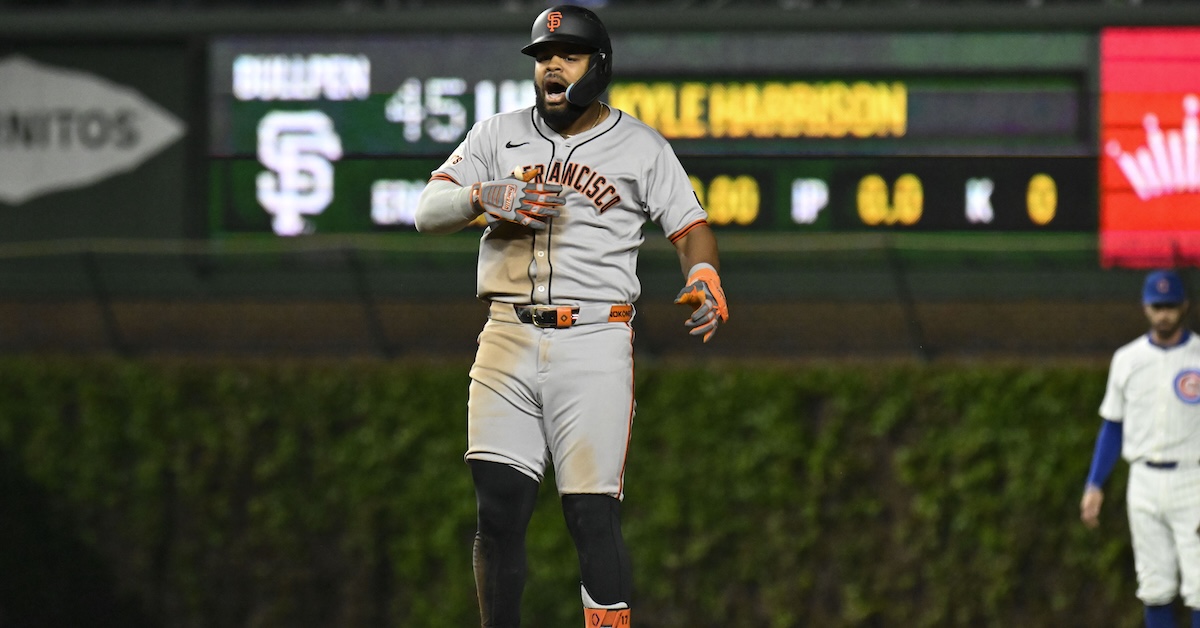
Things did not go well for the Cubs’ Ryan Pressly on Tuesday night against the Giants at Wrigley Field. Chicago had clawed its way back from a fourth-inning, 5-2 deficit, capped by a two-run, ninth-inning rally that sent the game into extra innings. After an uneventful 10th, all hell broke loose in the 11th, as Pressly failed to retire any of the eight batters he faced. By the time the dust settled, nine runs had scored, and unlike the Cubs’ April 18 game against the Diamondbacks, where they answered 10 eighth-inning runs with six of their own on the bottom of the frame and won 13-11, this time they fell 14-5.
As you might expect, it took a bad break or two to blow the doors open in that 11th inning. Following a double by Heliot Ramos and an RBI single by Patrick Bailey, Brett Wisely laid down a sacrifice bunt toward the first base side of the mound. Pressly fielded the ball and made an awkward, backhanded flip to Carson Kelly, but the ball dribbled under the catcher’s glove. Ramos was safe at home and Wisely reached first, still with nobody out. Mike Yastrzemski walked to load the bases, and then Willy Adames was hit by a pitch to force in Bailey. On the replay, it looked like a wild pitch that had gotten by Kelly, which would have advanced the runners and scored the run nonetheless, but home plate umpire Bill Miller ruled the ball had grazed Adames. The call was upheld after the Cubs challenged it, adding another baserunner to the mix, and consecutive singles by Jung Hoo Lee, Matt Chapman, and Wilmer Flores brought in four more runs (two on Chapman’s hit). With the score already a lopsided 11-5, Cubs manager Craig Counsell mercifully gave Pressly the hook.
The onslaught didn’t stop. Reliever Caleb Thielbar entered and finally recorded the first out by striking out Christian Koss before serving up an RBI double to Ramos. Bailey added a sacrifice fly before David Villar, pinch-hitting for Wisely, struck out. The Cubs went down in order against Kyle Harrison in the bottom of the 11th, and that was that.
Poor Pressly. He had pitched just twice in the previous 15 days after having his right knee drained, but refused to cite any physical issue as the cause of his meltdown. “Everything is fine. Body felt great,” Pressly said. As Sarah Langs noted, the Giants’ margin of victory wasn’t just the largest in an extra-inning game during the Manfred Man era (since 2020) — the previous record was seven runs, done three times — but it also tied a 2009 game for the largest such margin in 42 years.
| Date | Winner | Loser | Score (Innings) | Margin |
|---|---|---|---|---|
| 7/3/1983 | Rangers | A’s | 16-4 (15) | 12 |
| 7/26/1928 | Yankees | Tigers | 12-1 (12) | 11 |
| 5/15/1919 | Reds | Dodgers | 10-0 (13) | 10 |
| 6/21/1969 | Twins | A’s | 14-4 (10) | 10 |
| 7/23/1923 | Cubs | Pirates | 12-3 (12) | 9 |
| 8/5/1933* | Cleveland | Tigers | 15-6 (13) | 9 |
| 8/24/1947* | Reds | Phillies | 12-3 (10) | 9 |
| 7/8/1973** | Red Sox | White Sox | 11-2 (10) | 9 |
| 8/16/2009 | Angels | Orioles | 17-8 (13) | 9 |
| 5/6/2025 | Giants | Cubs | 14-5 (11) | 9 |
As so often happens in these situations, researching this stuff sent me down a rabbit hole, where I discovered some weirdness afoot with regards to extra-inning games. I’m not yet sure what to make of it — very possibly, it’s just another example of Small Sample Theater — but at the very least the data are worth a gander.
Through Wednesday — the cutoff for all of the data presented here except where indicated otherwise — 8.7% of all games this season had gone into extra innings, a rate that’s in line with 2021–24 rates. (I’m throwing out data from the shortened 2020 season for this whole exercise.) Nothing strange there, but take a look at what offenses have done as compared to years past:
| Season | G | IP | TBF | BF/G | AVG | OBP | SLG | wOBA | wRC+ | R/9 |
|---|---|---|---|---|---|---|---|---|---|---|
| 2021 | 432 | 535.1 | 2445 | 5.66 | .254 | .366 | .418 | .319 | 101 | 10.55 |
| 2022 | 432 | 528.0 | 2395 | 5.54 | .265 | .372 | .397 | .319 | 109 | 10.13 |
| 2023 | 402 | 495.1 | 2223 | 5.53 | .242 | .354 | .376 | .301 | 92 | 9.93 |
| 2024 | 432 | 533.0 | 2420 | 5.60 | .262 | .366 | .401 | .316 | 105 | 10.22 |
| 2025 | 96 | 123.0 | 558 | 5.81 | .244 | .381 | .354 | .306 | 99 | 9.37 |
That’s a very data-dense table even by my standards, so let me take you on the guided tour. For one, teams are facing more batters per game in extras — not a whole lot more, but the highest rate of the Manfred Man era. That’s being driven by the highest extra-innings on-base percentage of that span, offsetting one of the lowest batting averages and by far the lowest slugging percentage. The low AVG and SLG may be a reflection of the typical early-season conditions that suppress offense because balls don’t carry as much in cooler weather. So far this year, the average distance on all fly balls is 311 feet, three feet shorter than last year and five feet shorter than 2023. Comparing the data through May 7 of each season, this year’s average is one foot shorter than last year and three feet shorter than in 2023.
The other thing from that table above is that despite the higher OBP, scoring in extra innings is down, more than half a run below its lowest level during the 2021–24 span, and 0.85 runs per nine lower than in 2024 — and that’s even with the aforementioned nine-run outburst by the Giants. Comparing rates with an annual May 7 cutoff yields a scoring level of 10.14 runs per nine last year, 9.74 per nine for 2023, 12.5 per nine for ’22 (in a sample that’s about half the size of the others to that point in the calendar because of the lockout), and 10.6 per nine in ’21.
So, extra-innings scoring is down, which maybe isn’t that weird given what we know about early-season offensive conditions. But there’s another anomaly — or rather, another set of anomalies — that caught my eye as well:
| Season | K% | BB% | UBB% | IBB% | K-BB% |
|---|---|---|---|---|---|
| 2021 | 20.9% | 14.6% | 8.4% | 6.1% | 6.3% |
| 2022 | 20.8% | 14.1% | 8.2% | 5.9% | 6.7% |
| 2023 | 21.9% | 13.7% | 8.0% | 5.7% | 8.2% |
| 2024 | 20.7% | 13.1% | 7.3% | 5.8% | 7.6% |
| 2025 | 17.4% | 17.6% | 9.9% | 7.7% | -0.2% |
That’s right, in the extra-innings games through May 7, batters have walked more often than they’ve struck out. We’re talking about just 97 walks and 96 strikeouts; Wednesday’s two extra-innings games closed the gap from 96 walks and 92 strikeouts. But even if the strikeout total surpasses that of the walk total sometime soon, you can see that relative to the past four seasons, strikeouts in extras are way down, while walks — intentional and unintentional — are way up.
Particularly in the context of the current extra-innings rules, a walk is not as good as a hit. The inning-opening setup with the Manfred Man and the open base behind him increases the incentive to walk a batter in order to set up a potential double play. So far, we’re seeing groundball double plays more frequently in extras than usual — and more frequently than in innings 1-9:
Innings 1-9 vs. Extra Innings
| Season | GIDP% 1–9 | GIDP% Xtra | GIDP%X+ |
|---|---|---|---|
| 2021 | 11.6% | 6.8% | 59 |
| 2022 | 11.9% | 9.0% | 76 |
| 2023 | 11.7% | 7.9% | 68 |
| 2024 | 11.2% | 7.8% | 70 |
| 2025 | 10.5% | 10.8% | 103 |
I just created an index stat to compare the GIDP rate in extras relative to innings 1-9. That’s what the “X” is for in GIDP%X+, which looks like it could be a curse word from a comic strip. For the first time in this span, GIDP%X+ is above 100, and far ahead of the rates from 2021–24, which I would not have guessed would’ve been so low. Maybe the consensus among teams has recently shifted toward walking batters in extras to set up double plays, but I don’t know. This year’s higher GIDP rate is helping to cancel out the higher walk rate and presumably cutting into the scoring rate. But that still doesn’t explain why the extra-inning strikeout and walk rates are so out of step with those from years past.
| Season | BB% 1-9 | BB% Xtra | BB%X+ | UBB% 1-9 | UBB% Xtra | UBB%X+ | IBB% 1-9 | IBB% Xtra | IBB%X+ |
|---|---|---|---|---|---|---|---|---|---|
| 2021 | 8.6% | 14.6% | 169 | 8.3% | 8.4% | 102 | 0.3% | 6.1% | 1990 |
| 2022 | 8.1% | 14.1% | 174 | 7.9% | 8.2% | 104 | 0.2% | 5.9% | 3167 |
| 2023 | 8.5% | 13.7% | 160 | 8.3% | 8.0% | 96 | 0.2% | 5.7% | 2962 |
| 2024 | 8.1% | 13.1% | 161 | 7.9% | 7.3% | 92 | 0.2% | 5.8% | 2822 |
| 2025 | 8.8% | 17.6% | 200 | 8.6% | 9.9% | 114 | 0.2% | 7.7% | 4211 |
Look, Ma, more index stats! In this case I’ve made ones for intentional, unintentional, and overall walk rates in extra innings relative to those in innings 1-9. As you can see, the frequency of intentional walks absolutely skyrockets in extras, by a factor of over 42 this year compared to nearly 30 in each of the past two seasons. This year, we’re seeing far more of both intentional and unintentional walks, even after adjusting for the overall changes in league rates. (Strikeouts have fallen from 22.4% to 21.9%, while walks are up from 8.2% to 8.9%.) We’re also seeing lower strikeout rates:
| Season | BB% 1-9 | BB% Extra | BB%X+ | K% 1-9 | K% Extra | K%X+ |
|---|---|---|---|---|---|---|
| 2021 | 8.6% | 14.6% | 169 | 23.2% | 20.9% | 90 |
| 2022 | 8.1% | 14.1% | 174 | 22.4% | 20.8% | 92 |
| 2023 | 8.5% | 13.7% | 160 | 22.7% | 21.9% | 96 |
| 2024 | 8.1% | 13.1% | 161 | 22.6% | 20.7% | 91 |
| 2025 | 8.8% | 17.6% | 200 | 22.0% | 17.4% | 79 |
Again, I don’t know why strikeout and walk rates would converge so drastically in extra innings, but having just read Davy Andrews’ two-part series on the shrinking strike zone, I asked him to weigh in. To recap, last week The Athletic’s Jayson Stark, Ken Rosenthal, and Eno Sarris reported that over the past offseason, Major League Baseball very quietly shrank the buffer around the edge of the strike zone — which it uses in its evaluation of umpire accuracy — from two inches outside of the rulebook strike zone to three-quarters of an inch on either side. As Andrews found, so far this season we’ve seen 42.7% of ball-strike calls in the shadow zone being called strikes, a lower share than any other season of the pitch-tracking era (since 2008). As a result, umpire accuracy on balls and strikes has improved relative to the previous season, something it has done every year of that aforementioned span save for last year.
That low rate of called strikes in the shadow zone is contributing to the overall increase in walk rate and decrease in strikeout rate relative to last year. After grinding through Baseball Savant to compare the called strike rates in innings 1-9 versus extras, I took a shortcut and asked Andrews what his eyes and spreadsheets told him when it came to called strike rates and umpire accuracy.
What he found was that while umpires have been accurate on 92.6% of calls during innings 1-9, that rate climbs to 93.5% during extras, and that umpires have been slightly more likely to call balls, though over the sample of 984 pitches, that amounted to a difference of eight extra pitches. Things got a bit more interesting when the focus was confined to the shadow zone. Overall accuracy increases from 81.8% in regulation to 82.2% in extras, but the increase in balls is a bit more dramatic. Inside the zone, accuracy drops from 77.4% to 70.5%, a difference that equates to 10 strikes being flipped to balls, while outside the zone the accuracy improved from 85.5% to 90.6%, a difference of 11 strikes being flipped to balls. Those 21 pitches — in 96 team-games worth of extra innings — amount to just 6% of the total pitches in the shadow zone. Maybe there’s something small but real going on that’s helped batters disproportionately in extra innings. As Andrews suggested to me after reviewing the data: “When umpires are bearing down, they’re calling a tighter zone.”
So far, we’re about 23% of the way through the season, and statistical extremes aren’t hard to find. Aaron Judge is hitting .400, Tyler Mahle has a 1.48 ERA, the Rockies have a .171 winning percentage, and the Tigers own the best record in the AL at 25-13. All of what I’ve presented may well come out in the wash as the sample sizes increase, though I don’t think this inquiry is for naught. For one thing, learning that umpires aren’t losing accuracy in extra innings when it comes to balls and strikes is itself reassuring, and if there is a conscious decision by teams to try setting up (and executing) double plays in extra innings, that’s noteworthy, too. And if this all turns out to be statistical noise, at least we could catch another production of Small Sample Theater before it leaves town.
Brooklyn-based Jay Jaffe is a senior writer for FanGraphs, the author of The Cooperstown Casebook (Thomas Dunne Books, 2017) and the creator of the JAWS (Jaffe WAR Score) metric for Hall of Fame analysis. He founded the Futility Infielder website (2001), was a columnist for Baseball Prospectus (2005-2012) and a contributing writer for Sports Illustrated (2012-2018). He has been a recurring guest on MLB Network and a member of the BBWAA since 2011, and a Hall of Fame voter since 2021. Follow him on BlueSky @jayjaffe.bsky.social.
I wonder if some of the lower strikeout rates in extra innings can be attributed to bunt attempts. The runner on second, no outs, needing a run situation seems like it would make for high bunt rates. And bunting likely makes you less likely to strike out than a normal plate appearance.
I’m not sure I see why bunting leads to fewer Ks. To often a missed bunt attempt is a strike. The other day the leagues best bunter, Jacob Young, got to two strikes on two back to back SAC bunting attempts. he is not an easy K normally. Everyone knew he was going to Sac bunt and he was thrown stuff very hard to make contact with. He was allowed to swing the bat only after 2 strikes on the first two pitches. Also I have seen guys strike out attempting to sac bunt so many times in the past. So I would need serious data before I believe this claim!