
What Else You’ll Need Besides Spin Rate
Soon, we’ll get games on television again. I know it’s hard to believe, because it seems like it’s been so long, but it’s true. It’ll only be spring training, but it’ll be baseball and it’ll be great.
Along with these televised games, we’ll hear commentators discussing key statistics. It’s very possible that, due to the rising popularity and availability of Statcast, we’ll hear about increases in spin rate when it’s relevant. That’s great! But there will be some context we won’t hear, and that context will be important.
One bit of context comes from the concept of useful spin. We report total spin, but that’s just the spin imparted on the ball. Total spin. But spin has to be considered in the context of arm slot. Imagine trying to put backspin on a ball. The more upright your hand is on release, the more of your spin is “harvested” as backspin that’s useful to the movement you’re trying to produce; the more your arm drops down, the more that spin gets converted into useless sideways spin.
It looks like spin is inherently useful when you look at charts like this one, and I’ve heard from batters before that higher spin pitches are harder to pick up. But we haven’t yet publicly nailed the usefulness of spin by itself, at least not from the research I’ve seen. We’re working on it.
Another piece of context for spin: it’s related to velocity. It generally goes up with velocity, something Trevor Bauer discovered when he created the Bauer Unit — spin divided by velocity. You’d want to know if the pitcher who increased his spin also increased his velocity, for sure.
In fact, when you look at the pitchers that added significant spin (+10%) from 2015 to 2016, all of them but one also increased their velocity, as well.
If you agree with Arik Florimonte’s assessment that it’s more 50/50 and we shouldn’t count all of those 1.01s as velocity increases, fine. We can do this mathematically, too. And we can switch over from velocity to effective velocity, which takes into account the point from which a player releases the ball and adjusts the velocity for that release point.
The relationship of four-seam fastball spin from one year to the next is pretty strong. The r-squared is .816, meaning that last year’s spin explains about 80% of the variance in this year’s spin. If you limit it to only pitchers that have thrown 100 pitches in both years, that r-squared jumps to .851. That’s immediately stronger than any results-based pitching metric in terms of year to year stickiness.
Harness spin to effective velocity, though, and your year-to-year correlation could improve, given the correlation between velocity and spin. I found the average spin for every non-decimal effective velocity between 85 and 96, and then indexed every pitcher’s spin against that average. Justin Verlander, king of spin, produce a spin rate that was 15% better than the league average for his effective velocity bucket in 2016. Look at how strong the relationship is between this effective-velocity indexed spin rate from 2015 to 2016.
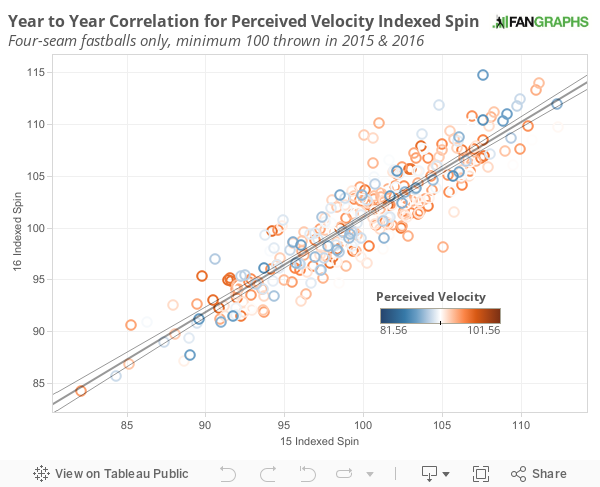
Now last year’s effective-velocity indexed spin rate explains 83.8% of the variance in this year’s number.
So which pitchers actually improved from 2015 to 2016? By this second methodology, there are nine pitchers who increased their spin more than 5%, but it’s a different set of pitchers than those cited above. These are the true outliers, although really only the first two satisfy our original requirements for significant change (10%).
| Name | 16 Indexed Spin | 15 Indexed Spin | Diff Indexed Spin |
|---|---|---|---|
| Homer Bailey | 95 | 82 | 12 |
| Kendall Graveman | 107 | 95 | 12 |
| Tyler Thornburg | 110 | 101 | 9 |
| Cody Anderson | 109 | 100 | 9 |
| Shane Greene | 109 | 101 | 8 |
| Dillon Gee | 104 | 97 | 7 |
| Xavier Cedeno | 115 | 108 | 7 |
| Rich Hill | 112 | 105 | 7 |
| Ryan O’Rourke | 97 | 91 | 6 |
| Eric Surkamp | 103 | 97 | 6 |
Indexed Spin = spin rate indexed to effective velocity
Returning to the original point of this post, we find that, if a pitcher is producing different spin rates, there are more questions you have to ask to really understand the whole context. Did he change his arm slot? Is he harvesting as much of that spin as he was in the past? Did he improve his velocity? Did he change his mechanics? Is he releasing the ball in the same space? And, even simpler, what does that spin rate change look like against league averages?
It’s okay if we don’t get the full deluge of facts every time spin rate comes up, though. There’s an ongoing battle between context and brevity when it comes to producing good sports television. Too many columns, too many stats, too much context, and you lose the viewer. Too little explanation around the story you’re trying to get across, though, and it loses some power. The number without context becomes a meaningless abstraction.
So spin rate changes? Sure. I want to know about that. I’ll also want to know a few more things.
[A data snafu with the first pull led to incorrect numbers. I’ve updated the post to reflect this fact. Thanks for pointing it out!]
With a phone full of pictures of pitchers' fingers, strange beers, and his two toddler sons, Eno Sarris can be found at the ballpark or a brewery most days. Read him here, writing about the A's or Giants at The Athletic, or about beer at October. Follow him on Twitter @enosarris if you can handle the sandwiches and inanity.
Back to back days with posts from Eno…It feels like Christmas. Excellent work, sir.
Eno, great article but I have a question concerning your methodology.
Specifically, how are you indexing spin rate against effective velo. If you are binning velocity bands, say 84.51-85.49 = 85, then it is not surprising that it boosted your YOY correlation. Binning can have that effect by a little trick of statistics rather than a real life relationship.
http://biostat.mc.vanderbilt.edu/wiki/Main/CatContinuous
Very interesting! I’ll have to read up on how to bin/index more effectively.
I am extremely skeptical that the y2y r-squared for fastball spin is as low as .375. This is one of the few stats that a pitcher has complete control over. Shouldn’t it be up around .8 or so?
I updated it with the r-squared with 100 pitches minimum in both years, but it could also be a function of scale.
I just regressed 2016 FF avg spin rate on 2015 FF avg spin rate given that the pitcher threw a minimum of 500 FF’s in each year and got an r-squared of .859122?
Weird. I get .5956r2 with those minimums. And only 118 in the sample.
Same sample size on the 500 mins, what source are you using? Baseballsavant or is that no good?
Call:
lm(formula = spin_rate ~ s_15, data = s)
Residuals:
Min 1Q Median 3Q Max
-163.188 -31.323 0.092 37.191 180.516
Coefficients:
Estimate Std. Error t value Pr(>|t|)
(Intercept) 145.67589 79.47231 1.833 0.0694 .
s_15 0.94224 0.03543 26.597 <2e-16 ***
—
Signif. codes: 0 ‘***’ 0.001 ‘**’ 0.01 ‘*’ 0.05 ‘.’ 0.1 ‘ ’ 1
Residual standard error: 51.32 on 116 degrees of freedom
Multiple R-squared: 0.8591, Adjusted R-squared: 0.8579
F-statistic: 707.4 on 1 and 116 DF, p-value: < 2.2e-16
This seems a lot more like what I would expect, thanks for running the numbers.
Re-pulled and am getting these now. Huge sigh.
That’s a bummer. At least you got it corrected, thanks for taking the time to review it!!
Not sure if anyone cares, but it turns out I had some zeroes in my data instead of nulls. Grrrrr.
I started trying to do this research myself… I took 9 pitches (FF, FT, FC, Splitter, Sinker, Slider, Curve, KnuckleCurve, Changeup) and used 2015 spin to predict 2016 spin, with a minimum of 500 total pitches in each year and a minimum 100 pitches of a given pitch. R-squared results:
FF: .8500
FT: .8473
FC: .7101
FS: .7030
SI: .7984
SL: .5295
CH: .8735
CU: .7254
KC: .8421
Sliders obviously stick out most here. Sample size on all these is different, and some probably too small to be significant (FS, KC notably).
How did you index spin rate vs. effective velocity? Just SR/EffV?
I also tried to see if these were predictive of 7 different stats specific to each pitch (like xMov, Whiff%), and got very poor predictive and correlative results. Probably because I’m using total spin and not useful spin? Also, like you mention at the end, there’s a ton of variables that go into this, so I’m not sure it’s surprising that spin rate didn’t predict these stats well.
I binned the effective velos and did an average spin rate for each bin. But with better data, there’s no effect. Sigh.
Why is horizontal spin useless? Would appear to me that run and rise are both desirable, so any spin that helps the ball move less straight would be good, no?
Horizontal spin is useless *if you’re looking to throw a riding four-seamer*. But there is always some ‘gyrospin’ or spin that is useless to the ball’s movement. Alan Nathan wrote more: http://www.baseballprospectus.com/article.php?articleid=25915
I honestly don’t get it, why not talk about pitch movement? What does spin add above that, and why is spin so hip nowadays?
With movement, more is not better. Take a good forkball. And generally “typical” motion is bad, “extreme” motion is better, but it depends on the purpose of the pitch. Can we get there with our spin talk too?
I don’t follow how more movement is bad. Did you mean it’s not *always* better?
Are we guessing someone like Pedro Martinez had an insane spin rate? And why has Pedro become fat little guy with funny hair? Just wondering about both things.