What Mike Trout Proved in May
Here’s the picture that got me interested in what Mike Trout had been up to between the end of April and the beginning of May, 2019:
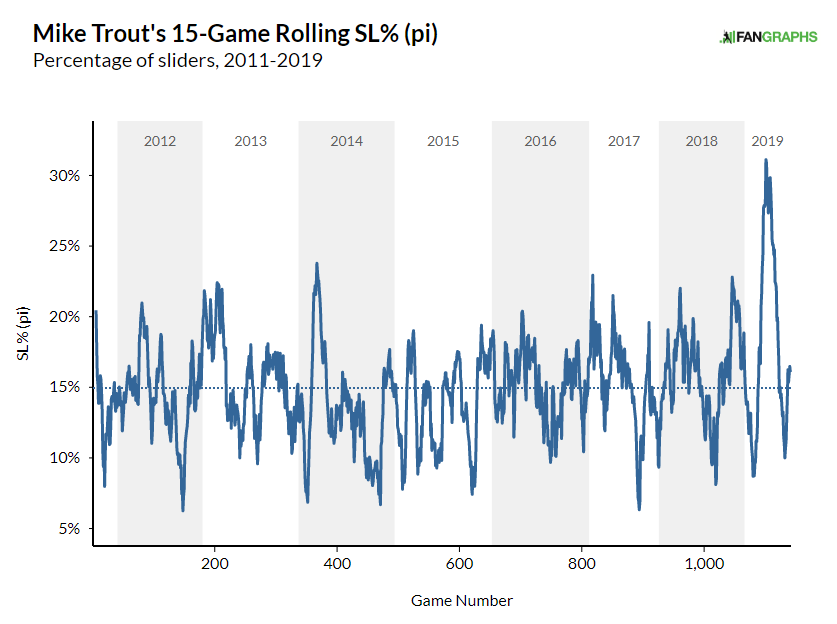
I thought a big red circle would be gauche, so I’ll write this out: Starting on April 19, the rate at which Trout saw sliders (as a percentage of all pitches seen, and as measured by Pitch Info) rose from 8.7% over the 15 games preceding that date to an astonishing 30.9% over the 15 games preceding May 11. That’s the highest such number ever observed during Trout’s eight-season career. No other period even comes close. Over the course of his career, in fact, Trout has seen sliders less than half as often (15.0%) as he did over that 15-game stretch at the beginning of May.
To some extent, this is a consequence of the schedule. Slider use is up league-wide again this year, to 18.4% from last year’s 16.9%, and from 13.7% just five years ago. Thus, my first theory of the case — the case, here, being why Trout was suddenly seeing so many more sliders than he ever had before — was that Trout had just run into a series of teams that happened to be at the leading end of the league-wide rush away from fastballs and toward sliders. In other words, that this was just a bit of random chance. Could happen to anyone. And indeed, the seven teams Trout’s Angels faced during the period from April 19 to May 11 are throwing more sliders than the league as a whole this season:
| Team | Slider% in 2019 |
|---|---|
| Royals (1st) | 26.5% |
| Tigers (2nd) | 22.6% |
| Yankees (5th) | 21.4% |
| Astros (7th) | 21.0% |
| Orioles (9th) | 20.8% |
| Mariners (14th) | 19.0% |
| Blue Jays (16th) | 18.5% |
| Teams Trout Faced | 21.4% |
| Teams Trout Didn’t Face | 17.3% |
Further to the point, it wasn’t just Trout. Three other Angels who got consistent plate appearances during this period also saw more sliders than usual while facing these teams: Brian Goodwin from 13.2% in the 15 games before April 19 to 17.0% in the 15 before May 11; Tommy La Stella from 8.5% to 18.1%; and Andrelton Simmons from 20.1% to 30.6%. Taken collectively, the Angels as a team jumped from seeing sliders 12.4% of the time (before April 19) to 21.1% of the time (from April 19 to May 11). So here’s the picture that’s emerged so far: During the last part of April, the Angels faced a series of unusually slider-prone teams and, at the same time, their hitters (including Trout) began seeing substantially more sliders than before.
But that picture leaves a couple of blank spaces. First, it’s not just that the Angels ran into slider-happy teams and got the same amount of sliders you would expect from those teams, given how often those teams throw sliders in general. Careful readers will note that both Simmons and Trout saw their slider percentages jump up above 30% — well above the average rate at which even the most slider-happy team, the Royals, was throwing the pitch (26.5%). That suggests that these teams were, to some extent, choosing to throw more sliders than usual against some Angels, or in any event that they did. The second blank space has to do with the consequences of this spike. What happened once the Angels started seeing all these new sliders?
Let’s start with the first gap. I have a simple theory about why teams suddenly started throwing an awful lot of sliders against the Angels in late April, which is that the Angels had put up pretty bad numbers against that pitch through that date. The table that follows shows two statistics for all Angels hitters — the run value achieved on sliders per hundred sliders thrown (wSL/c) and the percentage of sliders thrown — in three periods: Opening Day to April 18, April 19 through May 11 (the period during which Trout saw that crazy spike), and May 12 through the present:
| Period | wSL/c | SL% (pi) |
|---|---|---|
| Open – 4/18 | -1.39 (27th) | 12.4% (30th) |
| 4/19 – 5/11 | -0.87 (20th) | 21.1% (4th) |
| 5/12 – Present | -0.60 (21st) | 16.9% (26th) |
The major task set before big league pitchers is to get big league hitters out. That means that when a team puts up poor numbers against a particular pitch, as the Angels did against sliders in the early part of this season (remember, their performance against the pitch was fourth-worst in the league), you’d expect that team to see an awful lot of that pitch going forward. That goes double when the pitchers in question already have a tendency to throw sliders more often than average. This league gives you the same thing over and over again until you prove that you can handle it. I think that Mike Trout and the rest of the Angels saw more sliders in late April and early May because, until then, they hadn’t proved they could hit them that well. Once they improved their performance against the pitch, which they did, the percentage of sliders they saw dropped back off to the 16.9% they’ve seen since May 12. But how did they improve their performance?
You could answer that question a different way for every Angels hitter, because every hitter is different, but I want to examine it for Trout for two reasons. One, his spike was the most dramatic — from below 9% to above 30%. You’ll remember that from before. And two, he’s the best player in the world. It’s interesting to see what he does when faced with something new. And what did Mike Trout do, when pitchers started feeding him a steady diet of sliders? Why, he started swinging at them — and doing damage when he did:
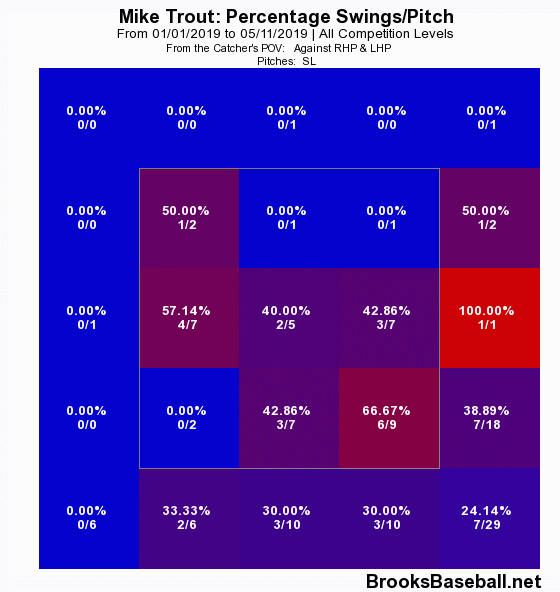
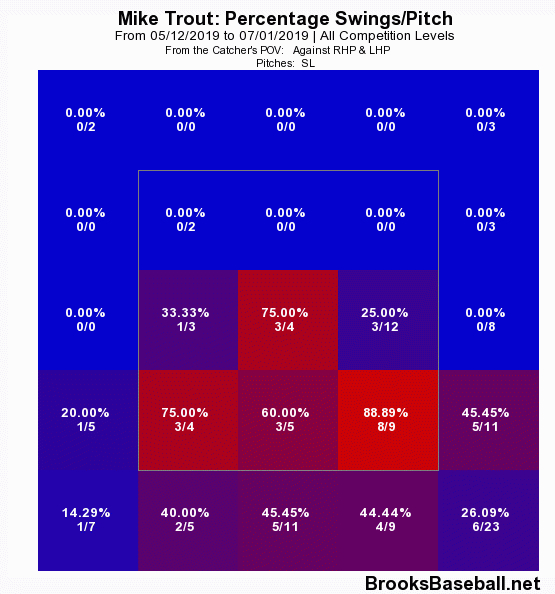
Trout has never really offered all that much at sliders down and away, which is where he got most of his sliders in 2019 before mid-April — that’s the very bottom right corner of both images above. Between the beginning of the season and May 11 (which is when the slider rate against him started going down, in light of his improved performance against them), Trout offered at sliders down and away 24% of the time. Since May 12, that rate has ticked up only ever-so-slightly to 26%. No real change there, and why would there be? Sliders that far out of the strike zone aren’t particularly tempting targets. Mike Trout is a disciplined hitter and he knows what he doesn’t want to chase after.
Sliders just a little bit higher up and closer in, though, are much more interesting from a hitters’ perspective. And what has gone up dramatically, and indeed did so increasingly after Trout started getting a steady diet of sliders in the strike zone, is Trout’s willingness to take a swing at sliders in the bottom third of the strike zone. Before May 12, he offered at such pitches just 50% of the time, presumably willing to wait for other, more hittable pitches he knew might be coming later. Since May 12, when those pitches started disappearing in favor of more sliders? His swing rate on those low sliders is up nearly thirty points to 78%. And two of those pitches in the bottom right-hand corner of the strike zone, the corner at which he’s swung at 8 of 9 sliders he’s seen since May 12th, have turned into home runs. Mike Trout got more sliders, and he turned two of them into home runs. That’s how you change a pitcher’s mind.
Baseball is full of these little challenges, played out over a few weeks, a few days, or maybe even a few pitches, over and over again over the course of a single season. This one played out from the end of April to the middle of May, 2019. The league saw that the Angels were struggling against sliders, and threw more against them. The Angels, led by Mike Trout, proved they could hit them a long way when tested. The league stopped throwing quite as many shortly thereafter. On to the next thing. Back and forth, back and forth. Same as it ever was.
Rian Watt is a contributor to FanGraphs based in Seattle. His work has appeared at Vice, Baseball Prospectus, The Athletic, FiveThirtyEight, and some other places too. By day, he works with communities around the world to end homelessness.
Perhaps there is a secret forum that non-Angel pitching coaches participate in where they can crowd test theories on pitching to Mike Trout.
maybe they have an app where they crowdsource vote the pitches.