What’s Going On, Michael Pineda?
Michael Pineda is having a hard time right now. Not when it comes to plate appearances ended by the umpire — his strikeout minus walk percentage is 21st in the big leagues, just ahead of Jake Arrieta’s. Usually that’s good enough, since K-BB% was once shown to be the best in-season predictor, and because it’s hard to be bad if you’re striking a bunch of guys out and not really walking anyone.
Usually. But not right now. Not in the Bronx, at least. Because, since 2000, nobody has recorded a K-BB% over 15% (Pineda is at 17.7% currently) and suffered from a worse batting average on balls in play. Nobody has allowed more homers per nine innings in that group, either. After contact, the ball has not been Pineda’s friend.
Still, we might just chalk it up to luck and call it a day. We might, if it wasn’t so obvious from watching Pineda that he’s having trouble with command and that things aren’t quite right.
The homers are the most obvious thing. You might think a guy with mostly just a fastball and a slider would have troubles with lefties. He’s given up eight homers to righties against three to lefties, in similar samples (112 lefties faced, 136 righties). So it’s not just a bunch of hanging sliders to lefties.
Let’s try and blame a pitch. Maybe one of these is worse than the others.
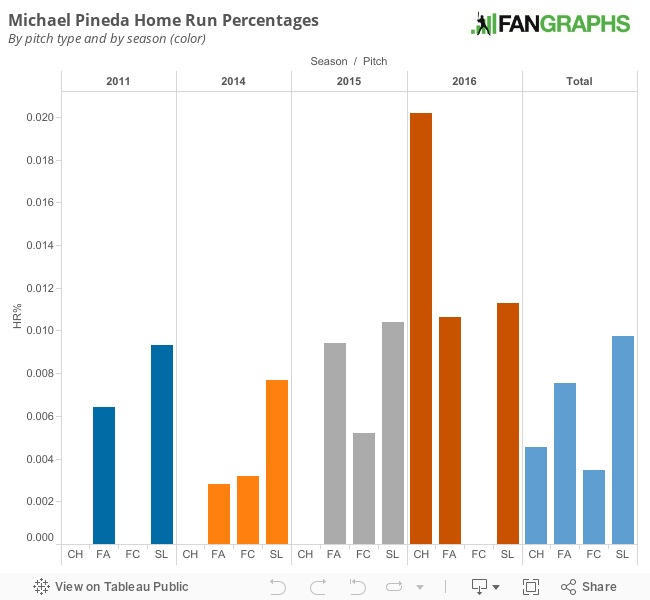
That one really leaps off the page at you, huh? The changeup! He’s never given up a home run on the changeup before this year. He’s given up… (scans the page)… two this year! Take those two homers out and he’s giving up 1.5 homers per nine. Huh. Even though he hasn’t trusted his change as much this year, that can’t be it.
Command still seems important here. If only it weren’t the hardest thing to quantify. Bill Petti’s Edge% shows that, currently, Pineda is throwing fewer balls in the heart of the zone than ever before. But his overall zone percentage is also the lowest he’s ever recorded, so he’s throwing more non-competitive pitches.
How about hanging breaking balls? I developed a few measures to try and quantify breaking-ball command for The Hardball Times Annual last year. I looked at average height in the strike zone and average drop for curve balls in one-strike counts. In those counts, pitchers most likely want a swing and a miss, so it seems most fair to judge those breaking balls by how low in the zone they cross the plate, and how much drop they have.
| Year | Average Height | Average Drop |
| 2015 | 1.87 | 0.62 |
| 2016 | 1.55 | 0.89 |
Pineda’s slider is the tiniest bit flat this year. But he’s also burying them, nearly a full four inches lower on average. There’s no smoking gun here.
If it’s not one pitch, perhaps it’s all of them? Strangely, Pineda’s vertical release point is the highest of his career and he’s seeing the worst drop of his career on all of his pitches. Maybe not so strangely — we know there’s a relationship between arm angle and rise, so basically he’s getting more rise on his pitches, and it’s not working out to his advantage. He did lose some cut on his breaking pitches, but has righted the ship on that front to some extent.
Is it something we can see with our eyes? Here’s a still upon (fastball) release from last year (left) and this year (right). Doesn’t seem very different.

To sum up so far, Pineda’s relationship of strikeouts to walks is about the same as it’s been previously in his career. That relationship is in good shape. He’s been getting spanked on balls in play, and subjectively, the command looks off, but none of our metrics for command tells us much. His breaking ball is moving about the same as usual and crossing the plate lower than usual, and he’s missing the heart of the plate more than usual, not the sort of indicators you normally associate with poor command.
What we can say is that he’s not getting the ball in the zone as much, his arm angle is a little different, and his stuff is the tiniest bit flat this year. Looking at the non-competitive pitches — a pitch more than 2.5 feet from the center of the zone per the working definition August Fagerstrom used for a post this past November — he’s throwing 1.8% of his pitches in the non-competitive zone, mostly on the plate or in the dirt this year, compared to 1.0% last year.
So yeah, the sliders are a bit flat and he’s burying too many of his pitches in the dirt. This sounds a lot like what we discussed last week with Matt Harvey.
There’s no indication that any of these things are flaws Pineda can’t correct. As much as it seems impossible, the facts remain that Pineda is still getting the whiffs, not walking the ballpark, and not showing signs of injury. It might even be a matter of confidence — get hit around a little and you will probably finish some of your sliders so hard that they bounce on the plate. Whatever it is, the fix will probably be less drastic than the (seeming) problems.
With a phone full of pictures of pitchers' fingers, strange beers, and his two toddler sons, Eno Sarris can be found at the ballpark or a brewery most days. Read him here, writing about the A's or Giants at The Athletic, or about beer at October. Follow him on Twitter @enosarris if you can handle the sandwiches and inanity.
As a season long Pineda holder in fantasy, this has been a true test of believing in the advanced metrics and looking results square in the face, screaming “HES SO MUCH BETTER THAN HIS RESULTS INDICATE!!!”
I am pleased to find that the more scrutiny he gets, noone can find the “smoking gun” to his horrible results. He gets whiffs and doesn’t walk a lot. He has the 2 “underperformance 101” marks of a low LOB% and a sky high BABIP. The only thing I find that concerns me is his avg exit velocity and vertical angle are much worse this year. Per the xOba sheet that Andrew P. puts out, 2015 Pineda had an avg exit vel of 88.1 w an avg vertical angle of 6.5. 2016 pineda has an avg exit vel of 91.4 with an avg vertical angle of 11.2.
This reminds me of Brandon Mccarthy last year (whom I also owned). Great stuff. Great periphs, but when he gets hit, they go for damage. I remember Mike Pod beating his fist on the table last year that McCarthy was merely unlucky and HR/FB wasn’t a skill. I wonder if there is a major difference between Pineda 2016 and McCarthy 2015 that I am missing, or if both are the same type of player. If the same, the million dollar question is luck or variable unaccounted for in all advanced stats modeling of how pitching should go.
Looking at his pitch values, his FB is getting crushed. Is he not pitching it high enough?
2015 FF averages
Velocity 93.35
Spin Rate 1409
pfx_x x pfx_z -1.65 x 6.7
pz 2.63
2016 FF averages
Velocity 93.74 (Faster)
Spin Rate 1811 (Lot more spin)
pfx_x x pfx_z -2.45 x 8.55 (More fade and rise)
pz 2.34 (lower in the zone) (Is THIS the problem? a fastball like his with good spin and rise should be high in the zone as this site CONSTANTLY advocates)
He went from really low spin rate and good sink for a four-seam fastball to one that has average rise (9 is average rise for a four-seamer) and closer to average spin. But those are PFx spin rates, which I wouldn’t use. IN general, his fastball went from having good sink to having average sink/rise, and that’s not good. But all his pitches are a little flat, probably due to the new release point, as small as it seems.
Thanks Eno,
Funny how he was throwing his low spin sinking FF high in the zone in 2015 and his higher spin riser low in the zone this year….
Sounds like the vertical release point is a big tell. Thanks for pointing that out
Great work as usual
Where are you getting these pz numbers and what does pz stand for?
Pz is height in zone.
https://fastballs.wordpress.com/2007/08/02/glossary-of-the-gameday-pitch-fields/
baseball savant was where I was pulling the pitchfx data from
Will he ever be able to manage contact though? He hasn’t done it his whole career since his rookie season. Seems to be a very similar thing for Matt Moore, too many gophers.
I don’t think he has to ‘manage contact’ to not be this bad. Tons of Ks, not many BBs, and one homer per nine would still be below average contact management for his skill set, but he’d be a pretty good pitcher.
One thing about Pineda is that he seems to pitch much worse from the stretch than he does from the windup. Consequently he has innings where he looks great, however sometimes a bad luck bloop hit will turn into multiple runs.
Something I noticed watching him on gameday the last start is that he’s pitching low in the zone, over and over, stubbornly against everybody even if the hitter’s gameday “heatmap” shows them as a good low-ball hitter. His fangraphs heatmaps confirm he’s working low in the zone a lot.
Looking at pitch f/x he in previous years got a fair sink on his fastball and this year it’s got a very average rise. My theory he’s trying to pitch like a groundball pitcher, but his fastball is no good for it, it never falls out of the zone and hitters are just sitting on it. He’s not really changing their eye levels or challenging hitters in their weak spots.
This is some armchair quarterbacking here, but I think with Pineda’s deadly sliders and changeups, now the extra (but average) rise on his fastball, he needs to go back to his 2014 form, say screw the groundball rate, try to blow the fastball by guys high tight and stick to the slider whenever he needs a groundball.
This works with what I found, and I think I agree with it!
I second (Third) that analysis! Get Larry Rothschild on the phone!!
http://www.brooksbaseball.net/velo.php?player=501381&b_hand=-1&gFilt=&pFilt=FA|SI|FC|CU|SL|CS|KN|CH|FS|SB&time=month&minmax=ci&var=vloc&s_type=16&startDate=03/30/2007&endDate=06/02/2016
More quantifiable evidence to back your claim
Look at the hard stuff’s vertical location…. all low… when he was really good… all high
http://www.fangraphs.com/graphs.aspx?playerid=5372&stat=hr9&time=game&split=base&ymin=&ymax=&legend=&start=2011&end=2016&rtype=mult>1=15
His HR/9 really shot up in middle of 2015
Look at the brooks baseball link above… when did he start going lower and lower with his hard stuff? middle of 2015.
Correlation does not imply causation, but it all certainly makes a lot of sense to me.
Your final comment is interesting (re: corrrelation and causation), because you are right that it is actually possible that giving up some dingers scared him into pitching lower in the zone (where he may be less effective).
Really makes me wonder if some pitchers, even at the MLB level, still have it ingrained in their heads that high fastballs are bad.
Its been shown over and over that high and hard can be very effective for popups, weak fly balls, and swings and misses but could some pitchers (and catchers and/or pitching coaches as well?)still be ignorant of modern metrics and just be going out there with a little league mentality of KEEP THE BALL DOWN?
It would be kind of hard to believe, but but then again, maybe not.
I think this is a good question as the general consensus seems to be that pitches up in the zone are bad and in general pitchers are taught to pitch low in the zone. I can’t remember if it was Curt Schilling, Rick Sutcliffe, or Orel Hershiser that said this, but during a game they remarked at how well a pitcher executed high fastballs outside of the zone with two strikes. They said that this was an underappreciated skill because (as they put it) to throw a chest high fastball requires “bad” mechanics. Basically, they said, that pitchers are trained to work down in the zone, and to consciously pitch up in the zone requires a departure from their ingrained mechanical throw.
Thus, to your point, I see two possible explanations that are not necessarily mutually exclusive: (1) pitchers really do believe that high fastballs are bad, and make a conscious decision to throw a sub-optimal amount of high fastballs. (2) Pitchers realize that not all high fastballs are bad, but they don’t trust themselves to depart from their mechanics to throw high fastballs and/or believe that their ability to locate pitches low in the zone can still beat a good low-ball hitter (similar to a football team oriented on a strong running game believes they can still run the ball 40 times a game against the league’s best run defense).
So, the answer isn’t in the emerging crude metrics. How can this be possible? I find it fun to watch people try to explain the outcomes and the ensuing confusion that comes with it. Perhaps someday someone will find the “missing link” stat but I wouldn’t hold my breath. It is a game played by humans, which seems to get lost.
Are you lost?
Humans, goats, robots…. they are acting in discrete intervals that can be quantified. Just because we haven’t quantified everything and determined a total unified field theory of baseball doesn’t mean it is some random soup of human whimsy. Also… are you lost?
Not even sure that got lost. Eno talked about confidence as a potential issue. But he isn’t getting hit hard because he is not confident. He is getting hit hard because something is wrong with his pitches and a lack of confidence may be what is causing that something to be wrong.
Question: can we look at the counts that he’s been having to see if maybe he’s falling behind in the count more, where hitters are laying off pitches out of the zone early in the count, forcing him to throw a more hittable pitch when the batter is ready for it? I may be way off base, but it would be interesting to have this data.
I did find something of a difference in slider location with runners on: http://www.fangraphs.com/blogs/instagraphs/a-michael-pineda-update/
His fb does not have the same cut it used to have, at least not early on and not consistently. I also wonder if he is not tipping pitches
Really makes me wonder if some pitchers, even at the MLB level, still have it ingrained in their heads that high fastballs are bad.
Its been shown over and over that high and hard can be very effective for popups, weak fly balls, and swings and misses but could some pitchers (and catchers and/or pitching coaches as well?)still be ignorant of modern metrics and just be going out there with a little league mentality of KEEP THE BALL DOWN?
It would be kind of hard to believe, but but then again, maybe not.
Sorry for the double post. Didnt realize that the new discussion software initially displays a reply at the very top of the comments. Guess it also does not block double posts.
Okay, so just spitballing here, but I did notice one small thing in that picture of his arm angle. If you look at his landing foot, it does seem to be more to the left in the picture on the right. Maybe he’s throwing less across his body and therefore hitters are seeing his pitches better? That could also explain why he’s had more trouble with righties. Also, and now I’m really going out on a limb, but that could be changing how he’s throwing his cutter and taking away some of the movement.
Thats a good observation but i think it has to do with where the catcher is setup. His foot goes with the catchers glove. I’d like to see his foot placement on two outside pitches or two inside pitches.
Also saw this. If he’s falling away less, that might contribute to less movement on his stuff. Would also explain higher vertical release despite same body angle – it’s the pitcher in total who is differently tilted.