
Which Batter Hits the Ball to Their Own Position Most Often?
Which players most often hit the ball to the positions that they themselves play when they’re in the field? It’s a simple question, but it also begs larger, murkier philosophical questions. Is hitting the ball to your own position the height of baseball narcissism? Or is it that hitting the ball to your special spot just feels right? Maybe the batter just stands at the plate, surveys the great green-and-brown expanse before them and gets overwhelmed. “What shall I do?” they ask themselves as the pitch clock ticks down and the hot dog vendors emit their indecipherable warblings. Then they see an oasis of familiarity, the one patch of earth that has welcomed them through a lifetime of baseball-related activities. Hitting the ball there just might feel like coming home. “I know just what I’ll do,” they think, twisting their gloved hands against the handle of the bat. It is their pen, and with it they will write what they know.
So who does that the most? Before I dug into the numbers, I put the question to my colleagues. None of us got it right. I thought I was pretty clever by picking Steven Kwan. He’s a contact maven who specializes in dumping the ball into left field, a position famously played by none other than multiple Gold Glove winner Steven Kwan. I felt all the more clever when Ben Clemens picked Kwan, too. We were wrong. So were Jon Becker, who picked Bo Bichette, Jay Jaffe, who picked Luis Rengifo, and Jake Mailhot, who picked Nico Hoerner. None of the players we picked was even at the top in his respective position, either on a counting basis or a rate basis.
David Appelman graciously took a break from keeping FanGraphs running and pulled a spreadsheet containing every ball in play from the 2024 season. It was broken down by batter, the position they were playing, and the position to which they hit the ball. That way, I didn’t just have to see who hit the most balls to their primary position. I could see who hit the ball to whatever position they happened to be playing each time they stepped to the plate. So utilityman Willi Castro got credit for the 14 balls he hit to second as a second baseman, the two balls he hit to third while playing third, 12 balls to shortstop, and 13 each to left and center. I deleted all rows where the batter was listed as a DH or a pinch-hitter, and I set a cutoff of at least 180 total balls in play, which left a pool of 260 players.
Kwan turned out to be the best guess of the bunch. His 77 balls to left field ranked 10th in terms of raw numbers. That was 19.6% of his total balls in play, which ranked 27th. Both were the highest ranking of all our guesses. That Ben Clemens sure is smart.
On a rate basis, as you’d expect, the bottom of the list was all catchers. Nobody ever wants to hit the ball to the catcher. Nobody ever comes up to the plate and says, “You know what I’d like to do? I’d like to stand here in front of 35,000 screaming fans, take a mighty cut, and launch the ball about 2 1/2 feet.” No one hits the ball to the catcher all that much unless they’re bunting – in recent years, bunts have made up roughly 12% of all balls hit to the catcher – and nobody wants molassessy catchers bunting very much.
Of the 33 players at the very bottom of the list, 32 were catchers. Ben Rortvedt, Gabriel Moreno, and Tyler Stephenson tied with a nice, round total of zero balls to the catcher over 1,122 combined plate appearances. As Stephenson led the trio with 464 PAs as a catcher, he’s the true loser of our contest, and I absolutely mean that as a compliment. In fact, over his entire career, he is credited with hitting just one ball to the catcher. Behold the rarest jewel in Stephenson’s sparkling crown.
But I said 32 out of 33, right? Who was the one position player who hit the ball to his own position less often than any catcher? That would be Rhys Hoskins, who hit just six balls to first base over 362 plate appearances and 192 balls in play while playing first, for a 3.1% rate. As a right-handed power hitter who has always been near the top of the league in pull rate and near the bottom in groundball rate, Hoskins earned his spot as the only non-catcher below a catcher. But he’s also there because of the extreme tendencies of the one catcher who managed to sink beneath him. Nick Fortes hit the ball to the opposing catcher nine times last season. He bunted once and hit one swinging bunt for a single, but he surpassed Hoskins because he has one very particular talent, and it’s not a particularly desirable talent. He’s really good at hitting the ball straight up in the air.
Fortes popped out to the catcher seven times in 2024. On a per batted-ball basis, that was just as many as Anthony Santander, who was, as we all know, cursed long ago by the god of foul popouts.
So if we start from the bottom of the list, we have catchers, then right-handed first basemen. Next come pull-happy second basemen like Zack Gelof and Jose Altuve, then we get some left-handed-hitting third basemen and shortstops entering the mix. Maybe you’ve noticed that there’s a group I haven’t mentioned yet.
That’s right, no outfielders. Of the bottom 102 players on the list, 101 are infielders and catchers. Of the top 50 players, 47 are outfielders. The main lesson I learned from this very scientific exercise is that we really underestimate how often the ball gets hit to the outfield. I think the disconnect comes in part because of the way these things are measured. If a balls sneaks just past a diving shortstop and into left field, you or I might consider it to be a ball hit to the shortstop, but it will go down as being hit to the left fielder. On the other hand, if the ball just sneaks past the left fielder, either they or the center fielder will be the one who ends up chasing it down and retrieving it from the warning track. That may be the reason so many of us unwisely chose infielders, but it’s not the real driving force behind the supremacy of the outfielder.
The driving force is that major leaguers just hit the ball to the outfield a lot. Last season, 38.1% of batted balls were fly balls and 19.6% were line drives. Now add to that the percentage of popups that make it deep enough to be caught by outfielders and the percentage of groundballs that really are blasted straight through the infield. It’s not an overwhelming majority, but any way you slice it, most balls in play go to an outfielder. That slight advantage is compounded because there are four main infielders and only three outfielders. Each outfielder is getting a larger share of that larger pie. Back in little league, you put your best defender at shortstop because that’s where the ball usually went. The best defenders are still playing shortstop in the majors because it’s the toughest position, but if teams decided to put the best defenders where the action was, they’d all be in center field.
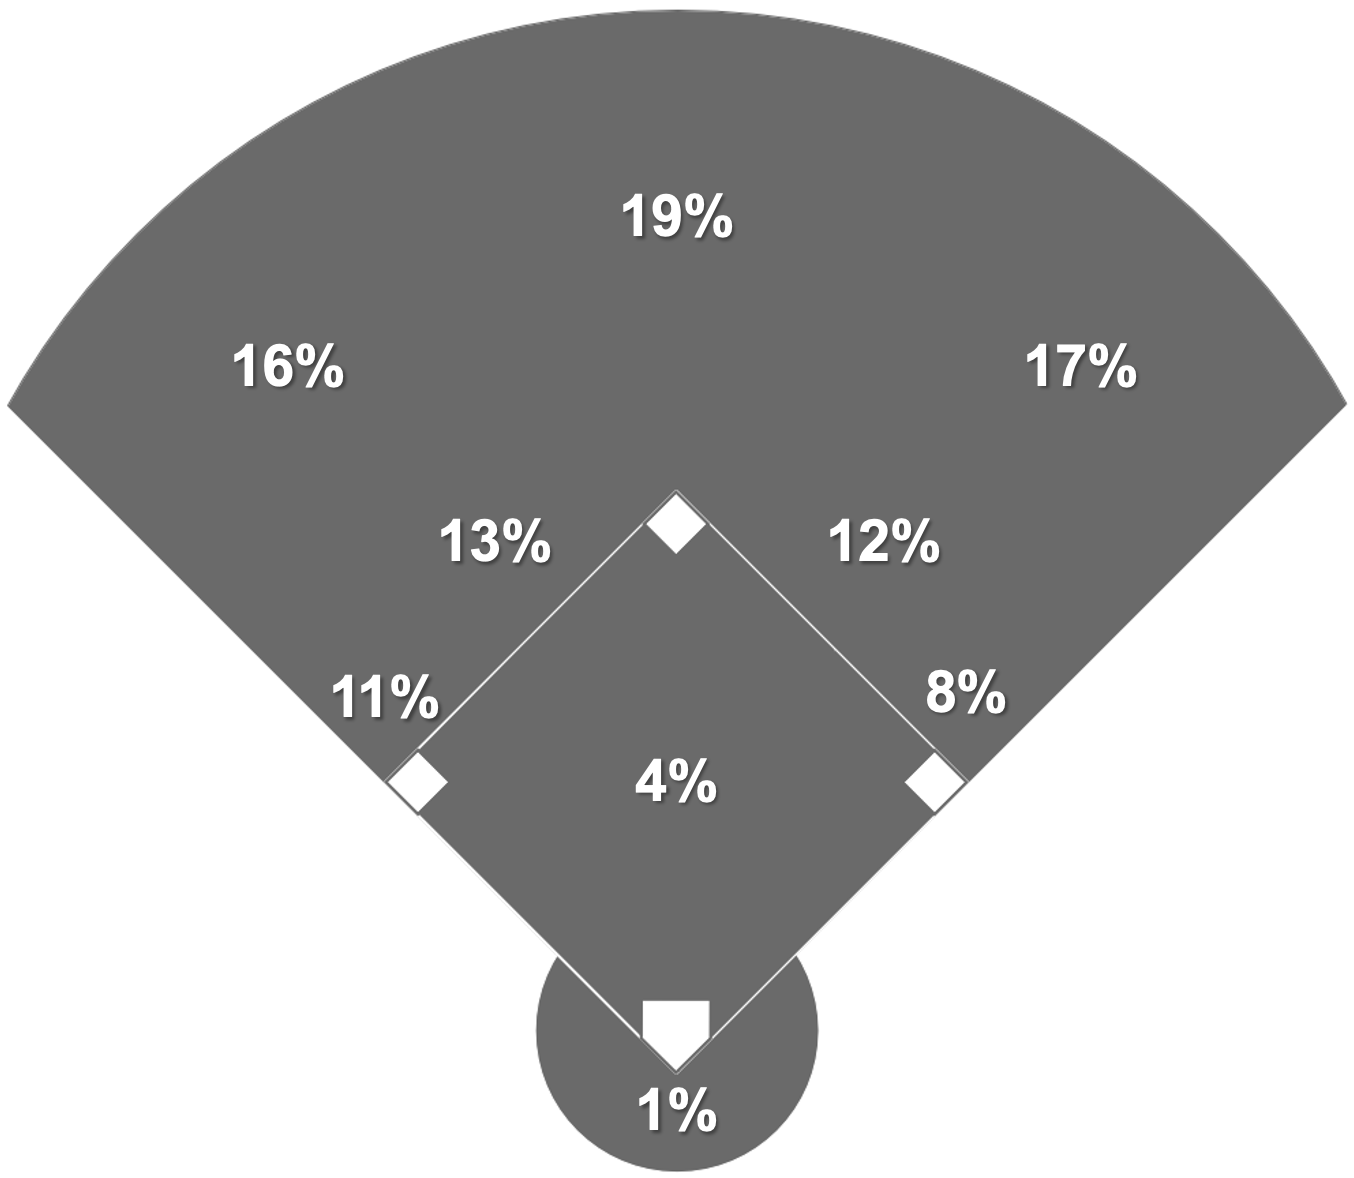
Above is the overall distribution breakdown of all balls in play, and please note that I am aware that the numbers add up to 101%. This is because of rounding. And also because here at FanGraphs, we want you to get your money’s worth or something. Add it all up, and outfielders are listed as the primary fielder for just under 52% of all balls in play.
The order above translates directly to our list. I took our list of 260 players, ranked them by their percentage of BIP hit to their position, then calculated the average rank for each position. The order is the exact same: center field first, right field second, and so on. So while handedness and batted ball profiles are important in determining where players rank within their positional cohort, they’re still very bound by their position. There just isn’t such a thing as a first baseman who is constantly hitting the ball to first base or a center fielder who never hits it to center. If you don’t hit the ball to the outfield, you’re never going to play in the majors. (But shoutout to Vidal Bruján for trying; he somehow hit just 17.1% of his batted balls to the outfield, the lowest mark in the game.)
| Position | Rank |
|---|---|
| Center Field | 56 |
| Right Field | 62 |
| Left Field | 70 |
| Shortstop | 127 |
| Second Base | 135 |
| Third Base | 161 |
| First Base | 186 |
| Catcher | 244 |
The top of the list is a mix of all three outfield positions, because there’s some give and take there. Center fielders are highest simply because everybody, including center fielders, hits the ball to the center fielder a lot. Center field is big, and center fielders get to go after everything. Corner outfielders are close behind them because they’re usually sluggers who tend to pull the ball in the air a lot, which means they’re sending the ball into a corner. Middle infielders come next, with shortstops slightly ahead of second basemen because infielders (and humans in general) are more often right-handed. Last come third basemen, first basemen, and catchers.
Alright, it’s finally time. Which players hit the ball to their own position most frequently? Let’s start with the top 10, both overall and on a rate basis. I think three players have a legitimate case to be our grand champion. BTP stands for Balls to Position, because I really couldn’t think of a snappy name for hitting the ball to your own position. (That’s not entirely true; I did think of one catchy name, but it was wildly inappropriate.) On the left are the leaders per balls in play (that is, the leaders in BTP-per-BIP), and on the right are the players who racked up the most total BTP.
| Player | Pos | BTP | BTP% | Player | Pos | BTP | BTP% | |
|---|---|---|---|---|---|---|---|---|
| Wilyer Abreu | RF | 63 | 24.6 | Jarren Duran | CF | 115 | 23.3 | |
| Brandon Marsh | LF | 61 | 24.6 | Anthony Volpe | SS | 100 | 21.1 | |
| Parker Meadows | CF | 44 | 23.5 | Jackson Merrill | CF | 97 | 22.5 | |
| Jarren Duran | CF | 115 | 23.3 | JJ Bleday | CF | 90 | 21.5 | |
| Andy Pages | LF | 65 | 23.1 | Alex Verdugo | LF | 88 | 19.0 | |
| Jackson Merrill | CF | 97 | 22.5 | Orlando Arcia | SS | 84 | 20.4 | |
| Mike Yastrzemski | RF | 62 | 22.3 | Jeremy Peña | SS | 84 | 17.3 | |
| Max Kepler | RF | 59 | 21.9 | Nick Castellanos | RF | 83 | 19.2 | |
| Jose Siri | CF | 47 | 21.8 | Brandon Nimmo | LF | 81 | 21.1 | |
| Aaron Judge | CF | 52 | 21.8 | Steven Kwan | LF | 77 | 19.6 |
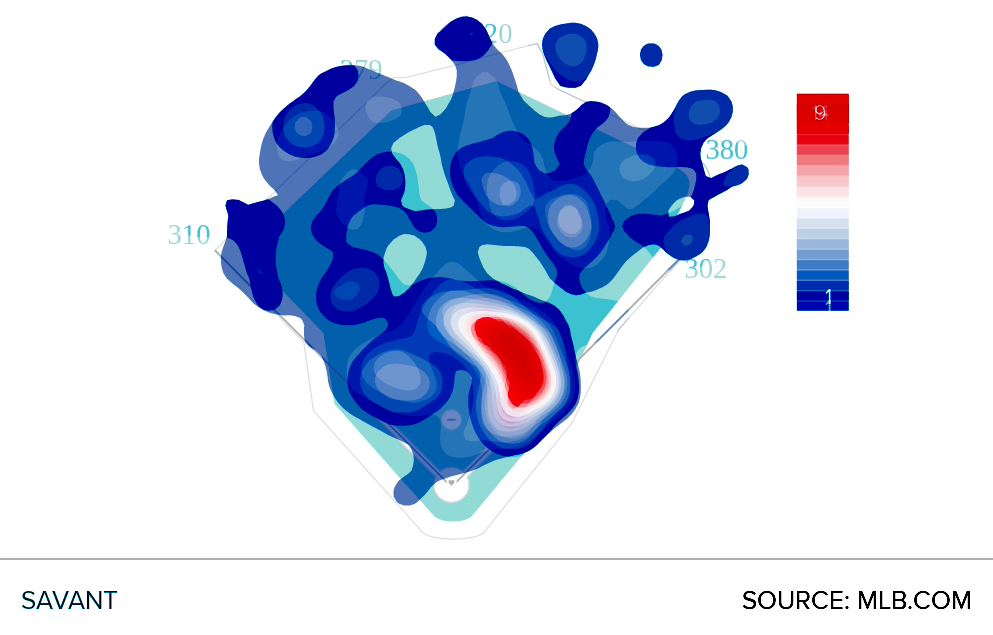
I wouldn’t fight you if you decided that Jarren Duran should be the real winner. He’s the only player on both lists, with 115 balls to his position and a 23.3% BTP rate. He hit 55 to left field as a left fielder, and 60 to center while he was filling in for Ceddanne Rafaela (who was filling in for Trevor Story at shortstop). Only one other player even reached triple digits. Seriously, look at this spray heat map. Duran rolls over plenty of pitches, but when he’s putting it in the air, he’s putting it anywhere but right field.
Duran was so far in front because he combined volume with excellence. He led off for the Red Sox and played nearly every game, leading the league in plate appearances, at-bats, doubles, and triples. He was constantly hitting gappers and knocking extra-base hits either off the Green Monster or into the Fenway Triangle. We shouldn’t necessarily dock him for relying more on volume than rate, but it’s worth considering that although he finished fifth overall in BTP rate, he wasn’t even in first place on his team or at his position. He’s not a slam dunk.
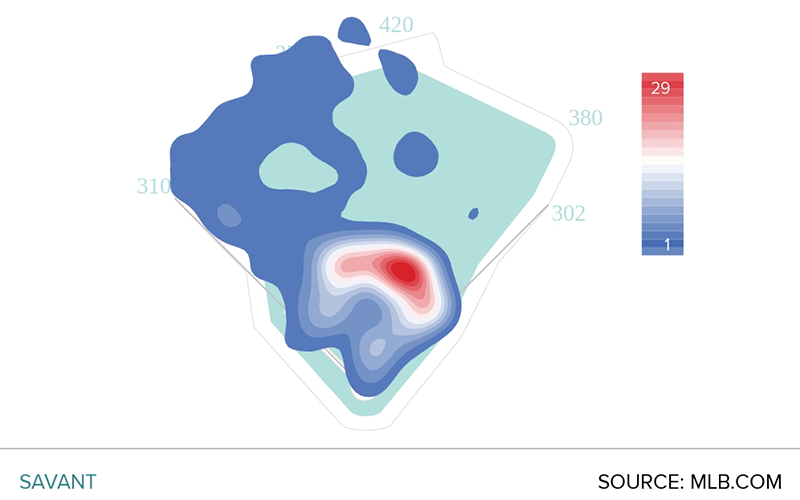
On a rate basis, the top of the leaderboard is very nearly a dead heat, but Wilyer Abreu came out slightly on top; he hit 24.61% of his batted balls to his position, just one hundredth of a percent above Brandon Marsh at 24.60%. In other words, if you round up, both players hit a quarter of their balls in play to their own position. Still, Abreu spent nearly all of his time as a right fielder, so being a pull- and lift-heavy left-handed hitter worked just fine for him. Just as the Monster helped Duran put up big numbers in left field, Fenway’s spacious right field probably cost Abreu some home runs that instead went to the right fielder. But Abreu really racked up the balls to his position by blasting balls through the right side. Below I’ve combined two heat maps for his 2024 season. On the bottom are all of his batted balls, and on top are his base hits. In Photoshop, I used the combine feature in order to heighten the color intensity in the areas where they overlap.
Abreu hit plenty of balls into the right field gap and ripped a whole lot down the right field line, but look at that nuclear red spot behind the infielders on the right side. He grounded out to second base a lot, but he also blasted tons of hits right by the first baseman and the second baseman. His bedtime routine should have an extra hour built in just so that he can thank every god he can think of for the shift ban.
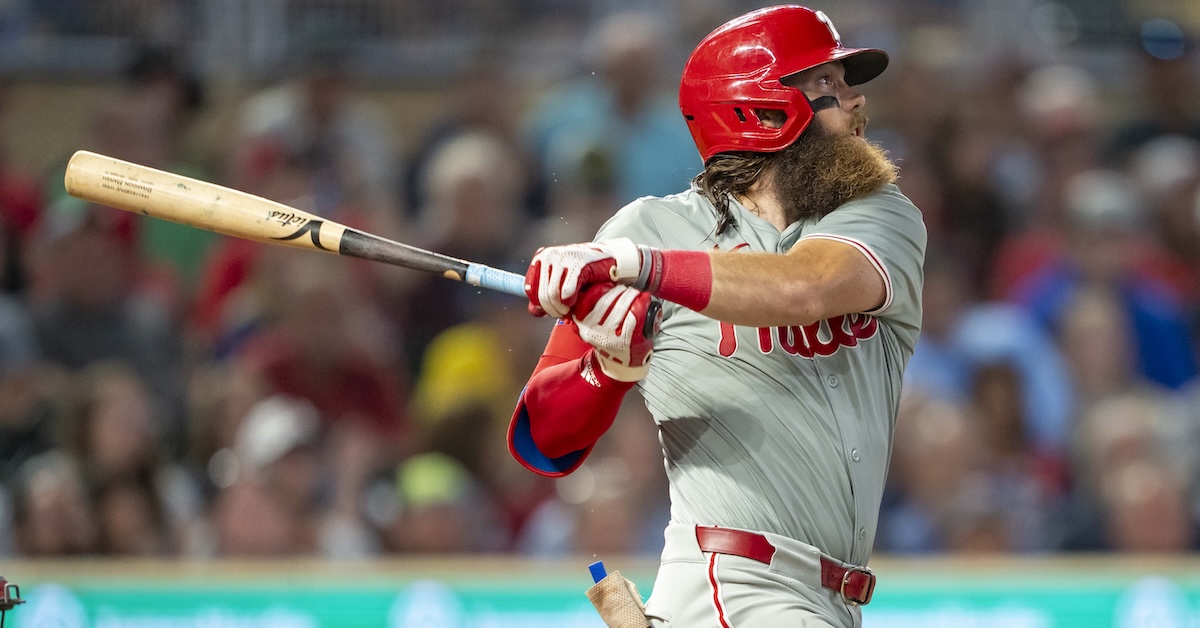
Marsh is the most interesting name on the list. He shouldn’t have an argument to be our champion. He really shouldn’t. He didn’t finish first on either list! But he spent two thirds of his time in left, just under a third of his time in center, and a handful of games in right, and here’s where it gets fun. He really did tend to hit the ball to wherever he was playing. When he was a left fielder, the plurality of his balls in play went to left, when he was in center, the plurality went to center, and the same thing in right.
| Position | P | C | 1B | 2B | 3B | SS | LF | CF | RF |
|---|---|---|---|---|---|---|---|---|---|
| LF | 6 | 0 | 21 | 25 | 8 | 6 | 36 | 37 | 28 |
| CF | 0 | 0 | 5 | 11 | 4 | 7 | 12 | 22 | 12 |
| RF | 1 | 0 | 3 | 0 | 0 | 0 | 0 | 1 | 3 |
The guy just plain loves hitting the ball to the outfield. He may have finished behind the leader by 0.01 percentage points, but of all the players on our list, Marsh understood the assignment best.
And that’s it, my friends. We’ve answered the question three different ways, which, now that I think of it more than 2,000 words later, is a little bit like not answering it at all, but here we are. We’ve got three kings. I’m not here to tie things up in a bow. I’m here to sow chaos, and as anyone who’s read Dune can tell you, in politics, the tripod is the most unstable of all structures. If you have a strong opinion as to who should be our winner, please fight it out in the comments. I’ll now leave you with the leaders at each position, both on a rate basis and overall.
| Position | Player | BTP% | Player | Total BTP | |
|---|---|---|---|---|---|
| C | Nick Fortes | 3.3 | Nick Fortes | 9 | |
| 1B | Anthony Rizzo | 14.4 | Jake Cronenworth | 56 | |
| 2B | Jeff McNeil | 17.3 | Andrés Giménez | 77 | |
| 3B | Eugenio Suárez | 16.4 | Eugenio Suárez | 61 | |
| SS | Anthony Volpe | 21.1 | Anthony Volpe | 100 | |
| LF | Brandon Marsh | 24.6 | Alex Verdugo | 88 | |
| CF | Parker Meadows | 23.5 | Jarren Duran | 115 | |
| RF | Wilyer Abreu | 24.6 | Nick Castellanos | 83 |
Davy Andrews is a Brooklyn-based musician and a writer at FanGraphs. He can be found on Bluesky @davyandrewsdavy.bsky.social.
What a poetic opening paragraph