Why Are Catchers So Dang Slow?

It doesn’t take a keen eye for analysis to watch a baseball game and guess which player is the slowest. You could grab a stopwatch and time them running to first, or you could just take a look at the short and stout guy crouching all game and wearing body armor. I’m not breaking any ground when I tell you that catchers are the slowest major leaguers.
A less settled question: why are they so slow? Is it the armor? Is it the short and stout part? Is it the deleterious effect of crouching all day? We have eight years of sprint speed data, so I decided to dig into it and look for an answer.
First things first: I constructed a sprint speed aging curve. To do that, I took every player-season with at least 10 competitive runs starting in 2015. For each player-season, I noted their age, position, sprint speed in year one, and change in sprint speed in the subsequent year (assuming they made at least 10 competitive runs). For example, Byron Buxton was 21 in 2015 and posted an average sprint speed of 30.9 ft/sec on competitive runs while playing center field. The next year, he again posted an average sprint speed of 30.9 ft/sec. Thus, I recorded 21, CF, 30.9, and 0 (change).
From there, I bucketed the data out by age, aggregating every age-21 season, every age-22 season, and so on. I also noted how many players each year fell out of the sample, or in other words, how many had 10 competitive runs in one year and then didn’t play the next year. Here’s how that data breaks down:
| Age | Y1 Speed (ft/sec) | Change (ft/sec) | Observations | Attrition Rate |
|---|---|---|---|---|
| 21 | 28.2 | -0.05 | 42 | 14.3% |
| 22 | 28.0 | -0.15 | 97 | 13.4% |
| 23 | 27.9 | -0.13 | 170 | 15.4% |
| 24 | 27.7 | -0.17 | 277 | 14.0% |
| 25 | 27.6 | -0.12 | 322 | 17.4% |
| 26 | 27.4 | -0.13 | 348 | 16.9% |
| 27 | 27.3 | -0.16 | 307 | 22.3% |
| 28 | 27.1 | -0.15 | 267 | 26.0% |
| 29 | 26.9 | -0.13 | 239 | 19.8% |
| 30 | 26.7 | -0.16 | 221 | 16.6% |
| 31 | 26.5 | -0.07 | 189 | 20.3% |
| 32 | 26.3 | -0.14 | 156 | 23.2% |
| 33 | 26.2 | -0.21 | 106 | 34.2% |
| 34 | 25.9 | -0.09 | 74 | 39.3% |
| 35 | 25.8 | -0.12 | 50 | 37.5% |
| 36 | 25.7 | -0.13 | 31 | 44.6% |
| 37 | 25.2 | -0.26 | 18 | 47.1% |
| 38 | 24.4 | -0.06 | 11 | 35.3% |
| 39 | 24.1 | 0.00 | 6 | 50.0% |
| 40 | 24.0 | -0.05 | 2 | 66.7% |
A quick-ish aside: attrition rate is the percentage of players that fell out of the sample in a given year. I’m unsure how to treat it when it comes to estimating “true” loss in sprint speed. One reasonable assumption you might make is that players who lost the most speed from one year to the next are most likely to fall out of the sample, meaning that for an average player, sprint speed declines by more than what I’ve calculated here. You could also reasonably assume that speed is unrelated to what makes players fall out of the pool of major league players, or at least mostly uncorrelated, so that the survivor bias doesn’t matter. Teams probably don’t look at slap-hitting middle infielders and wonder “did he lose a step;” they wonder “can he hit enough to play for my team?”
I waffled a bit on what to do with these missing player-seasons. I could treat them as having the same value as the biggest decline in the sample, or the average of the lowest quartile, or some version of that. I could also ignore them. I considered Jonathan Judge’s excellent work on survivor bias in baseball and decided that ignoring survivor bias is an acceptable option here. This is based on a key assumption: a player’s change in speed from one year to the next isn’t materially correlated with their odds of remaining a major leaguer. I think this assumption falls apart at the ends of the distribution, and a method that corrects for survivor bias might make more sense there. A 35-year-old who declines markedly from a physical perspective will probably both lose a ton of sprint speed and disappear from the majors. For the balance of this study, I’ll focus on ages 25–30, but that’s a helpful point for any expanded version.
With those caveats, here’s a rough curve of average sprint speeds by year for major leaguers, centered on zero at age 21:

After all that preamble, let’s get to the part about catchers! I extracted every catcher season from my dataset and ran the numbers for catchers only. Here they are in tabular form:
| Age | Y1 Speed (ft/sec) | Change (ft/sec) | Observations | Attrition Rate |
|---|---|---|---|---|
| 21 | 25.5 | -1.00 | 1 | 66.7% |
| 22 | 25.7 | -0.18 | 5 | 50.0% |
| 23 | 26.6 | -0.28 | 12 | 20.0% |
| 24 | 26.5 | -0.04 | 30 | 14.3% |
| 25 | 26.0 | -0.05 | 33 | 28.3% |
| 26 | 25.8 | -0.20 | 47 | 13.0% |
| 27 | 25.8 | -0.14 | 50 | 13.8% |
| 28 | 25.8 | -0.15 | 43 | 31.7% |
| 29 | 25.6 | -0.10 | 43 | 17.3% |
| 30 | 25.5 | -0.18 | 48 | 11.1% |
| 31 | 25.1 | -0.07 | 40 | 18.4% |
| 32 | 24.8 | -0.12 | 31 | 22.5% |
| 33 | 25.1 | -0.11 | 19 | 34.5% |
| 34 | 25.2 | -0.28 | 16 | 30.4% |
| 35 | 25.0 | -0.45 | 12 | 25.0% |
| 36 | 24.5 | 0.29 | 7 | 46.2% |
| 37 | 24.6 | -0.60 | 4 | 42.9% |
| 38 | 24.3 | -0.28 | 4 | 20.0% |
| 39 | 24.3 | -0.50 | 1 | 66.7% |
Though the average catcher is far slower than the average position player, both groups decline at a similar rate. The sample sizes aren’t huge — there just aren’t that many catchers compared to total fielders — but they’re not so small as to be insignificant. There’s also an interesting effect that you can see from ages 26 through 28: despite each individual catcher losing speed from one year to the next, the population mean stays mostly unchanged. I’ve broken that out here, so you can see the difference in year-one sprint speed between survivors and non-survivors:
| Age | Surviving | Non-Surviving |
|---|---|---|
| 21 | 25.5 | 26.7 |
| 22 | 25.7 | 26.3 |
| 23 | 26.6 | 26.2 |
| 24 | 26.5 | 26.6 |
| 25 | 26.0 | 25.9 |
| 26 | 25.8 | 26.1 |
| 27 | 25.8 | 24.5 |
| 28 | 25.8 | 25.2 |
| 29 | 25.6 | 25.7 |
| 30 | 25.5 | 25.8 |
| 31 | 25.1 | 25.8 |
| 32 | 24.8 | 25.0 |
| 33 | 25.1 | 24.5 |
| 34 | 25.2 | 24.6 |
| 35 | 25.0 | 24.7 |
| 36 | 24.5 | 24.8 |
| 37 | 24.6 | 25.2 |
| 38 | 24.3 | 25.6 |
| 39 | 24.3 | 25.0 |
I don’t think this is a huge effect. The two groups are pretty similar in terms of initial speeds. As a further check, I looked at whether decline in sprint speed for returning players is correlated to initial sprint speed. It is: players who record faster times in year one tend to decline by more in year two, though the effect is small. This is likely capturing injuries; players who record slower speeds in a given year are more likely to be hurt and thus to “improve” their speed from one year to the next merely by being healthy. In any case, I don’t think we’re missing anything based on the type of catcher who survives from one year to the next.
Another check, though I’ll say in advance that this one is full of confounding variables: do catchers who carry a higher workload in one year slow down more? I looked at every catcher who caught at least 300 innings in a given year and looked for a correlation between innings caught and decline in sprint speed from year one to year two. Meh:

Don’t say I didn’t (say I didn’t) warn you. There isn’t much there, and there are a pile of data problems anyway. Catchers who caught less in year one might have been hurt. They might have been splitting time with another position. They might have caught in the minors that year. There are endless possible explanations. On the flip side, high-workload catchers might be built differently. They might naturally have better recovery skills. If we assume teams are trying to give their players optimal rest, this chart might be good evidence that it’s working. I don’t think there’s much to learn from this particular graph.
The takeaway from all of this: catchers don’t appear to lose their speed any differently than fielders as a whole. That’s a surprising finding, at least to me, as I expected the wear and tear of catching to, well, catch up to the people doing it. You can come up with alternative theories, though. Catchers are in the field for fewer innings, and it’s a safe bet that the average catcher does more exercises designed to strengthen their knees and counteract day-to-day wear and tear than the average left fielder. Perhaps catchers have a significantly different maintenance routine that makes up for the inherently difficult work they do.
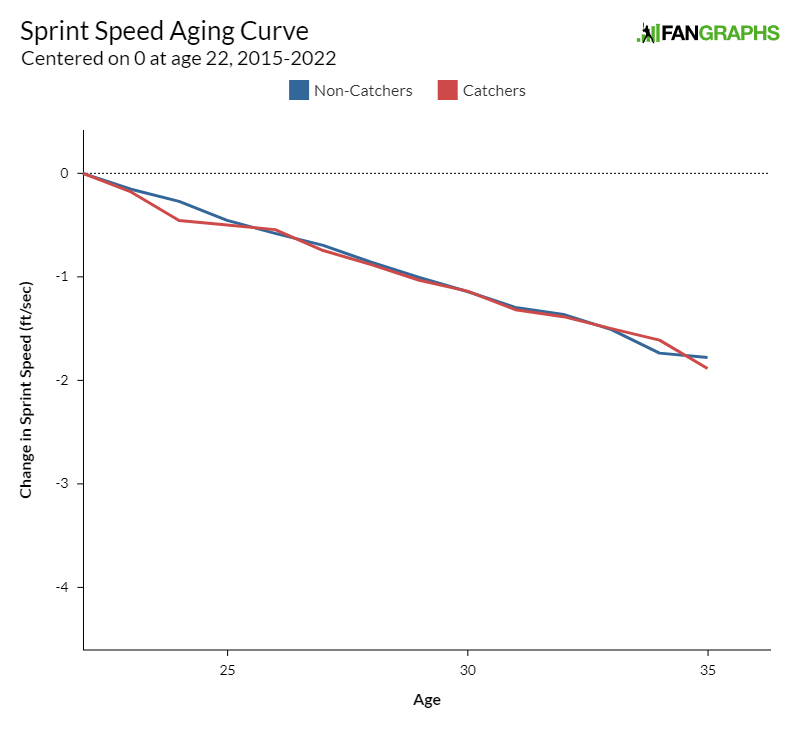
In any case, when it comes to what we observe on the field, catchers and non-catchers seem to slow down at a similar rate. Here are the two aging curves on the same graph with different starting points:

And here’s how similar they’d look if both populations started with the same average:
My conclusion: as best as I can tell, the factors causing catchers to run more slowly than other position players happen before they reach the major leagues. It could be selection bias in youth baseball: if you look like Alejandro Kirk, you’ll probably get a shot at catching, whereas if you look like Dee Strange-Gordon, you probably won’t. It could be a pre-majors developmental issue; maybe catching as a teenager does enough damage to slow catchers down. It could be an effect of the type of training catchers do in the minors — maybe they focus less on increasing speed and more on, say, flexibility and lateral agility. I’m in no position to comment on these aside from making some educated guesses.
But if you’re worried about a major league catcher’s speed falling off the map, the data suggests you’re over-worrying. Players get slower from one year to the next on average; time is undefeated. But as best as I can tell from parsing the data, being a catcher doesn’t do anything to change your speed outlook — aside from the fact that catchers mostly start out slower than their peers. If you’re worried J.T. Realmuto or Daulton Varsho will suddenly turn into Yadier Molina, relax. Catchers: they’re just like the rest of us, assuming by “the rest of us” you mean a tiny cohort of professional athletes.
Ben is a writer at FanGraphs. He can be found on Bluesky @benclemens.
Did you consider comparing size/body type to back up your”Kirk v. Gordon” theory? Are catchers heavier than other fielders on average? Shorter?
Depends what position you’re comparing them with.
I didn’t think about it too much because the height and weight data just aren’t that good, to be honest.
I’d be interested to see if they have a higher sprint speed when they DH.
Like, did Mauer/Posey get faster in years when they weren’t playing C?