Zack Greinke’s Simple Slider Solution
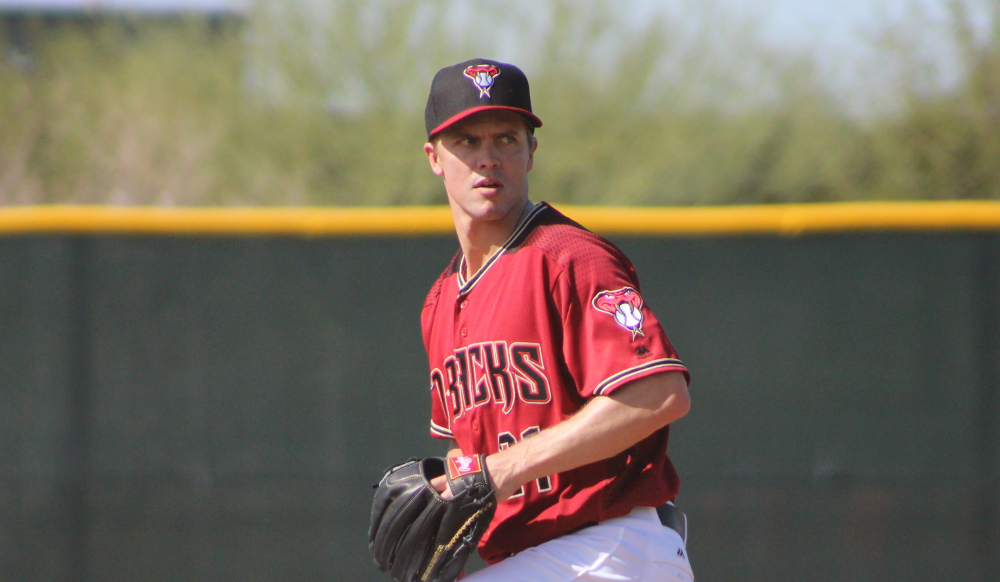
Over the last year or so, I’ve pestered Zack Greinke about his slider because I was sure it was the source of his difficult first season in Arizona. He’s resisted that characterization, telling me at times that his command was just a little off, but that he couldn’t blame anything about his slider on Arizona’s thin air and lack of humidity. Maybe he’s right — this year’s slider is a little different, but not enough to explain the overall difference between the two seasons. Instead, it might be a simplification of his approach that has really helped tonight’s Wild Card starter return to form.
Pitchers have told me that breaking ball command is tough in Arizona, where the weather is dry and the mud on the ball turns to dust. But if you compare the sliders thrown by D-backs pitchers at home versus on the road over the last 10 years, no real pattern emerges. In fact, the club’s sliders have gotten around a half-inch more drop at home than on the road over the last four years, and drop is usually good for the pitch. Maybe the air somehow produces more hangers anyway?
As for Greinke, specifically, his slider doesn’t seem to be all that different this year. In form, at least, it appears just a little bit different this year. Consider the data:
| Year | Usage | Velocity | pfx HMov (in.) | pfx VMov (in.) | GB% | HR% | Whiff% |
|---|---|---|---|---|---|---|---|
| 2016 | 20.36% | 86.3 | 3.8 | 1.4 | 55% | 0.7% | 21% |
| 2017 | 22.09% | 84.2 | 4.0 | 2.2 | 43% | 1.4% | 26% |
Greinke’s slider is featuring less drop and less velocity this year than last. What little we know about the pitch suggests that drop and velocity are usually good. But Greinke’s whiff rate has actually increased by five percentage points. So those swings and misses are likely a product of something other than movement and velocity.
Maybe improved command of the pitch has improved his outcomes? He threw the slider lower, on average, than he has since 2012. He threw it further inside to lefties than he had since 2009. He threw it further away from righties than he did last year. In other words, he threw it further away from the heart of the plate.
It might be that last development — staying further away for righties — that has been the most effective for Greinke. His whiff rate on the pitch against lefties went from 20% last year to 21% while increasing from 21% to 27% against righties. Here’s how it looks in heat map form.

As you can see, the difference is subtle.
Could it be that less drop and good command is eliciting more swings? He did get more swings this year (58%) than last (55%) on the slider. Again, though, subtle.
Less subtle is the difference in his pitching mix if you look at it by handedness.
Against righties, Greinke stopped throwing the change as often and threw sliders and fastballs 86% of the time last year, the highest percentage since he became a starter. It’s not that the change was terrible against righties, but it did give up the second-best slugging percentage of his many pitches. And if you revisit that heat map, you’ll see that the biggest difference is just quantity more than anything. He’s throwing more sliders to righties!
Against lefties, Greinke threw the curve more this year than he had since 2012, second-most of his career. It also had more sideways movement than it had since that year. The curve has been above average by whiffs and grounders and was only responsible for one homer (and a .304 slugging) during the regular season.
There was once a wrinkle in league-wide pitching mix, and throwing changeups to same-handed batters was a fun new thing. Greinke had his fun with it, throwing almost 10% changeups to right-handers over the last three years.
But there’s a reason that pitches have platoon splits: over the meat of a season, in the large sample, a pitch with that type of movement will eventually leak over the plate and make it easy for a same-handed batter to hit. So, yeah, some of Greinke’s return to form was about returning to the slider.
But it wasn’t about the form of the slider. Or even really about the command. It looks like it was just about throwing more of the sliders to righties. Why go away from a pitch that had the fourth-best whiff rate among starter’s sliders in baseball this year? Throw it more!
| Player | Num | Whiff% |
|---|---|---|
| Corey Kluber | 777 | 29.5% |
| Max Scherzer | 766 | 27.0% |
| Carlos Carrasco | 630 | 26.8% |
| Zack Greinke | 689 | 26.6% |
| Clayton Kershaw | 833 | 26.5% |
| Robbie Ray | 522 | 25.7% |
| Dylan Bundy | 607 | 25.2% |
| Blake Snell | 306 | 25.2% |
| Robert Stephenson | 262 | 24.4% |
| Mike Clevinger | 377 | 23.1% |
With a phone full of pictures of pitchers' fingers, strange beers, and his two toddler sons, Eno Sarris can be found at the ballpark or a brewery most days. Read him here, writing about the A's or Giants at The Athletic, or about beer at October. Follow him on Twitter @enosarris if you can handle the sandwiches and inanity.
Snell’s name jumps off that list to me. You have to wonder why he leans so heavily on the changeup (13.5 SwStr%, 108 wRC+) over his slider (24.2, 59) and curve (19.7, 29).
His diverse repertoire with multiple excellent swing-and-miss secondaries, but low-whiff fastball (4.9, 126), makes me think he should try a less fastball-heavy approach in general.
I’ve said it before and will say it again: Greinke is the smartest pitcher in baseball right now.
Bauer is up there as well
He is really painting that low outside corner, huh?
Am I misinterpreting the first table in the article? You make reference (a handful of times) to Greinke’s slider featuring less drop this year compared to 2016 – however it looks like the table indicates that his pfx Vertical movement in 2017 is 2.2 inches compared to 1.4 in 2016….
A lower number there means more drop! A curve will typically have a -5 number there for example.