Archive for August, 2010

Belt Closer to the Bay

It has been a good year to be a first baseman in the San Francisco Giants organization. Aubrey Huff has been one of the season’s great surprises, having his best season since he was 26 years old, a year after the worst season of his career. Huff has expressed interest in returning to San Francisco next season, and while Brian Sabean said that he has “earned consideration” for an extension, no talks have been planned. Throwing a wrench into those negotiations is surely the unbelievable season that Brandon Belt has had in the minor leagues. Promoted to Triple-A before yesterday’s games, Belt tallied a home run, two walks, a steal and three runs in his first game for the Fresno Grizzlies. Now having played across three levels, Belt is hitting .363/.464/.628 (with a .450+ wOBA) in 123 games.

Belt was an above-slot signee after being drafted in the fifth round of the 2009 draft out of the University of Texas. After transferring to the Longhorns as one of the junior college’s best players, Belt disappointed a bit in two seasons with the Longhorns, hitting .324/.405/.514 for his career. It’s a good line, but for a first baseman with aluminum bats, and considering the hype that surrounded his transfer, expectations had been higher. But credit the Giants scouting team for not judging Belt by his number output, and instead seeing a guy they could develop into an asset. After all, Belt had struck out just 72 times in 469 Division I at-bats (15.4 K%); only his power numbers disappointed.

The Giants saw something in his approach that could be changed, and for that, I’ll turn to a piece Andy Baggarly wrote for Baseball America [side note: buy a subscription!]:

When the Giants first saw Belt in instructional league last fall, he had a closed stance that served him well as a contact hitter but left him prone to hard stuff inside…”All we did was square him up and give him some direction back toward the middle,” [farm director Fred] Stanley said. “Just kind of free him up so his hips and hands can work . . . and my goodness.”

Indeed. After starting his season 0-for-8 in two games, Belt would post just nine more 0-fers in 75 games in the California League. He would put together an 18-game hit streak in April and a 16-game streak in June, flashing more power as time went on. Even his baserunning improved — after going just 11-for-18 stealing bases the first two months, Belt stole seven straight bases successfully before earning a promotion to Double-A. Belt’s Cal League career ended with a .383/.492/.628 batting line (.486 wOBA)in one of the leagues tougher stadiums in which to hit- at an age just under the league average. The team moved him up to Richmond in the Eastern League, where — according again to Fred Stanley in Baggarly’s piece — “it’s taken some of our batting hitting prospects a few months to get used to that league.”

It took Belt one game. In his Flying Squirrels debut, Belt went 0-for-3 against former first-round pick Brooks Brown. He followed that up with a 12-game hitting steak that included five home runs and six multi-hit games. With above-average speed and a strong left arm (he was once considered a stronger prospect on a mound), I was calling for an outfield trial as early as June. On July 29, the Giants responded, giving Belt a start in left field for the first time all season. In his final 23 games with Richmond, Belt would take the outfield seven times. While his defense at first base is considered an asset, adding some versatility can’t be considered a bad thing — and given the AAA Fresno Grizzlies have had Brett Pill at first base all season, Belt sure enough had his first start yesterday in left field.

According to Baggarly, “the Giants expect to call him up in September.” I’m guessing the promotion to Fresno has something to do with the fact that the Grizzlies are in a Pacific Coast League playoff hunt, while Richmond is near the bottom of the Eastern League standings. Many teams like their prospects to get some minor league postseason experience before reaching the big leagues, and I think it’s likelier we’ll see Belt in San Francisco after the Fresno season ends, rather then when the rosters expand on September 1. I think he could help the Giants against right-handed pitchers; he doesn’t have a bad line against left-handers this year, but in High-A he couldn’t hit them for power (.097 ISO), and in Double-A, his BB-K ratio was 2-12 in 53 plate appearances. He has shown some improvements this year, and I’m not calling him a future platoon player, just not a 22-year-old that should be getting development time against big league lefties in a Wild Card race.

We’ll get into Belt’s WAR potential another day, but suffice it to say, we should begin taking this breakout seriously. Belt now has 536 plate appearances with a solid strikeout rate, a great walk rate, and improving power. As Dave Cameron reminded us around the trade deadline, “In prospect land, things can change a lot in a short period of time.” This is magnified when a team combines good scouting with good developing; it’s magnified even gretaer when a player buys into instruction. Brandon Belt isn’t a future star, but he’s a reason for the Giants to re-consider paying Aubrey Huff for his big season.


Heath Bell Takes Another Step Forward

Nobody should be particularly surprised that Heath Bell is having another excellent season as the Padres closer. This is Bell’s fourth year as a Padres reliever, and in his worst year prior to 2010 Bell posted a 3.58 ERA and a 3.34 FIP. The other two seasons were nothing short of excellent: 2.02 ERA, 2.50 FIP, 2.4 WAR in 2007 and a 2.71 ERA, 2.42 FIP, 2.0 WAR season in 2009.

Bell, as most ace relievers do, thrives on the strikeout. In his time with the Padres, only his relatively weak 2008 campaign saw a strikeout rate lower than one per inning. 2009 saw a climb above 10 K/9 for the first time in his career. It’s not terribly surprising that Bell has good strikeout numbers – mixing a 94 MPH average fastball with an 81 MPH curveball is bound to induce plenty of swings and misses, and Bell has that in a 10.0% swinging strike rate.

This year has seen another increase in strikeouts for Bell, as the hefty closer’s K/9 rate has risen to 11.6. The uptick in strikeouts is accompanied by an expected rise in swinging strike rate. Bell has gone to the curveball a career high 30% of the time this year. Due to the much higher swinging strike rates on breaking pitches, the rise in swinging strikes and strikeouts in general is unsurprising. The side effect of that, however, has been a decrease in pitches in the strike zone, and with pitches out of the zone come more walks. Bell’s 3.5 BB/9 rate is certainly acceptable for a reliever who can whiff such a high amount of batters, but it also marks a career high.

Despite the career high in walk rate, Bell’s FIP of 1.95 (along with an ERA of 1.84) is easily a career low, mainly because Bell has only allowed one home run in his 53.2 innings of pitching and the 48 fly balls he’s allowed. Bell’s 2.1% HR/FB ratio obviously can’t be sustained, but it’s not as if we should expect Bell to come crashing down to earth or anything. Bell gets a decent, but not great, amount of ground balls – 45%. More importantly, though, Bell has shown an ability, like some elite relievers, to maintain low HR/FB rates. Not that Bell can maintain anything like he’s done this year, but from 2007-2009 Bell has posted HR/FB rates of 6.0%, 6.8%, and 5.1%, respectively. Although the three years still only covers 240 innings due to the nature of relieving, that’s enough evidence to at least suggest that Bell’s HR/FB rate should stay below the league average of just under 10%.

Before the season, all the talk with Heath Bell was how long it would take for him to end up in the uniform of some contending team. With August coming to a close all the talk is of Bell’s fantastic performance and the performance of the Padres. Bell continues to establish himself as an elite closer, and now, it looks he will get to do it as a Padre in October.


One Night Only! (Super Cy-zed Edition)

Three games want so badly to pleasure you tonight. Let down your guard, America, and let in the joy.

(Games listed in order of likely awesomness. NERD scores in parentheses.)

Minnesota (7) at Texas (8) | 8:10pm ET
Starting Pitchers
Twins: Francisco Liriano (10)
151.1 IP, 9.81 K/9, 2.97 BB/9. .350 BABIP, 53.8% GB, 2.9% HR/FB, 3.00 xFIP

Rangers: Cliff Lee (10)
174.2 IP, 7.78 K/9, 0.57 BB/9, .301 BABIP, 40.3% GB, 6.0% HR/FB, 3.28 xFIP

Notes
• Because you and I have never met — and because we’ve definitely never heart-to-hearted our respective world views over a couple-few glasses of white zin — I don’t exactly know what you’re looking for out of life. A home in a nice school district? A sweet yacht and stuff? I don’t know. Anyway, I’m guessing one thing you don’t mind — especially since you’re the sort of enthusiast to point his internet browser this way — is a clash between the American League’s two best pitchers. That’s what this game features. In other words: boo-yah.
• You don’t need to care even one lick about the Mariners to read Jeff Sullivan’s writing at Lookout Landing. You just have to wanna say bonjour to a prose style equal parts masculine and magical. Anyway, Sully (as no one should ever call him) is so good, he can even make you care about the whole Colin Cowherd-Cliff Lee thing.
• Question: Who will start in center for the Twinkers? The Shadow knows! (And Ron Gardenhire, too, probably.) (And also maybe Parker Hageman.)

Arizona (9) at San Diego (10) | 6:35pm ET
Starting Pitchers
DBacks: Ian Kennedy (5)
151.0 IP, 7.63 K/9, 3.34 BB/9, .277 BABIP, 36.4% GB, 12.4% HR/FB, 4.44 xFIP

Pads: Kevin Correia (5)
132.2 IP, 6.85 K/9, 3.87 BB/9, .298 BABIP, 49.1% GB, 14.2% HR/FB, 4.22 xFIP

Notes
• When you talk about Carson Cistulli, you’re talking about a guy who’s shocked to learn that Ian Kennedy’s thrown 151 innings this year. Go, you guy.
• When you talk about Carson Cistulli, you’re also talking about a guy who’s pretty surprised that Kevin Correia — who calls the giant, cavernous, and salty-aired Petco Park his home — currently sports an inflated HR/FB rate. Even curiouser is this next thing. Correia at home: 76.0 IP, 16.2% HR/FB. Correia on the road: 56.2 IP, 11.5% HR/FB.
Chris Denorfia is repping Wheaton College* pretty hard these days. Line: 238 PA, .289/.354/.483 (.317 BABIP), .360 wOBA, 134 wRC+, 1.8 WAR. Also, he appears to’ve taken over center field duties with Tony Gwynn Jr. out of commission.

*Sorry. I meant THE Wheaton College.

If I Had My Druthers
• There’d be a book called Correia on the Road.
Correia on the Road would be “a largely autobiographical work based on the spontaneous road trips of Correia and his friends across mid-century America.”
• Oh yeah, and Kevin Correia would’ve also time-traveled here from mid-century America.

Saint Louis (5) at Washington (6) | 7:05pm ET
Starting Pitchers
Cards: Chris Carpenter (6)
184.1 IP, 6.98 K/9. 2.49 BB/9, .275 BABIP, 50.9% GB, 10.7% HR/FB, 3.80 xFIP

Nats: Jordan Zimmermann (10*)
(2009) 91.1 IP, 9.07 K/9, 2.86 BB/9. .339 BABIP, 43.5% GB, 12.2% HR/FB, 3.39 xFIP

Notes
• This marks Zimmermann’s season debut — a kinda exciting thing, when you consider what he was able to do last year before succumbing to arm troubles and, eventually, Tommy John surgery. Here’s Zimmermann’s line through four Triple-A starts: 17.0 IP, 12 K, 3 BB, 0 HR, 2.32 FIP. The K numbers don’t appear to be there yet, but the control seems to’ve returned. Anyway, we’ll see.
Ryan Ludwick was traded to the San Diego Padres on July 31st. Here’s Jon Jay’s line since then: .324/.378/.397 (.393 BABIP). That’s about a .353 wOBA. With something closer to a .325 BABIP, however, that’s more like a .300 wOBA. I bet Jay’s true talent lies somewhere above that (and I hope it does, as he’s on my fantasy team), but it’ll be interesting to see how things play out.
• If you didn’t read Dave Cameron’s piece about Ryan Zimmerman last week, (a) that’s kind of embarrassing and (b) do it by clicking here. Here’s what he says: were he to start a franchise, he’d very likely do it with Ryan Zimmerman — a.k.a. the same exact Ryan Zimmerman you can watch in this game.

Also Playing
These games are very likely playing at some kind of sporty channel near you.

pNERD = Pitcher NERD
tNERD = Team NERD
Game = Time and Average NERD for Game
* = Estimated NERD


Scutaro’s Caught Lookings

After an impressive 2009 season in which Marco Scutaro held a .354 wOBA, he’s back to a modest .317, almost a perfect match for his career average. In other words: Scutaro is back to being Scutaro. Digging around his Baseball-Reference page leads me to ask this question: would you suspect that Scutaro strikes out more often looking or swinging?

I knew Scutaro is among the game’s premiere in-zone contact hitters. This year he’s at 97.3% and at 94.3% for his career, which suggests that Scutaro is unlikely to swing and miss often, but it can happen. As it turns out, though, Scutaro isn’t swinging and missing a lot for strike three at all. He actually leads the league in strikeouts looking (divided by total strikeouts) among batters with 300+ plate appearances. Not only that, but Scutaro is at 64% (he’s one of three players over 50% and the only one above 55%), which happens to be four standard deviations from the mean (24%).

The 64% figure would only be the second highest rate of Scutaro’s career, with 2007’s 65% finishing in first; in between, Scutaro posted rates of 51% and 60%. Suffice to say that Scutaro enjoys watching, which is probably not one of his endearing qualities. I wanted to see just what Scutaro is looking at and as such took his pitchfx data this season and plotted it like such:

I’m no Dave Allen, but I did add a little Paint to the image with those four lines. The points are not arbitrary, as the black lines indicate the edges of the plate and the red lines represent the half inch points. Anything that falls within the red is over the middle while anything outside the black is off the plate. Your eyes do not lie as most of Scutaro’s strike threes take place on the outside corner.

It seems to me those spots are going to make it hard for any batter to put a good swing on the pitch. As Scutaro seems to understand his own limitations at making contact, perhaps the high density of taken strikes is admittance that some of these pitches were simply placed in an unhittable position in the zone, even for the guy who hits everything in the zone.


Doubleheader Duration

I was absent-mindedly keeping track of the Seattle and Boston doubleheader today when I decided that it felt to me that the game was progressing quickly. The kernel of a thought gave rise to me pondering other doubleheaders that I had watched and I had a fuzzy recollection of those also moving quickly as well. Thus, a hypothesis was born. Knowing that they have to play two games in one day, do players attempt to play at a quicker pace?

Far be it for me simply to toss out a hypothesis without taking steps to try to prove it. After all, I wouldn’t want to be like Damien Cox. Lucky for me —and for all of us— we live in a reality where Retrosheet exists and is free and totally awesome.

Testing the theory is a bit more complicated than simply comparing the average game duration for doubleheaders against single game days. There’s historical context that needs to be applied. Games take longer to complete now than they used to and there used to be more doubleheaders. Therefore taking the average doubleheader duration would result in a skew toward earlier seasons, which had smaller durations.

To get around that, I broke up each season into a separate entry for normal games and doubleheader games and compared them down the line. Over the years 1952 through 2009, the average doubleheader game took 99.8% as long to finish as a normal game. Technically, they do appear to take a shorter amount of time to compete but the margin is so incredibly small and the sample size on doubleheader games small enough that I feel this is not a statistically large enough difference to prove the hypothesis.

It might be tempting to think that nothing was learned, but that’s not true. Proving a theory wrong —or at least showing it currently impossible to prove correct— is still added information. Besides, I made this cool line chart!

I find it interesting that game times were fairly stable from 1952 (147 minutes) through 1976 (149 minutes) and from 1991 (174 minutes) to present day (175 minutes). That was one steep and steady climb.


Vizquel Receives Senior Citizen Discount on Hits & Walks

To think, the Indians let Omar Vizquel walk because he was too old … in 2004. Snark met the White Sox’s decision to begin using the 43-year-old as the permanent third baseman in June and why would anyone expect otherwise? Vizquel’s glove still showed the ability to be an instrument of heroism, but his bat … well; his lumber played the role of dastardly villain.

Between the 2007-09 seasons, Vizquel raked in more than 1,000 plate appearances and batted .243/.301/.308. Vizquel seemed near the end in performance and chances alike as his games played total slipped from 145 to 92 and finally 62 games last season as Elvis Andrus’ caddy and surrogate grandfather.

Yawns (and some sighs) were prevalent to the audience through May. Vizquel had reached base 16 times in 55 plate appearances with two extra base hits. June brought with it a new wave of playing time for the ageless one as well as a pulse. A .278/.338/.389 line translates to a .329 wOBA, which is actually slightly above average this season. Vizquel blew up in July too, posting a 129 wRC+ thanks to a 1.33 BB/K ratio and a .385 BABIP.

August has resulted in a 98 wRC+ so far, which is closer to reality than either of those months, but this is Omar Vizquel for crying out loud. He posted a 129 wRC+. I know you can’t just add wRC+ seasons together to get an average or anything like that, but for trivial purposes, Vizquel’s 2009 and 2008 wRC+ sum is 117. His career wRC+ is 89. Right now, aged 43, as a full-time third baseman, he has a 93 wRC+.

An inflated BABIP relative to recent seasons suggests this comparative hot streak is unlikely to continue. Still, stories like this make baseball the spectacle it is. A man born within a decade of Alaska and Hawaii becoming states is having one of the finest offensive seasons of his career 21 years after first appearing on the scene. Only in baseball.


Kila Busts Out

To say that Kila Ka’aihue’s first 71 plate appearances in the Major Leagues this year were disappointing is a major understatement. After the 26-year-old tore up the league to the tune of a .322/.465/.601 line, good for a 174 wRC+ that qualifies as ridiculous even in the minor leagues, Ka’aihue had been utterly awful entering today’s game, showing no power and hardly walking at all. Kila’s overall MLB line sat at .164/.211/.224 entering today’s extra inning thriller against Detroit, a .200 wOBA that screams AAAA player.

Today, though, Ka’aihue was key in the Royals’ 4-3 victory over the Tigers, walking twice, homering, and doubling in six plate appearances, compiling .202 WPA. That marks only Ka’aihue’s second double and second homer, and, perhaps more remarkably, the two walks raises his total to only 6 in 77 MLB plate appearances. Games like these were Ka’aihue’s signature in the minor leagues, but this is only his second multi-hit game, first multi-walk game, and first multi-XBH hit game in the majors in 2010.

Regardless of how well Ka’aihue performs down the stretch, we’re not going to get enough plate appearances to truly evaluate his true talent in the majors. That’s really unfortunate, because Ka’aihue clearly had nothing left to learn in the minors by at least the All-Star Break. Instead, the Royals will go into next season with at best an unclear picture of Ka’aihue’s true talent and at worst a distorted one.

It will be important for evaluators both inside and outside the Royals organization to remember two things. First, and I think the Royals have clearly demonstrated this (a little too strongly), is that minor league success is not a simple translation to the minors. Obviously, the Royals weren’t convinced by Ka’aihue’s 2008, which almost matched his 2010, nor his decent 2009, and it took another 400 PAs of fantastic performance in AAA in 2010 to finally earn a spot on the MLB club. Expecting Kila to be a star is probably just as unreasonable an expectation, however, and the list of players that have torn up the minors to go on to fizzle in the majors is quite long, and the list of players that unexpectedly play well in the majors after unimpressive minor league careers isn’t exactly tiny.

It remains to be seen if the Royals will understand the second point, which is the ever-repeated argument of sample size, sample size, sample size. Given how poorly Kila started out the season, it would be a surprise if his final line is much more than average. The Royals aren’t going to know how he handles the Majors after only 150 or 200 PAs, and if Kila finishes with something like a .315 wOBA and gets sent back to the minors for the opening of the 2011 season, the Royals will have made the wrong decision.


Are Umpires Expanding the Strike Zone as the Season Goes On?

David Ortiz of the Boston Red Sox recently complained that the strike zone has been expanding as the season has gone on. He stated that the zone is growing in order to speed up the games. I decided to have a look to see if there was validity to this statement

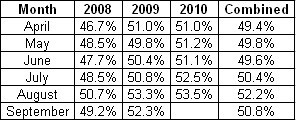
I examined the area of the strike zone where about 50% of the time a pitch taken is called a strike and the other 50% of the time it is called a ball. This zone is just smaller than the rule book strike zone. Here is the percentage of called strikes strikes compared to the sum of called strikes and balls for each month and year:

percent

Note: Combined September data should be taken with a grain of salt because none is available from 2010 and this year more pitches generally are being called strikes.

As a rule, the number of pitches called strikes in this zone increase by ~ 2.5% from the beginning of the season to the end. The called balls and strikes thrown into this zone account for only 12.4% of all pitches throw over the time frame. This works out to 0.3% of all pitches during a game — or, in a 300-pitch game, one extra pitch that is called a strike versus a ball. Not that much difference.

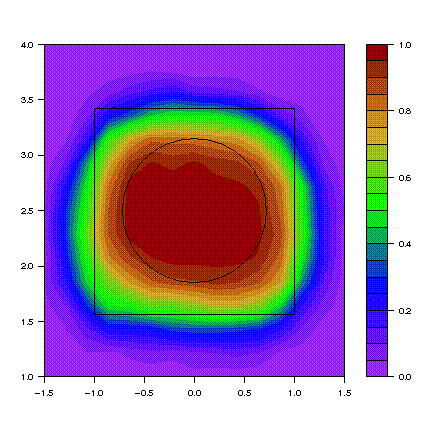
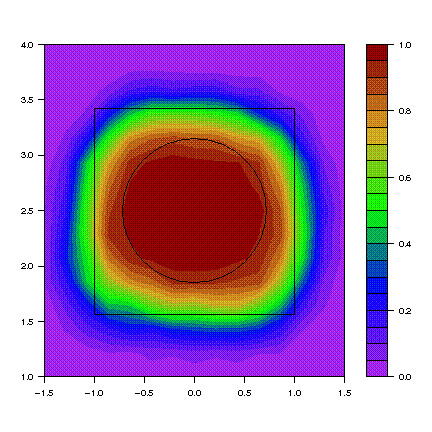
To further show the difference, here are the called strike zones of all umpires from 2008 to 2010 for right-handed batters in the months of April and August.

Note: The numbers indicate the decimal format of the percentage of pitches that are called strikes. The circle means nothing, it is just used for visual reference.

April

4_April_Right

August

8_August_Right

The zone extends a bit on the right and left parts of the plate, but not that much. There seems to be some increasing of the zone over the season, but it is not that much for teams or players to worry about.


The Best Team in Baseball?

If we ran a poll, I’d imagine most people would tab the Yankees or the Rays as the best team in baseball. They have identical records at 78-48, and their .619 winning percentages are #1 in the game. However, neither of them lead MLB in WAR – that distinction belongs to the Minnesota Twins.

At +43.2 WAR, the Twins grade out as the top team to date using measures that don’t take contextual performance into account. As you probably know, WAR is mostly built on the foundation of wOBA, UZR, and FIP as the three main variables, representing offense, defense, and pitching, respectively. The Twins grade out well in each area.

Offensively, they have a team wOBA of .342, trailing only Boston and New York in offensive production. That is even more impressive than it sounds because of how pitcher friendly Target Field appears to be. We can’t make a declarative statement about exactly how the park plays with less than a partial season of data to work with, but all of the subjective evidence lends itself to the idea that it favors pitchers. Despite playing in a lower run environment, the Twins have still been able to put up some serious offensive numbers.

Their position players aren’t just lumbering oafs, either. Well, a few of them are, but they’re overshadowed by some high quality defenders, particularly on the infield. The Twins have posted a UZR of +24.3, 8th best in baseball. Their outfield isn’t much to write home about, but the quality around the infield is staggering. The Twins rank 2nd in UZR at first base, second base, and shortstop, and come in all the way down in 4th place at third base, two-tenths of a run away from a tie for second at that position as well.

Their run prevention isn’t just the defense, though – the pitching is legitimately good, too. They rank 6th in baseball in FIP, and all five teams ahead of them are National League clubs who don’t have to contend with a designated hitter. Their biggest strength is their annual refusal to walk anyone, as they have the lowest BB/9 (2.24) of any team in baseball. They are an evenly balanced staff, as well, as the starters FIP (3.83) and relievers FIP (3.80) are nearly identical.

So, if the Twins have performed well in nearly every aspect of the game, why don’t they have the best record in baseball? Well, the one area they haven’t been great at is the main thing that WAR excludes: situational performance.

As a team, the Twins are hitting .279/.342/.439 with no one on base. When they get someone on, then they’re hitting a nearly identical .280/.355/.428, and with runners in scoring position, it’s a similar .283/.365/.407 line. The problem is that most teams perform better with men on base and runners in scoring position than they do in bases empty situations, so the Twins offensive performance in run scoring situations is worse relative to the rest of the league than it is with no one on base.

The good news for Twins fans? That’s not really the kind of thing that is predictive in nature. That the Twins haven’t hit as well in those situations so far says little to nothing about how they’ll do in those situations going forward. If they begin to get the normal bump that teams see with runners on base, their offense could become even more efficient.

The Yankees and Rays are good teams. The Rangers are, too. But don’t sleep on the Twins – you can make a pretty good case that they’re the best team in baseball this year. I certainly wouldn’t want to play them in October.


Nelson Figueroa Is Still Good

We know Ed Wade loves his former Phillies. The Astros rotation currently contains three former Phillies pitchers (J.A. Happ, Brett Myers, and Nelson Figueroa), with Figueroa being the latest to get a shot at starting down in Houston. While there have been a good amount of criticisms thrown Wade’s way over the past season, picking up journeyman right-hander Figueroa was a low cost move that will help the Astros win ballgames.

This past off season, I wrote an article entitled, simply enough, Why Nelson Figueroa is Good, hoping to draw some attention his way. The conclusion was also pretty straight forward:

What can we expect from Figueroa in 2010? Well, considering that four out of the Mets five current starting pitchers took a trip to the DL last year, we may get to see him start once again. Or, more likely, he’ll spot start here and there and split time between Triple-A and the bullpen. Hopefully, however, he gets a chance to pitch, because Nelson Figueroa is good.

The forecasters all predicted a FIP in the low to mid 4.00’s before the season, and Figueroa has beaten that this year, no doubt thanks to pitching mostly from the bullpen. The Mets put him on waivers during Spring Training (and have gone on to watch Fernando Nieve and Pat Misch start games in 2010, let alone Oliver Perez do it seven times) where he was quickly snagged up by the Phillies.

He pitched well in Philadelphia with a 3.46 ERA and 3.49 FIP (4.51 xFIP) in twenty-six innings. Considering the lack of serious depth in the Phillies bullpen, why he was put on waivers again is troubling (I guess Danys Baez’s near identical walk and strikeout numbers were just too appealing). The Astros claimed him on July 21st, where he continued to pitch out of the pen, again succeeding. He was moved into the Houston rotation last week, and thus far has pitched well. The coolest part is that he volunteered himself to become a starter when the Astros lost some pitchers to injuries. For the 2010 season, here are Figueroa’s total numbers:

IP: 48.1
ERA: 2.98
FIP: 3.37
xFIP: 3.79
tERA: 3.38
K/9: 7.26
BB/9: 2.42

For the rest of the season, ZiPS thinks he’s good for a 4.23 FIP, a solid improvement on his preseason projection from ZiPS (4.54). That’s not bad for a pitcher that seems to go on waivers more than he starts games. Fortunately for the Figueroa family, I think he’s found a home in Houston this time.