Archive for May, 2011
Lance Berkman, Edgar Martinez, and Cooperstown
Lance Berkman is off to a monster start to the 2011 season, hitting .406/.467/.781 for the Cardinals. He’s one of only a handful of players to already accumulate +2 WAR for the year, and he’s nearly matched his 2010 total in that regard. Whatever stories were getting written about his demise last year have been put on hold indefinitely, as Berkman is showing that he’s not even close to washed up at age 35.
In looking at his career batting line, I began to realize that Berkman has some Hall-Of-Fame marks in the rate statistics. His .297/.410/.549 mark over the last decade is good for a 146 wRC+, the same level of offensive performance that Mike Schmidt had over his career. Other players in that same mid-140s wRC+ range include Willie Stargell, Willie McCovey, Chipper Jones, Jim Thome, Eddie Matthews, and Ralph Kiner– lots of Hall-Of-Fame names in that area.
One Night Only: Hot Game Previews for May 3rd

May 3, 2011

By definition, every shot of William Howard Taft is a wide-angle shot.
This edition of One Night Only contains:
1. Expanded previews for two games: San Francisco at New York (NL) and Colorado at Atlanta.
2. Smaller, but still entirely luminous, reports on three more games: Milwaukee at Atlanta, Florida at St. Louis, and Cleveland at Oakland.
3. Pitcher and Team NERD scores for every one of tonight’s games regardless of race, creed, color, gender, or if it involves the Astros.
The Morning After: Game Recaps for May 2nd

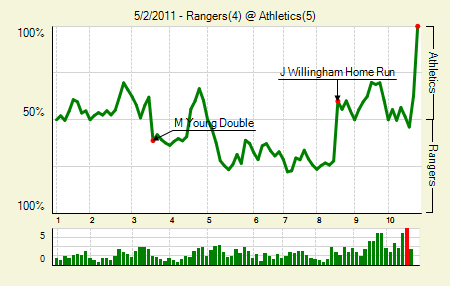
Moving the Needle: Hideki Matsui ends it with a homer, +.375 WPA. Same as last season, Matsui is off to a slow start in 2011. He had only one hit in this game, but he made it count. On the first pitch of the 10th inning he took Darren Oliver deep, ending the game just like that. It was the A’s third home run of the day, each of which led off an inning.
Notables
Brandon McCarthy : 6 IP, 6 H, 4 R, 0 ER, 2 BB, 4 K. Notable, because those unearned runs aren’t exactly fair. McCarthy committed the two errors that rendered them unearned.
Kurt Suzuki: 2 for 4, 1 HR. That’s his third homer of the year, but second of the Texas series. In total he was 6 for 16.
Derek Holland: 7 IP, 8 H, 3 R, 2 ER, 2 BB, 4 K, 1 HR, 12 GB. The ground balls will lead to hits, but they’ll also keep runners moving station to station. This will bring down his ERA a bit, but it’s still considerably higher than his FIP and xFIP.
Also in this issue: Red Sox 9, Angels 5 | Braves 6, Brewers 2 | White Sox 6, Orioles 2 | Dodgers 5, Cubs 2 | Yankees 5, Tigers 3 | Nationals 2, Giants 2 | Marlins 6, Cardinals 5 | Pirates 4, Padres 3
What’s Wrong with Francisco Liriano?
After five terrible starts to open the season, it’s time to wonder what the heck is wrong with Francisco Liriano. Finally healthy in 2010, Liriano delivered the best season of his career – in which he finished first in the American League in xFIP and second in the AL in FIP (behind Cliff Lee). This season, Liriano looks less like the Minnesota Twins’ ace, and more like their 25th man. With Kevin Slowey preparing to take over in the rotation, can Liriano turn it around before he loses his spot?
Read the rest of this entry »
FanGraphs Power Rankings – 5/2/11
Welcome to the latest feature here at FanGraphs – our take on the Power Rankings that nearly every website in existence publishes, only with our own little twist.
In an effort to make this quantitative (that’s what we do around here, after all), we’re combining objective measures of 2011 performance with some subjective wisdom from our FanGraphs crowd. To this end, we’ve created a weighted system based on three factors — a WAR-based 2011 winning percentage (essentially, WAR/G shown as a winning percentage, or WAR% for short); the preseason Fan’s Standings determined from readership input ( which we’ll call FAN% for short); and the number of games each team has played. The two winning percentages are combined to create TOTAL%, on which the Power Rankings are based.
A team’s WAR% is given weighting equal to the percentage of 2011 season that the team has played. Right now, teams fall in the 15-18% range, as they have played between 26 and 29 games. As the season progresses — and we learn more about each team’s true level of talent — the WAR% will receive a greater weight with the FAN% receiving less weight. This system essentially acts as a built-in regression for current performance so that we don’t overreact to small samples of data, but it also allows for how teams have done to influence our evaluations of their abilities.
We think that our system can avoid doing crazy things like anointing the Indians the third-best team in baseball (where they score this week in WAR%), when the crowd initially thought Cleveland would be the 27th best team in the game. We’ll still acknowledge that the Indians’ performance has improved over the team’s expected performance going forward.
Our week will be Monday through Sunday, so expect each new installment on Monday afternoon. As always, we want to know what you think, so be sure to let us know in the comments.
1. New York Yankees: WAR% – .682 (2), FAN% – .580 (2), TOTAL% – .596
Despite quietly getting off to a great start — thanks to some unlikely contributions — those covering the Yankees still want you to think that the sky is falling.
Batter/Pitcher Splits Crib Sheet
I don’t know about everyone else, but it can be somewhat difficult for me to keep track of all the different splits that are worth remembering. We all know that batters typically fair better against opposite-handed pitchers, but sabermetric knowledge has now progressed to the point where that’s not the only thing to keep track of anymore. What about batted ball splits? Does this pitcher throw a dominant changeup, and if so, what are the platoon splits for changeups? How large of a sample size do I need before I can make assumptions about a player’s platoon split? It can be a lot of knowledge to remember, but it’s all important information in case you want to analyze a managerial move or lineup.
So below the jump, you’ll find a crib sheet for understanding lefty-right, batted ball, and pitch platoon splits. If you have any questions, feel free to ask in the comments.
Are the Indians For Real?
April is over, and as expected, the Cleveland Indians have the best record in baseball. Okay, you’re right, not one single person on this planet expected that. ZIPS projected 71 wins for the Tribe, while the readership here at FanGraphs was a little more optimistic, penciling them in for 73 victories. They’re currently on pace for 114 wins, and would need to play .400 baseball the rest of the way in order for the crowd’s projection to come true.
It’s not just wins and losses, either. The Indians have the best run differential in baseball (+47) and they’re second in the majors in team WAR (+10.5), trailing only the offensive juggernaut in St. Louis. The Indians aren’t winning a bunch of nail-biters, but, instead, they’re pounding their opponents into submission. At 5.41 runs scored per game, they’re nearly keeping pace with the Yankees offense, and yet they’re simultaneously holding opponents to just 3.67 runs per game. Only Oakland and Anaheim are preventing runs at a better rate.
So, 27 games of excellent baseball later, we have to ask the obvious question: are the Indians for real?
Forecasting the Dominance of Kimbrel, Venters
Watching the exploits of Atlanta’s dynamic duo – Jonny Venters and Craig Kimbrel – reminds me of another former 1-2 punch that was dominating during its time. Duane Ward and Tom Henke ruled high-leverage situations for the Toronto Blue Jays, and it was their success that helped the club win back-to-back World Series championships in 1992 and 1993.