2016 ZiPS Projections – Atlanta Braves

After having typically appeared in the very hallowed pages of Baseball Think Factory, Dan Szymborski’s ZiPS projections have been released at FanGraphs in recent years. The exercise continues this offseason. Below are the projections for the Atlanta Braves. Szymborski can be found at ESPN and on Twitter at @DSzymborski.
Batters
While it’s possible that Atlanta might extract two or more wins from other positions around the field this next year by means of platooning, the algorithm inside Dan Szymborski’s computer indicates that there’s only one player likely to surpass that threshold by his own self — namely, Freddie Freeman. The first baseman has recorded declining batting figures over the last three seasons (150 wRC+ in 2013, 141 wRC+ in 2014, 133 wC+ in 2015), but almost all that is a product of fluctuating BABIPs — and even the low end of that range is sufficient to render him a solidly above-average player.
Unfortunately for the 2016 edition of the club, Freeman is the only above-average — and perhaps even just average-average — player on the team. Newly acquired shortstop Erick Aybar is a candidate to provide adequacy — and, given sufficient playing time, young catcher Christian Bethancourt could possibly do that, as well — but the roster offers little else in the way of a reliable source of wins.
Pitchers
The members of Atlanta’s rotation represent greater cause for optimism than than their positional counterparts. Shelby Miller and Julio Teheran, in particular, are legitimately useful — and similar, too, in their way. Consider: over roughly the same timeframe, the pair have graduated from top prospects to promising young major leaguers to reliable starters. Each enters his own age-25 season projected to surpass the three-win mark.
As legitimately useful pitchers on a club that’s unlikely to contend, however, Miller and Teheran are also legitimate candidates to get traded. Indeed, Jeff Sullivan addressed that very contingency with regard to Miller yesterday in these pages.
With regard to the bullpen, Jason Grilli and Arodys Vizcaino represent solid options, provided they retain their health. Shae Simmons, who returns from a Tommy John procedure and the attendant rehab, is well-acquitted by ZiPS on a per-inning basis.
Bench/Prospects
Following a mid-season trade from the Dodgers, Cuban Hector Olivera received his first exposure to the majors in September, recording a roughly league-average batting line over 87 plate appearances. A roughly league-average batting line is what he’s expected to produce in 2016, as well — although, if it’s in left field (as opposed to third base), that’s less helpful.
One of the best projections in the system belongs to a player who’s never appeared in the majors: outfielder Mallex Smith. Acquired by Atlanta around this same time last year, Smith pairs above-average speed and center-field defense with average contact skills. The result: a roughly 1.5-win forecast, according to ZiPS. Promising, that, for a player entering just his age-23 season.
Depth Chart
Below is a rough depth chart for the present incarnation of the Atlantas, with rounded projected WAR totals for each player. For caveats regarding WAR values see disclaimer at bottom of post. Click to embiggen image.
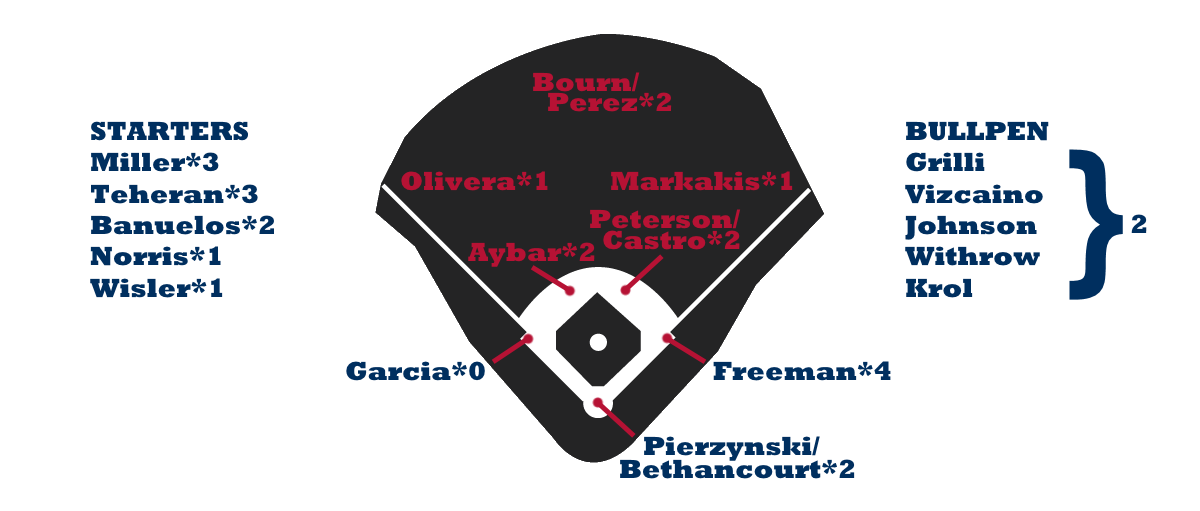
Ballpark graphic courtesy Eephus League. Depth charts constructed by way of those listed here at site and author’s own haphazard reasoning.
| Player | B | Age | PO | PA | R | H | 2B | 3B | HR | RBI | SB | CS |
| Freddie Freeman | L | 26 | 1B | 610 | 87 | 147 | 32 | 2 | 21 | 84 | 3 | 2 |
| Christian Bethancourt | R | 24 | C | 436 | 46 | 103 | 24 | 1 | 9 | 44 | 8 | 3 |
| Erick Aybar | B | 32 | SS | 607 | 73 | 154 | 31 | 4 | 6 | 50 | 13 | 6 |
| Mallex Smith | L | 23 | CF | 570 | 69 | 128 | 19 | 7 | 4 | 44 | 46 | 15 |
| Jace Peterson | L | 26 | 2B | 524 | 58 | 110 | 19 | 6 | 5 | 46 | 17 | 9 |
| Nick Markakis | L | 32 | RF | 639 | 73 | 159 | 29 | 1 | 7 | 49 | 2 | 1 |
| Michael Bourn | L | 33 | CF | 510 | 54 | 113 | 16 | 6 | 3 | 34 | 16 | 7 |
| Eury Perez | R | 26 | LF | 411 | 42 | 100 | 14 | 3 | 3 | 28 | 23 | 7 |
| Daniel Castro | R | 23 | SS | 548 | 57 | 132 | 20 | 3 | 4 | 42 | 5 | 4 |
| Dian Toscano | L | 26 | LF | 467 | 52 | 106 | 14 | 4 | 3 | 37 | 5 | 3 |
| A.J. Pierzynski | L | 39 | C | 365 | 31 | 91 | 16 | 1 | 7 | 40 | 0 | 2 |
| Hector Olivera | R | 31 | LF | 375 | 41 | 86 | 12 | 2 | 9 | 34 | 0 | 0 |
| Cedric Hunter | L | 28 | LF | 458 | 54 | 101 | 23 | 3 | 13 | 55 | 7 | 4 |
| Ryan Lavarnway | R | 28 | C | 258 | 25 | 55 | 11 | 0 | 4 | 20 | 0 | 0 |
| Nick Swisher | B | 34 | 1B | 478 | 49 | 94 | 22 | 1 | 13 | 50 | 1 | 1 |
| Luis Mateo | R | 26 | SS | 372 | 33 | 80 | 13 | 2 | 4 | 27 | 7 | 4 |
| Sean Kazmar | R | 31 | 3B | 337 | 34 | 77 | 18 | 3 | 3 | 30 | 3 | 1 |
| Reid Brignac | L | 30 | 2B | 339 | 31 | 67 | 14 | 1 | 4 | 26 | 2 | 1 |
| Adonis Garcia | R | 31 | 3B | 402 | 43 | 97 | 19 | 2 | 9 | 40 | 4 | 2 |
| Connor Lien | R | 22 | CF | 471 | 52 | 95 | 16 | 4 | 9 | 41 | 18 | 9 |
| Pedro Ciriaco | R | 30 | 3B | 294 | 28 | 71 | 12 | 2 | 2 | 23 | 9 | 2 |
| Mycal Jones | R | 29 | RF | 343 | 34 | 68 | 15 | 1 | 4 | 27 | 10 | 5 |
| Rio Ruiz | L | 22 | 3B | 555 | 56 | 112 | 24 | 2 | 8 | 49 | 2 | 3 |
| Johan Camargo | B | 22 | SS | 516 | 50 | 109 | 17 | 5 | 2 | 36 | 5 | 4 |
| Joey Terdoslavich | B | 27 | 1B | 431 | 49 | 95 | 21 | 2 | 11 | 44 | 2 | 3 |
| Jordy Lara | R | 25 | 3B | 494 | 50 | 105 | 23 | 3 | 9 | 48 | 1 | 1 |
| Wil Nieves | R | 38 | C | 104 | 8 | 21 | 5 | 0 | 1 | 9 | 0 | 0 |
| Jordan Lennerton | L | 30 | 1B | 438 | 43 | 84 | 17 | 1 | 10 | 36 | 0 | 1 |
| Brandon Snyder | R | 29 | 1B | 276 | 27 | 53 | 13 | 1 | 7 | 24 | 1 | 0 |
| Kyeong Kang | L | 28 | RF | 427 | 43 | 83 | 15 | 3 | 9 | 37 | 2 | 2 |
| Dustin Peterson | R | 21 | LF | 540 | 58 | 107 | 16 | 2 | 11 | 53 | 4 | 4 |
***
| Player | PA | BB% | K% | ISO | BABIP | AVG | OBP | SLG | wOBA |
| Freddie Freeman | 610 | 12.0% | 21.3% | .189 | .333 | .280 | .374 | .469 | .363 |
| Christian Bethancourt | 436 | 3.4% | 20.4% | .128 | .294 | .249 | .274 | .377 | .283 |
| Erick Aybar | 607 | 4.6% | 10.4% | .101 | .296 | .273 | .309 | .374 | .301 |
| Mallex Smith | 570 | 7.4% | 21.1% | .087 | .315 | .248 | .309 | .335 | .308 |
| Jace Peterson | 524 | 9.0% | 19.3% | .098 | .290 | .237 | .309 | .335 | .294 |
| Nick Markakis | 639 | 8.9% | 12.1% | .090 | .307 | .276 | .343 | .366 | .310 |
| Michael Bourn | 510 | 8.0% | 22.7% | .080 | .320 | .246 | .307 | .326 | .291 |
| Eury Perez | 411 | 4.4% | 18.5% | .077 | .324 | .265 | .312 | .342 | .303 |
| Daniel Castro | 548 | 3.6% | 11.3% | .074 | .283 | .257 | .284 | .331 | .270 |
| Dian Toscano | 467 | 11.3% | 12.8% | .075 | .296 | .259 | .347 | .334 | .308 |
| A.J. Pierzynski | 365 | 3.8% | 11.5% | .114 | .284 | .266 | .304 | .380 | .297 |
| Hector Olivera | 375 | 8.8% | 12.8% | .128 | .275 | .257 | .329 | .385 | .309 |
| Cedric Hunter | 458 | 6.3% | 16.8% | .161 | .263 | .240 | .291 | .401 | .303 |
| Ryan Lavarnway | 258 | 8.9% | 20.2% | .100 | .288 | .238 | .310 | .338 | .286 |
| Nick Swisher | 478 | 11.5% | 24.5% | .151 | .279 | .226 | .317 | .377 | .305 |
| Luis Mateo | 372 | 2.7% | 23.1% | .082 | .288 | .227 | .255 | .309 | .251 |
| Sean Kazmar | 337 | 3.9% | 14.5% | .104 | .275 | .242 | .274 | .346 | .272 |
| Reid Brignac | 339 | 8.3% | 22.4% | .093 | .280 | .221 | .290 | .314 | .267 |
| Adonis Garcia | 402 | 3.2% | 16.2% | .130 | .281 | .253 | .279 | .383 | .288 |
| Connor Lien | 471 | 4.9% | 34.4% | .118 | .325 | .218 | .270 | .336 | .279 |
| Pedro Ciriaco | 294 | 2.0% | 19.7% | .078 | .309 | .253 | .271 | .331 | .266 |
| Mycal Jones | 343 | 7.0% | 23.9% | .094 | .284 | .220 | .283 | .314 | .275 |
| Rio Ruiz | 555 | 8.5% | 23.4% | .103 | .283 | .222 | .289 | .325 | .275 |
| Johan Camargo | 516 | 5.0% | 16.7% | .071 | .278 | .232 | .273 | .303 | .252 |
| Joey Terdoslavich | 431 | 8.1% | 24.4% | .148 | .301 | .243 | .304 | .391 | .302 |
| Jordy Lara | 494 | 4.9% | 23.7% | .121 | .283 | .228 | .271 | .349 | .272 |
| Wil Nieves | 104 | 3.8% | 26.9% | .082 | .290 | .214 | .252 | .296 | .241 |
| Jordan Lennerton | 438 | 9.4% | 27.4% | .125 | .280 | .215 | .291 | .340 | .279 |
| Brandon Snyder | 276 | 6.5% | 37.3% | .141 | .317 | .209 | .268 | .350 | .273 |
| Kyeong Kang | 427 | 6.8% | 34.7% | .121 | .310 | .211 | .267 | .332 | .266 |
| Dustin Peterson | 540 | 5.4% | 30.0% | .105 | .286 | .212 | .256 | .317 | .256 |
***
| Player | PA | RC/27 | OPS+ | Def | zWAR | No.1 Comp |
| Freddie Freeman | 610 | 6.6 | 134 | 1 | 3.5 | Kent Hrbek |
| Christian Bethancourt | 436 | 3.8 | 80 | 4 | 1.7 | Jorge Pedre |
| Erick Aybar | 607 | 4.3 | 90 | -4 | 1.7 | Bill Russell |
| Mallex Smith | 570 | 4.1 | 80 | 1 | 1.3 | Milt Cuyler |
| Jace Peterson | 524 | 3.6 | 80 | 2 | 1.0 | Jeff Berblinger |
| Nick Markakis | 639 | 4.7 | 98 | -3 | 0.9 | Jose Vidro |
| Michael Bourn | 510 | 3.6 | 77 | 1 | 0.8 | Tom Goodwin |
| Eury Perez | 411 | 4.2 | 83 | 5 | 0.8 | Reggie Williams |
| Daniel Castro | 548 | 3.4 | 71 | 2 | 0.7 | Manuel Mayorson |
| Dian Toscano | 467 | 4.2 | 92 | 0 | 0.7 | Ken Ramos |
| A.J. Pierzynski | 365 | 4.1 | 90 | -8 | 0.6 | Brian Harper |
| Hector Olivera | 375 | 4.6 | 99 | -2 | 0.5 | Todd Betts |
| Cedric Hunter | 458 | 4.1 | 91 | 1 | 0.5 | Barry Bonnell |
| Ryan Lavarnway | 258 | 3.7 | 81 | -6 | 0.3 | Andy Dominique |
| Nick Swisher | 478 | 4.1 | 94 | -1 | 0.3 | Ron Santo |
| Luis Mateo | 372 | 2.7 | 57 | 5 | 0.2 | Jose Escobar |
| Sean Kazmar | 337 | 3.4 | 72 | 1 | 0.2 | Eddie Zosky |
| Reid Brignac | 339 | 3.2 | 69 | 2 | 0.2 | Luis Rivera |
| Adonis Garcia | 402 | 3.9 | 83 | -4 | 0.2 | Mike Cervenak |
| Connor Lien | 471 | 3.1 | 68 | 2 | 0.2 | Wilkin Ramirez |
| Pedro Ciriaco | 294 | 3.4 | 67 | 1 | 0.1 | Marv Breeding |
| Mycal Jones | 343 | 3.1 | 67 | 6 | 0.0 | T.J. Bohn |
| Rio Ruiz | 555 | 3.2 | 71 | -3 | -0.1 | Greg David |
| Johan Camargo | 516 | 2.8 | 61 | 0 | -0.2 | Luis Hernandez |
| Joey Terdoslavich | 431 | 4.1 | 93 | -3 | -0.3 | Mike Maksudian |
| Jordy Lara | 494 | 3.3 | 72 | -5 | -0.4 | Eric Duncan |
| Wil Nieves | 104 | 2.6 | 53 | -3 | -0.4 | Raul Chavez |
| Jordan Lennerton | 438 | 3.4 | 76 | 2 | -0.5 | Todd Mensik |
| Brandon Snyder | 276 | 3.3 | 71 | 1 | -0.5 | Paul Felix |
| Kyeong Kang | 427 | 3.0 | 66 | -2 | -1.2 | Justin Bowles |
| Dustin Peterson | 540 | 2.7 | 59 | -1 | -1.8 | Jon Farrell |
***
| Player | T | Age | G | GS | IP | K | BB | HR | H | R | ER |
| Shelby Miller | R | 25 | 32 | 31 | 186.0 | 164 | 66 | 18 | 167 | 77 | 72 |
| Julio Teheran | R | 25 | 31 | 31 | 197.0 | 175 | 57 | 23 | 183 | 86 | 80 |
| Manny Banuelos | L | 25 | 23 | 23 | 115.7 | 107 | 55 | 11 | 104 | 54 | 50 |
| Mike Minor | L | 28 | 21 | 21 | 128.0 | 106 | 37 | 18 | 121 | 61 | 57 |
| Bud Norris | R | 31 | 25 | 24 | 146.3 | 131 | 47 | 18 | 145 | 75 | 70 |
| Williams Perez | R | 25 | 26 | 25 | 133.7 | 95 | 48 | 14 | 138 | 68 | 64 |
| Matt Wisler | R | 23 | 29 | 28 | 156.7 | 123 | 46 | 22 | 162 | 83 | 78 |
| Sean Newcomb | L | 23 | 27 | 27 | 122.0 | 133 | 96 | 12 | 106 | 65 | 61 |
| Arodys Vizcaino | R | 25 | 48 | 0 | 48.0 | 51 | 18 | 4 | 41 | 18 | 17 |
| John Gant | R | 23 | 23 | 23 | 126.0 | 111 | 53 | 16 | 126 | 68 | 64 |
| Daniel Winkler | R | 26 | 13 | 12 | 62.3 | 61 | 22 | 9 | 57 | 31 | 29 |
| Jake Brigham | R | 28 | 28 | 15 | 103.7 | 73 | 36 | 11 | 108 | 55 | 51 |
| Jason Grilli | R | 39 | 39 | 0 | 36.0 | 42 | 12 | 3 | 30 | 13 | 12 |
| Ryan Weber | R | 25 | 34 | 14 | 105.3 | 70 | 18 | 15 | 113 | 56 | 52 |
| David Carpenter | R | 28 | 45 | 0 | 56.7 | 53 | 24 | 4 | 51 | 24 | 22 |
| Shae Simmons | R | 25 | 34 | 0 | 34.0 | 38 | 16 | 2 | 28 | 13 | 12 |
| Paco Rodriguez | L | 25 | 47 | 0 | 35.7 | 42 | 15 | 4 | 29 | 14 | 13 |
| Jason Frasor | R | 38 | 37 | 0 | 31.3 | 32 | 14 | 2 | 27 | 12 | 11 |
| Ian Krol | L | 25 | 61 | 0 | 57.0 | 61 | 22 | 6 | 50 | 25 | 23 |
| Mike Foltynewicz | R | 23 | 33 | 18 | 114.0 | 106 | 56 | 14 | 110 | 63 | 59 |
| Edwin Jackson | R | 32 | 51 | 0 | 55.0 | 49 | 22 | 5 | 51 | 25 | 23 |
| Jason Hursh | R | 24 | 31 | 19 | 113.0 | 66 | 38 | 11 | 124 | 63 | 59 |
| Chris Withrow | R | 27 | 26 | 0 | 29.3 | 34 | 17 | 3 | 23 | 13 | 12 |
| Tyler Jones | R | 26 | 47 | 0 | 55.7 | 52 | 25 | 5 | 51 | 26 | 24 |
| Peter Moylan | R | 37 | 41 | 0 | 37.3 | 31 | 14 | 3 | 37 | 17 | 16 |
| Michael Kohn | R | 30 | 40 | 0 | 36.7 | 40 | 23 | 4 | 30 | 17 | 16 |
| Kanekoa Texeira | R | 30 | 20 | 10 | 71.0 | 51 | 34 | 8 | 73 | 40 | 37 |
| David Aardsma | R | 34 | 46 | 0 | 44.3 | 47 | 20 | 5 | 38 | 20 | 19 |
| Jim Johnson | R | 33 | 64 | 0 | 64.0 | 52 | 22 | 5 | 64 | 30 | 28 |
| Danny Burawa | R | 27 | 49 | 2 | 68.7 | 67 | 37 | 7 | 62 | 34 | 32 |
| Ross Detwiler | L | 30 | 36 | 6 | 67.3 | 48 | 26 | 7 | 72 | 36 | 34 |
| Donnie Veal | L | 31 | 38 | 0 | 39.0 | 35 | 18 | 4 | 37 | 19 | 18 |
| Brandon Cunniff | R | 27 | 41 | 0 | 47.0 | 48 | 27 | 6 | 42 | 24 | 22 |
| Andrew McKirahan | L | 26 | 36 | 0 | 44.3 | 39 | 15 | 5 | 45 | 22 | 21 |
| Carlos Fisher | R | 33 | 35 | 0 | 44.3 | 49 | 29 | 5 | 38 | 22 | 21 |
| Tyrell Jenkins | R | 23 | 20 | 20 | 106.0 | 67 | 46 | 14 | 114 | 63 | 59 |
| Nick Masset | R | 34 | 46 | 0 | 43.7 | 37 | 22 | 4 | 43 | 22 | 21 |
| Alex White | R | 27 | 19 | 13 | 75.3 | 52 | 37 | 9 | 79 | 45 | 42 |
| Ryan Kelly | R | 28 | 49 | 0 | 55.0 | 50 | 23 | 8 | 53 | 29 | 27 |
| Lucas Sims | R | 22 | 23 | 23 | 111.3 | 88 | 62 | 15 | 113 | 67 | 63 |
| Matt Marksberry | L | 25 | 41 | 8 | 71.0 | 62 | 40 | 10 | 71 | 43 | 40 |
| Mauricio Cabrera | R | 22 | 33 | 2 | 44.0 | 41 | 33 | 5 | 42 | 27 | 25 |
| Sugar Ray Marimon | R | 27 | 28 | 19 | 112.7 | 73 | 46 | 18 | 123 | 71 | 66 |
| Mitchell Boggs | R | 32 | 30 | 0 | 38.7 | 18 | 22 | 5 | 44 | 26 | 24 |
| Victor Mateo | R | 26 | 26 | 25 | 139.0 | 75 | 58 | 20 | 155 | 88 | 82 |
| Zach Bird | R | 21 | 24 | 22 | 101.0 | 83 | 73 | 14 | 104 | 67 | 63 |
***
| Player | IP | TBF | K% | BB% | BABIP | ERA | FIP | ERA- | FIP- |
| Shelby Miller | 186.0 | 791 | 20.7% | 8.3% | .276 | 3.48 | 3.71 | 90 | 98 |
| Julio Teheran | 197.0 | 831 | 21.1% | 6.9% | .282 | 3.65 | 3.85 | 94 | 101 |
| Manny Banuelos | 115.7 | 506 | 21.1% | 10.9% | .286 | 3.89 | 4.18 | 100 | 110 |
| Mike Minor | 128.0 | 542 | 19.6% | 6.8% | .272 | 4.01 | 4.11 | 104 | 108 |
| Bud Norris | 146.3 | 631 | 20.8% | 7.4% | .300 | 4.31 | 4.14 | 111 | 109 |
| Williams Perez | 133.7 | 587 | 16.2% | 8.2% | .294 | 4.31 | 4.36 | 111 | 115 |
| Matt Wisler | 156.7 | 678 | 18.1% | 6.8% | .292 | 4.48 | 4.39 | 116 | 116 |
| Sean Newcomb | 122.0 | 568 | 23.4% | 16.9% | .295 | 4.50 | 4.82 | 116 | 127 |
| Arodys Vizcaino | 48.0 | 203 | 25.1% | 8.9% | .287 | 3.19 | 3.18 | 82 | 84 |
| John Gant | 126.0 | 557 | 19.9% | 9.5% | .297 | 4.57 | 4.48 | 118 | 118 |
| Daniel Winkler | 62.3 | 266 | 22.9% | 8.3% | .283 | 4.19 | 4.33 | 108 | 114 |
| Jake Brigham | 103.7 | 455 | 16.0% | 7.9% | .294 | 4.43 | 4.29 | 114 | 113 |
| Jason Grilli | 36.0 | 150 | 28.0% | 8.0% | .293 | 3.00 | 2.91 | 77 | 77 |
| Ryan Weber | 105.3 | 447 | 15.7% | 4.0% | .290 | 4.44 | 4.37 | 115 | 115 |
| David Carpenter | 56.7 | 245 | 21.6% | 9.8% | .292 | 3.49 | 3.59 | 90 | 95 |
| Shae Simmons | 34.0 | 146 | 26.0% | 11.0% | .295 | 3.18 | 3.28 | 82 | 86 |
| Paco Rodriguez | 35.7 | 151 | 27.8% | 9.9% | .281 | 3.28 | 3.44 | 85 | 91 |
| Jason Frasor | 31.3 | 135 | 23.7% | 10.4% | .291 | 3.16 | 3.19 | 82 | 84 |
| Ian Krol | 57.0 | 243 | 25.1% | 9.1% | .289 | 3.63 | 3.55 | 94 | 94 |
| Mike Foltynewicz | 114.0 | 508 | 20.9% | 11.0% | .294 | 4.66 | 4.50 | 120 | 119 |
| Edwin Jackson | 55.0 | 238 | 20.6% | 9.2% | .288 | 3.76 | 3.76 | 97 | 99 |
| Jason Hursh | 113.0 | 501 | 13.2% | 7.6% | .298 | 4.70 | 4.45 | 121 | 117 |
| Chris Withrow | 29.3 | 128 | 26.6% | 13.3% | .274 | 3.68 | 4.02 | 95 | 106 |
| Tyler Jones | 55.7 | 243 | 21.4% | 10.3% | .291 | 3.88 | 3.92 | 100 | 103 |
| Peter Moylan | 37.3 | 163 | 19.0% | 8.6% | .299 | 3.86 | 3.67 | 100 | 97 |
| Michael Kohn | 36.7 | 163 | 24.5% | 14.1% | .276 | 3.93 | 4.36 | 101 | 115 |
| Kanekoa Texeira | 71.0 | 320 | 15.9% | 10.6% | .291 | 4.69 | 4.75 | 121 | 125 |
| David Aardsma | 44.3 | 191 | 24.6% | 10.5% | .285 | 3.86 | 3.79 | 100 | 100 |
| Jim Johnson | 64.0 | 278 | 18.7% | 7.9% | .304 | 3.94 | 3.68 | 102 | 97 |
| Danny Burawa | 68.7 | 305 | 22.0% | 12.1% | .289 | 4.19 | 4.28 | 108 | 113 |
| Ross Detwiler | 67.3 | 300 | 16.0% | 8.7% | .304 | 4.54 | 4.38 | 117 | 115 |
| Donnie Veal | 39.0 | 172 | 20.3% | 10.5% | .295 | 4.15 | 4.24 | 107 | 112 |
| Brandon Cunniff | 47.0 | 210 | 22.9% | 12.9% | .283 | 4.21 | 4.44 | 109 | 117 |
| Andrew McKirahan | 44.3 | 193 | 20.2% | 7.8% | .303 | 4.26 | 3.95 | 110 | 104 |
| Carlos Fisher | 44.3 | 200 | 24.5% | 14.5% | .290 | 4.26 | 4.38 | 110 | 115 |
| Tyrell Jenkins | 106.0 | 478 | 14.0% | 9.6% | .290 | 5.01 | 5.09 | 129 | 134 |
| Nick Masset | 43.7 | 196 | 18.9% | 11.2% | .302 | 4.33 | 4.44 | 112 | 117 |
| Alex White | 75.3 | 342 | 15.2% | 10.8% | .292 | 5.02 | 4.93 | 130 | 130 |
| Ryan Kelly | 55.0 | 241 | 20.7% | 9.5% | .287 | 4.42 | 4.60 | 114 | 121 |
| Lucas Sims | 111.3 | 509 | 17.3% | 12.2% | .290 | 5.09 | 5.17 | 131 | 136 |
| Matt Marksberry | 71.0 | 324 | 19.1% | 12.3% | .293 | 5.07 | 5.06 | 131 | 133 |
| Mauricio Cabrera | 44.0 | 207 | 19.8% | 15.9% | .296 | 5.11 | 5.23 | 132 | 138 |
| Sugar Ray Marimon | 112.7 | 507 | 14.4% | 9.1% | .288 | 5.27 | 5.33 | 136 | 140 |
| Mitchell Boggs | 38.7 | 182 | 9.9% | 12.1% | .291 | 5.59 | 5.70 | 144 | 150 |
| Victor Mateo | 139.0 | 630 | 11.9% | 9.2% | .288 | 5.31 | 5.34 | 137 | 141 |
| Zach Bird | 101.0 | 480 | 17.3% | 15.2% | .296 | 5.61 | 5.67 | 145 | 149 |
***
| Player | IP | K/9 | BB/9 | HR/9 | ERA+ | zWAR | No. 1 Comp |
| Shelby Miller | 186.0 | 7.94 | 3.19 | 0.87 | 110 | 3.4 | Jon Garland |
| Julio Teheran | 197.0 | 7.99 | 2.60 | 1.05 | 105 | 3.1 | John Burkett |
| Manny Banuelos | 115.7 | 8.32 | 4.28 | 0.86 | 98 | 1.5 | Matt Whisenant |
| Mike Minor | 128.0 | 7.45 | 2.60 | 1.27 | 95 | 1.4 | Huck Flener |
| Bud Norris | 146.3 | 8.06 | 2.89 | 1.11 | 89 | 1.1 | Runelvys Hernandez |
| Williams Perez | 133.7 | 6.39 | 3.23 | 0.94 | 89 | 1.0 | Jake Dittler |
| Matt Wisler | 156.7 | 7.06 | 2.64 | 1.26 | 85 | 0.8 | Doug Waechter |
| Sean Newcomb | 122.0 | 9.81 | 7.08 | 0.89 | 85 | 0.6 | Neal Cotts |
| Arodys Vizcaino | 48.0 | 9.56 | 3.38 | 0.75 | 120 | 0.6 | Hipolito Pichardo |
| John Gant | 126.0 | 7.93 | 3.79 | 1.14 | 84 | 0.6 | Jesse Anderson |
| Daniel Winkler | 62.3 | 8.81 | 3.18 | 1.30 | 91 | 0.6 | Ken Chenard |
| Jake Brigham | 103.7 | 6.34 | 3.12 | 0.95 | 86 | 0.5 | Elliot Brown |
| Jason Grilli | 36.0 | 10.50 | 3.00 | 0.75 | 127 | 0.5 | Doug Bair |
| Ryan Weber | 105.3 | 5.98 | 1.54 | 1.28 | 86 | 0.4 | Chris Holt |
| David Carpenter | 56.7 | 8.41 | 3.81 | 0.63 | 109 | 0.4 | Mike Schultz |
| Shae Simmons | 34.0 | 10.06 | 4.24 | 0.53 | 120 | 0.4 | Brad Voyles |
| Paco Rodriguez | 35.7 | 10.59 | 3.78 | 1.01 | 117 | 0.4 | Thomas Hart |
| Jason Frasor | 31.3 | 9.20 | 4.03 | 0.58 | 121 | 0.4 | George Caster |
| Ian Krol | 57.0 | 9.63 | 3.47 | 0.95 | 105 | 0.3 | Clay Rapada |
| Mike Foltynewicz | 114.0 | 8.37 | 4.42 | 1.11 | 83 | 0.2 | Earl Sanders |
| Edwin Jackson | 55.0 | 8.02 | 3.60 | 0.82 | 102 | 0.2 | Jason Bullard |
| Jason Hursh | 113.0 | 5.26 | 3.03 | 0.88 | 81 | 0.2 | Jim Adamczak |
| Chris Withrow | 29.3 | 10.44 | 5.22 | 0.92 | 104 | 0.1 | Scott Fredrickson |
| Tyler Jones | 55.7 | 8.40 | 4.04 | 0.81 | 99 | 0.1 | Ryan Baker |
| Peter Moylan | 37.3 | 7.48 | 3.38 | 0.72 | 99 | 0.1 | Ben Weber |
| Michael Kohn | 36.7 | 9.81 | 5.64 | 0.98 | 97 | 0.1 | Mike Cook |
| Kanekoa Texeira | 71.0 | 6.46 | 4.31 | 1.01 | 81 | 0.1 | Trey Hodges |
| David Aardsma | 44.3 | 9.55 | 4.06 | 1.02 | 99 | 0.1 | Archie Corbin |
| Jim Johnson | 64.0 | 7.31 | 3.09 | 0.70 | 97 | 0.1 | Bobby Munoz |
| Danny Burawa | 68.7 | 8.78 | 4.85 | 0.92 | 91 | 0.0 | Andrew Brown |
| Ross Detwiler | 67.3 | 6.42 | 3.48 | 0.94 | 84 | 0.0 | Joe Beimel |
| Donnie Veal | 39.0 | 8.08 | 4.15 | 0.92 | 92 | -0.1 | Joey Eischen |
| Brandon Cunniff | 47.0 | 9.19 | 5.17 | 1.15 | 91 | -0.1 | Henry Owens |
| Andrew McKirahan | 44.3 | 7.92 | 3.05 | 1.02 | 90 | -0.1 | Jason Sekany |
| Carlos Fisher | 44.3 | 9.95 | 5.89 | 1.02 | 90 | -0.1 | Archie Corbin |
| Tyrell Jenkins | 106.0 | 5.69 | 3.91 | 1.19 | 76 | -0.2 | Jim Henderson |
| Nick Masset | 43.7 | 7.62 | 4.53 | 0.82 | 88 | -0.2 | Jerry Johnson |
| Alex White | 75.3 | 6.22 | 4.42 | 1.08 | 76 | -0.2 | Jason Baker |
| Ryan Kelly | 55.0 | 8.18 | 3.76 | 1.31 | 87 | -0.2 | Doug Gogolewski |
| Lucas Sims | 111.3 | 7.12 | 5.01 | 1.21 | 75 | -0.2 | Nick Skuse |
| Matt Marksberry | 71.0 | 7.86 | 5.07 | 1.27 | 75 | -0.4 | Mark Lukasiewicz |
| Mauricio Cabrera | 44.0 | 8.39 | 6.75 | 1.02 | 75 | -0.4 | Brett Wayne |
| Sugar Ray Marimon | 112.7 | 5.83 | 3.67 | 1.44 | 72 | -0.7 | Joe Law |
| Mitchell Boggs | 38.7 | 4.19 | 5.12 | 1.16 | 68 | -0.8 | Mike Sullivan |
| Victor Mateo | 139.0 | 4.86 | 3.76 | 1.29 | 72 | -0.8 | Vance Cozier |
| Zach Bird | 101.0 | 7.40 | 6.50 | 1.25 | 68 | -0.9 | Joel Santo |
***
Disclaimer: ZiPS projections are computer-based projections of performance. Performances have not been allocated to predicted playing time in the majors — many of the players listed above are unlikely to play in the majors at all in 2016. ZiPS is projecting equivalent production — a .240 ZiPS projection may end up being .280 in AAA or .300 in AA, for example. Whether or not a player will play is one of many non-statistical factors one has to take into account when predicting the future.
Players are listed with their most recent teams unless Dan has made a mistake. This is very possible as a lot of minor-league signings are generally unreported in the offseason.
ZiPS is projecting based on the AL having a 3.95 ERA and the NL having a 3.79 ERA.
Players that are expected to be out due to injury are still projected. More information is always better than less information and a computer isn’t what should be projecting the injury status of, for example, a pitcher with Tommy John surgery.
Regarding ERA+ vs. ERA- (and FIP+ vs. FIP-) and the differences therein: as Patriot notes here, they are not simply mirror images of each other. Writes Patriot: “ERA+ does not tell you that a pitcher’s ERA was X% less or more than the league’s ERA. It tells you that the league’s ERA was X% less or more than the pitcher’s ERA.”
Both hitters and pitchers are ranked by projected zWAR — which is to say, WAR values as calculated by Dan Szymborski, whose surname is spelled with a z. WAR values might differ slightly from those which appear in full release of ZiPS. Finally, Szymborski will advise anyone against — and might karate chop anyone guilty of — merely adding up WAR totals on depth chart to produce projected team WAR.
Carson Cistulli has published a book of aphorisms called Spirited Ejaculations of a New Enthusiast.
Atlanta’s management should apologize to everyone for the miserable excuse of a team that they are fielding this year.
It’s disgraceful. Their salary-reduction trades have been pathetic. They should be ashamed of themselves.
uhhhh, this is called a rebuild. See Astros, Houston; Cubs, Chicago; Phillies, Philadelphia.
As pointed out here and also at baseball prospectus, this is a crazy rebuild where young, cost controlled assists are being shipped out. Usually one tries to build around players like Simmons, not ship them out.
Yep, everything made at least a bit of sense before that.
Yeah, that’s what confuses me too. Simmons was good and cost controlled, and let’s face it, their core wasn’t THAT bad when the rebuild began. I mean, Heyward/Simmons/Freeman/Teheran is as good a young core as just about any team.
I saw it as either you keep Heyward and Upton (and Kimbrel) and try to win or you get rid of both of them (and Kimbrel is okay too). Doing that would at most leave a bad farm system and if you need to make trades to improve it could end up terrible, and the window closes in 2015 and you are looking at several very bad years. Of course, if there aren’t a few hits on these prospects, that could end up happening anyway. Either way, you don’t trade young good players that are cheap for 5 years for iffy prospects.
well, with Simmons, I am not sure anyone knows how his defense will age, so I can see them getting what they can for him, especially with Albies in their farm.
Heyward – I thought they were never going to sign him after they signed Simmons/Freeman, etc to LT deals. Plus, while his D is terrific, the power never re-appeared after the shoulder injury.
Kimbrel – you have to deal your closer in a rebuild.
At this point, you may as well deal Freeman. But he is cost controlled and he puts fans in the seats.
Actually, we do have a pretty good idea about how Simmons’ defense will age: http://www.fangraphs.com/blogs/how-did-previous-andrelton-simmonses-age/
It was a terrible trade for the Braves.
This is NOT a rebuild. The Simmons trade proved that. It’s a pure salary dump. And it’s a disgrace to baseball.
How is getting the top 2 prospects from a team, plus a veteran to fill the hole of the position we traded away, not a rebuild..
Not to mention Aybar will make more than Simmons this year.